
Jira is a widely used project management tool that enables teams to work together efficiently and achieve outstanding outcomes. The Jira dashboard is a vital component of this tool, offering teams valuable insights, metrics, and project visibility. In this journey, we will explore the potential of Jira dashboards and learn how to leverage their full capabilities.
What is a Jira dashboard?
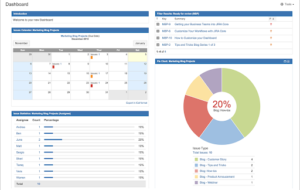
A Jira dashboard serves as the nerve center of project activity, offering a consolidated view of tasks, progress, and key metrics. It gives stakeholders a centralized location to monitor project health, track progress, and make informed decisions.
What are the Components of a Jira Dashboard?
Gadgets
These modular components provide specific information and functionality, such as task lists, burndown charts, and activity streams. There are several gadgets built into Jira such as filter results gadget, issue statistics gadget, and road map gadget. However, additional gadgets can also be downloaded from the Atlassian Marketplace. Some of them are the pivot gadget and gauge gadget.
Reports
Jira dashboards host various reports, including velocity charts, sprint summaries, and issue statistics, offering valuable insights into team performance, and project trends.
Why is it Used?
Jira dashboards are used for several reasons:
- Visibility: Dashboards offer stakeholders a real-time snapshot of project status and progress, promoting transparency and accountability.
- Decision Making: By providing access to actionable insights and performance metrics, dashboards enable data-driven decision-making, leading to more informed choices.
- Collaboration: Dashboards foster collaboration by providing a centralized platform for teams to track tasks, share updates and communicate effectively.
- Efficiency: Dashboards streamline project management processes and enhance team productivity by consolidating project information and metrics in one location.
The default Jira dashboard
The default dashboard is also known as the system dashboard. It is the screen Jira users see the first time they log in. It includes gadgets from Jira’s pre-installed selection and is limited to only one dashboard page.
Creating your Jira dashboard
Creating custom dashboards requires careful planning and consideration of project objectives and team requirements. Let’s explore the step-by-step process of crafting a bespoke dashboard:
Create a new dashboard
Log in to your Jira account. Go to the dashboard and click ‘Create Dashboard’.
Define dashboard objectives
Start by defining the objectives and goals of your dashboard page. Determine what information is crucial for your team to track and monitor, and tailor your dashboard accordingly.
Select relevant gadgets and reports
Choose gadgets and reports that align with your project’s needs and objectives. When curating your dashboard content, consider factors such as team workflow, project complexity, and stakeholder requirements.
Opt for your preferred layout and configuration
Choose your preferred dashboard layout and configuration to ensure optimal visibility and usability for all stakeholders. Arrange gadgets and reports logically and intuitively to facilitate easy navigation and information access.
Iterative refinement
Embrace an iterative dashboard refinement approach. Solicit user and stakeholder feedback to improve its effectiveness and usability continuously. Regularly assess and update your dashboard to reflect evolving project needs and priorities.
Share the dashboard with team members
Don’t forget to share the Jira dashboard with the team. This ensures transparency and fosters a collaborative culture. By granting appropriate permissions, they can view and interact with the dashboard and get real-time updates.
JIRA dashboard examples
Personal dashboard
A personal dashboard is tailored to individual needs and offers various advantages in streamlining workflow management and improving productivity. It provides a centralized platform for organizing and visualizing user’s tasks, different projects, issues, etc.
Sprint burndown dashboard
This dashboard gives real-time updates on whether the team is on pace to meet a sprint goal. It offers a glimpse of how much work is left in the queue and how long your team will take to complete it. Moreover, the sprint burndown dashboard allows you to jump on any issue when the remaining workload is pacing slower than the delivery date.
Workload dashboard
The workload dashboard, also known as the monitor resource dashboard tracks the amount of work assigned to each team member and adjusts their workload accordingly. It helps identify workload patterns and plan resource allocation.
Issue tracking dashboard
The issue tracking dashboard allows users to quickly identify and prioritize the most important issues. It focuses on providing visibility into the status and progress of issues or tickets within a project.
Maximizing dashboard impact
To maximize the impact of your Jira dashboard, consider the following best practices:
Promote transparency and collaboration
Share your dashboard with relevant stakeholders to promote transparency and collaboration. Encourage team members to actively engage with the dashboard and provide feedback to drive continuous improvement.
Leverage automation and integration
Integrating your Jira dashboard with other tools and systems is the best way to automate data capture and reporting processes. Leverage integration capabilities to streamline workflow management and enhance productivity.
Foster data-driven decision making
Empower project teams and leaders to make informed decisions by providing access to actionable insights and performance metrics through the dashboard. Encourage data-driven discussions and decision-making to drive project success.
Advanced dashboard customization
Take your Jira dashboard customization to the next level with advanced techniques and strategies:
Dashboard filters and contextualization
Implement filters and contextualization techniques to personalize the dashboard experience for individual users or specific project phases. Allow users to tailor the dashboard view based on their preferences and requirements.
Dynamic dashboard updates
Utilize dynamic updating capabilities to ensure that your dashboard reflects real-time changes and updates in project data. Implement automated refresh intervals and notifications to keep stakeholders informed and engaged.
Custom gadgets and extensions
Explore the possibilities of custom gadgets and extensions to extend the functionality of your Jira dashboard. Develop custom gadgets or integrate third-party extensions to address unique project requirements and enhance user experience.
How Typo's sprint analysis feature is useful for the Jira dashboard?
Typo’s sprint analysis feature can be seamlessly integrated with the Jira dashboard. It allows to track and analyze the team’s progress throughout a sprint and provides valuable insights into work progress, work breakup, team velocity, developer workload, and issue cycle time.
The benefits of Sprint analysis feature are:
- It helps spot potential issues early, allowing for corrective action to avoid major problems.
- Pinpointing inefficiencies, such as excessive time spent on tasks, enables workflow improvements to boost team productivity.
- Provides real-time progress updates, ensuring deadlines are met by highlighting areas needing adjustments.
The better way to achieve project excellence
A well-designed Jira dashboard is a catalyst for project excellence, providing teams with the insights and visibility they need to succeed. By understanding its components, crafting a tailored dashboard, and maximizing its impact, you can unlock Jira dashboards’ full potential and drive your projects toward success.
Furthermore, while Jira dashboards offer extensive functionalities, it’s essential to explore alternative tools that may simplify the process and enhance user experience. Typo is one such tool that streamlines project management by offering intuitive dashboard creation, seamless integration, and a user-friendly interface. With Typo, teams can effortlessly visualize project data, track progress, and collaborate effectively, ultimately leading to improved productivity and project outcomes. Explore Typo today and revolutionize your project management experience.