Top Picks

Choosing the right engineering management platform is more critical than ever in 2026. This guide reviews the best alternatives to Jellyfish for engineering leaders, managers, and decision-makers who are seeking to optimize team performance, align engineering with business goals, and adapt to the rapidly evolving landscape of AI, developer experience, and workflow automation. With the increasing importance of actionable insights, real-time data, and seamless integration, selecting the right platform can directly impact your organization’s ability to deliver value, improve productivity, and stay competitive.

Jellyfish built its reputation as the pioneer engineering management platform. Since launching in 2017, the company has raised $114.5 million in funding from Accel, Insight Partners, and Tiger Global. Its core strength is aligning engineering work with business objectives, giving CFOs and VPs of Engineering a shared language around investment allocation, resource planning, engineering effort, and resource allocation—key aspects tracked by such platforms for effective capacity planning and workload management.

That positioning served enterprise buyers well for years. But the engineering intelligence category has shifted. AI coding tools are now standard across most teams. The 2025 DORA Report introduced new measurement frameworks. Developer experience has become a board-level priority. Today, aligning engineering activities with business goals and supporting business teams with actionable insights is critical for organizations seeking to optimize outcomes.

Platforms must now provide seamless integration with existing tools to enable real-time data aggregation, supporting new measurement frameworks and the growing focus on developer experience.

The question is no longer “Where is my engineering time going?” It is “How do I measure the real impact of AI tools on delivery, code quality, and developer experience, all at once?” Making data-driven decisions is now essential for evaluating the impact of engineering investments and driving continuous improvement.

If you are evaluating Jellyfish alternatives, you are likely dealing with one or more of these friction points.

Why Engineering Teams Look Beyond Jellyfish

Jellyfish is a capable platform for enterprise engineering management. It does several things well: investment allocation, capacity planning, R&D cost reporting, and executive dashboards. For organizations with deep Jira workflows and clean data hygiene, it provides solid visibility into where engineering time goes. Jellyfish focuses on quantitative metrics and tracking key metrics, offering dashboards and reports that help monitor team performance, but it may lack qualitative and tailored insights that provide a more complete understanding of engineering productivity.

But several patterns consistently push teams toward alternatives.

Pricing requires a sales conversation. Jellyfish does not publish pricing publicly. According to Vendr’s 2026 analysis, buyers with 50–150 engineering seats on annual contracts often see pricing in the range of $50,000–$120,000 per year. For mid-market teams with 50–200 engineers, that is a significant commitment before you have even seen the platform in action.

Setup and onboarding take time. Multiple competitor analyses and user reviews on G2 note that Jellyfish has a steep learning curve. Users report that training is vital to use the product well, and initial configuration can take weeks. Several G2 reviewers cite complex setup and the need for dedicated staff to manage the platform.

Heavy Jira dependency. Jellyfish treats Jira as its primary system of record. For teams using Linear, GitHub Issues, or hybrid setups, this Jira-centricity can become a constraint. As Faros AI’s analysis points out, Jellyfish’s approach can undercount engineering activities not tied to Jira issues. When only quantitative data is considered, technical debt and workflow bottlenecks can be overlooked, impacting long-term engineering efficiency.

Limited AI coding impact measurement until recently. Jellyfish launched AI Impact tracking in late 2024 and has expanded it since. However, many teams evaluating alternatives report needing deeper AI measurement: not just adoption tracking (who is using Copilot or Cursor), but actual impact on cycle time, code quality, and PR outcomes across AI-assisted versus non-AI PRs.

No automated code review. Jellyfish does not include a code review agent. If you want AI-powered code review alongside your engineering analytics, you need a separate tool or a platform that bundles both.

Customization gaps. G2 reviews consistently flag limited customization as a friction point. Of the top complaint themes, 21 mentions specifically call out lack of custom reporting flexibility, and 19 mentions note limited features and integration depth. Teams increasingly need comprehensive code insights and tailored insights to better understand team performance and address unique workflow challenges.

Many software teams struggle with the limitations of purely quantitative data, realizing it doesn't tell them how to improve or what's happening outside of platforms like Git and Jira, which can hinder actionable progress and slow development speed.

What to Look for in a Jellyfish Alternative

Before comparing specific platforms, it helps to know what separates a useful engineering intelligence tool from one that creates more dashboard fatigue. Here is what matters in 2026. Seamless integration with existing tools and customizable dashboards is essential for capturing real time data, enabling actionable insights, and supporting better decision-making across engineering teams.

  • DORA metrics and SDLC visibility that go beyond Jira. The 2025 DORA Report added a fifth metric, deployment rework rate, and replaced the old elite/high/medium/low tiers with seven team archetypes. Your platform should reflect this, while also tracking team dynamics and operational efficiency to optimize collaboration and delivery.
  • AI coding tool impact measurement. Not just license adoption counts, but actual delivery impact: how do AI-assisted PRs compare to non-AI PRs on cycle time, merge rate, and code quality?
  • Automated code review. AI code review agents have seen adoption jump from 14.8% to 51.4% between January and October 2025. A platform that includes code review alongside analytics removes a tool from your stack.
  • Developer experience measurement. Gartner reports that 58% of engineering leaders now consider DevEx a critical metric. Survey-based DevEx signals correlated with delivery data give a fuller picture than output metrics alone, especially when measuring developer productivity and using data-driven insights for continuous improvement.
  • Fast setup. If a platform takes weeks to configure, you are paying for time you do not have. Look for tools that connect in minutes, not months.
  • Transparent pricing. If you cannot estimate cost before a sales call, budget planning becomes guesswork.

Effective AI-powered workflow optimization requires tools that provide clear, actionable insights to highlight bottlenecks in the development process and offer specific recommendations for data-driven improvements. Seamless integration with existing tools is crucial for automatic data capture and improved decision-making.

Why Teams Choose Jellyfish Alternatives

Alternatives to Jellyfish, such as DX, LinearB, Swarmia, Haystack, Waydev, and Pluralsight Flow, address the main limitations of Jellyfish by offering a more comprehensive approach to engineering management. These platforms combine both qualitative and quantitative insights, allowing teams to track performance and identify bottlenecks more effectively. Platforms like Swarmia and Pluralsight Flow provide engineering teams with tools that focus on team dynamics and workflow optimization, which can be more beneficial than Jellyfish's top-down reporting approach. Jellyfish is often criticized for its limited customization and lack of focus on developer experience, which has led many teams to seek alternatives that offer better insights into daily challenges faced by developers. Additionally, alternatives like Haystack and Waydev emphasize real-time insights and proactive identification of bottlenecks, enhancing team productivity compared to Jellyfish's more rigid reporting structure.

Jellyfish Alternatives at a Glance

When evaluating alternatives to Jellyfish, it's important to consider how some platforms position themselves as engineering effectiveness platforms—offering not just analytics, but comprehensive solutions for operational efficiency, code quality, and developer productivity. The table below compares seven alternatives across the capabilities that matter most for engineering leaders in 2026.

Platform DORA Metrics AI Code Impact AI Code Review DevEx Surveys Setup Speed Pricing
Typo Yes (5 metrics) Native Built-in Built-in Fast Self-serve, free trial
LinearB Yes Native Basic No Moderate Free tier + paid
Swarmia Yes Native No Limited Fast Transparent tiers
DX Yes Native No Core product Moderate Sales-led
Haystack Yes Limited No No Fast Transparent
Waydev Yes Limited Basic Limited Moderate Sales-led
Pluralsight Flow Yes No No No Moderate Bundled

Notably, alternatives to Jellyfish such as DX and Typo AI combine both qualitative and quantitative insights, enabling teams to track performance and identify bottlenecks more effectively than platforms focused solely on high-level metrics.

1. Typo AI: Best All-in-One for AI-Native Engineering Teams

Typo AI is an engineering effectiveness platform that combines SDLC visibility, AI coding tool impact measurement, automated AI code reviews, and developer experience surveys in a single product. It provides comprehensive code insights and tracks DORA and SPACE metrics to help teams optimize productivity, software health, and operational efficiency. Typo connects to GitHub, GitLab, Bitbucket, Jira, Linear, and CI/CD pipelines.

Where Typo differs from Jellyfish is scope and speed. Jellyfish focuses primarily on engineering-to-business alignment, investment allocation, and financial reporting. Typo starts from how work actually moves through the SDLC and layers in AI impact, code quality, and developer experience on top of that foundation, reflecting its broader mission to redefine engineering intelligence.

Key strengths:

  • AI Coding Impact: Typo AI tracks adoption of GitHub Copilot, Cursor, Claude Code, and CodeWhisperer. It measures AI code changes percentage, acceptance rates, and compares metrics between AI-assisted and non-AI PRs across teams, developers, languages, and tools. This goes beyond license-count tracking to answer the question: “Is AI actually improving our delivery?”
  • Automated AI Code Reviews: Context-aware, LLM-powered reviews on every pull request, including AI-powered PR summaries and review time estimates that streamline reviewer focus. Typo’s approach applies AI to remote code review workflows, with PR health scores, merge confidence signals, security checks, and auto-suggested fixes. Typo’s code review agent understands the team’s codebase and engineering patterns, delivering signal-first feedback rather than generic noise.
  • DevEx Intelligence: Research-backed developer experience measurement using anonymous AI-chatbot surveys that achieve higher response rates than traditional survey tools. Benchmarks against industry and team-size comparisons.
  • Performance and Quality Metrics: Typo combines performance and quality metrics to deliver actionable insights, supporting team efficiency and team collaboration through real-time data and analytics.
  • Setup in 60 seconds: Self-serve onboarding. No weeks of configuration. No sales call required to get started.

Customer proof points:

  • Groundworks achieved a 40% reduction in critical code quality issues.
  • JemHR saw 50% improvement in PR cycle time.
  • StackGen reduced PR review time by 30%.
  • Requestly reported a 30% increase in deployment frequency.
  • Prendio achieved 20% more deployments.
  • Typo’s real-time visibility into engineering workflows supports continuous improvement.

Typo is a G2 Leader with 150+ reviews, trusted by 1,000+ engineering teams, and featured in Gartner’s Market Guide for Software Engineering Intelligence Platforms.

Best for: Engineering teams at mid-market SaaS companies (50–500 engineers) who need unified visibility across delivery, AI impact, code quality, and developer experience, without the enterprise pricing or multi-week onboarding—and who are evaluating why companies choose Typo for this use case.

2. LinearB: Best for Workflow Automation and Process Metrics

LinearB focuses on engineering workflow automation, DORA metrics, and cycle time analytics. As an engineering analytics tool, it provides instant insights and workflow automation, delivering automated improvement actions like PR bots and alerts that help teams enforce working agreements around PR size, review turnaround, and merge frequency.

Where LinearB stands out: It is actionable at the team level. Instead of high-level allocation reporting, LinearB provides specific bottleneck identification, tracks key engineering metrics, and offers automated fixes. The free tier is generous for small teams, making it an accessible starting point.

Where it falls short versus Jellyfish alternatives: LinearB does not include native AI coding impact measurement. It does not offer automated code review. And it lacks DevEx survey capabilities. Teams who need to measure how AI tools affect delivery or who want code review bundled into their analytics platform will need to look elsewhere.

Best for: Engineering managers focused on process efficiency who want automated interventions in their development pipeline, particularly those starting with a free-tier budget. Alternatives like Haystack and Waydev emphasize real-time insights and proactive identification of bottlenecks, enhancing team productivity.

3. Swarmia: Best for Developer-First DORA Metrics

Swarmia combines DORA metrics with developer experience signals. It tracks cycle time, deployment frequency, and review throughput alongside “working agreements” that let teams set norms like PR size limits and review turnaround expectations. Swarmia helps development teams and software development teams track quality metrics and improve team's productivity by providing actionable insights and real-time analytics.

Where Swarmia stands out: Clean UX. Team-first approach. Positions itself explicitly as the “humane alternative to engineering surveillance,” which resonates with engineering leaders who care about developer experience as much as process metrics. The company raised €10 million in June 2025, signaling continued growth.

Where it falls short: No automated code review. Limited AI coding impact measurement. Limited customization for complex enterprise needs. G2 and Reddit discussions consistently cite feature depth as the primary gap compared to more comprehensive platforms.

Best for: Teams starting their metrics journey who want clean dashboards and team-first norms without enterprise complexity.

4. DX: Best for Research-Backed Developer Experience Measurement

DX (formerly GetDX) is an engineering intelligence platform founded by the researchers who created the DORA, SPACE, and DevEx frameworks. It combines structured developer surveys with system metrics through its Data Cloud product to measure developer experience, productivity friction, and organizational health, while also measuring developer productivity and individual performance metrics. DX incorporates developer feedback as a qualitative element, ensuring that both quantitative data and direct input from developers are used to identify issues and suggest improvements.

Where DX stands out: Deep research pedigree. The DX Core 4 framework is becoming a standard reference in the DevEx space. No other tool has the same academic backing for its measurement methodology. DX leverages the SPACE framework (Satisfaction, Performance, Activity, Communication, Efficiency) to provide a holistic view of developer experience and productivity.

Where it falls short: DX is primarily a survey and sentiment platform. It incorporates self reported metrics from developers, which complements system-generated data, but does not include automated code review, native AI coding impact measurement, or deep SDLC analytics. If you need to see how work moves through your pipeline, diagnose PR bottlenecks, or track AI tool impact on cycle time, DX will not cover those use cases alone.

Best for: Organizations investing heavily in developer experience improvement and platform engineering who want the most rigorous DevEx measurement methodology available.

5. Haystack: Best Lightweight Option for Smaller Teams

Haystack is a lightweight engineering analytics platform focused on DORA metrics, delivery visibility, and team health. It targets teams that want engineering metrics without the complexity of enterprise platforms, while providing real time data and real time visibility for distributed teams and software teams.

Where Haystack stands out: Quick setup, transparent pricing, and a focused feature set that does not overwhelm smaller teams. For engineering managers overseeing 5–50 developers who need basic delivery visibility, Haystack provides fast time-to-value.

Where it falls short: No AI coding impact measurement. No automated code review. No DevEx surveys. As teams scale past 50–100 engineers or need to measure AI tool ROI, Haystack’s feature set may not keep pace.

Best for: Small-to-mid engineering teams (under 50 developers) who want straightforward delivery metrics without enterprise complexity or pricing.

6. Waydev: Best for Git-Level Developer Analytics

Waydev is an engineering intelligence platform that uses DORA metrics, the SPACE framework, developer experience insights, and AI capabilities to provide delivery analytics. It automatically tracks work from Git activity, visualizes project timelines, and includes basic code review workflow features, while also offering detailed analytics on pull requests and the entire development lifecycle.

Where Waydev stands out: Automated work logs from Git activity eliminate manual entry. Project timeline visualization gives clear progress views. Sprint planning integration supports agile workflows. Waydev also supports the software delivery process by providing engineering insights that help teams optimize performance and identify bottlenecks.

Where it falls short: AI coding impact measurement is limited. Code review capabilities are basic compared to dedicated AI code review tools. DevEx survey depth does not match platforms like DX or Typo.

Best for: Teams that want Git-level activity analytics with automated work tracking and sprint planning support.

7. Pluralsight Flow: Best for Organizations Already Using Pluralsight

Pluralsight Flow (formerly GitPrime) tracks coding activity: commits, lines of code, code churn, and review patterns. It was acquired by Appfire from Pluralsight in February 2025 and now operates as a standalone product within the Appfire ecosystem alongside BigPicture PPM and 7pace Timetracker. Flow also enables tracking of individual performance and individual performance metrics, providing visibility into productivity metrics and key metrics for both teams and developers—similar to platforms like Code Climate Velocity.

Where Flow stands out: Mature Git activity analytics with ML-powered insights. The Appfire ecosystem positions it alongside project management tools. For organizations already invested in Pluralsight for developer training, Flow provides natural synergy.

Where it falls short: No AI coding impact measurement. No automated code review. No DevEx surveys. No manager productivity agents. The platform focuses on Git-level patterns rather than full SDLC visibility, and it does not cover sprint analytics, deployment metrics, or incident tracking.

Best for: Large organizations that want mature Git analytics and are already invested in the Appfire or Pluralsight ecosystem.

How to Choose the Right Jellyfish Alternative

The right platform depends on what gap Jellyfish is not filling for your team. Here is a framework for making the decision. For engineering organizations, leveraging data-driven approaches and data-driven insights is essential—these enable leaders to make informed decisions, optimize workflows, and align engineering efforts with strategic goals.

If your primary need is measuring AI coding tool impact: Typo is the strongest option for improving developer productivity with AI intelligence. It natively tracks GitHub Copilot, Cursor, Claude Code, and CodeWhisperer, and compares AI-assisted versus non-AI PR outcomes on cycle time, quality, and developer experience. Jellyfish added AI Impact tracking recently, but Typo’s approach measures verified impact, not just adoption.

If you need automated code review bundled with analytics: Typo is the only platform on this list that includes a context-aware AI code review agent alongside SDLC analytics, AI impact measurement, and DevEx surveys. Every other alternative requires a separate code review tool. Typo also supports engineering productivity and team efficiency by surfacing actionable metrics and workflow bottlenecks.

If your primary need is developer experience measurement: DX offers the deepest research-backed methodology. Typo offers DevEx surveys combined with delivery analytics and AI impact in one platform. The tradeoff is depth of DevEx research (DX) versus breadth of the platform (Typo).

If budget is your primary constraint: LinearB’s free tier or Swarmia’s transparent pricing provide accessible starting points. Typo also offers flexible plans and a self-serve free trial with no sales call required.

If you need enterprise finance alignment: Jellyfish may still be the right choice. Its investment allocation, R&D capitalization, and DevFinOps features are designed for CFO-level conversations. Jellyfish stands out for tracking engineering investments and aligning them with business outcomes. No alternative on this list matches Jellyfish’s depth in financial engineering reporting.

The AI Measurement Gap: Why It Matters in 2026

The 2025 DORA Report found that 90% of developers now use AI coding tools. But the report also found that AI amplifies existing practices rather than fixing broken ones. Teams with poor DORA baselines do not improve with AI. They accelerate their dysfunction.

This creates a measurement problem. Most organizations track AI tool adoption through license counts. They know how many seats are active. They do not know whether those tools are actually improving delivery speed, code quality, or developer experience. Tracking engineering effort and resource allocation is essential for understanding the true impact of AI tools, as it reveals how team resources are distributed and whether productivity gains are realized.

That gap is why AI coding impact measurement has become the defining capability in the engineering intelligence category. It is not enough to know that 80% of your team uses Copilot. You need to know whether AI-assisted PRs merge faster, introduce more rework, or create code quality issues that show up downstream—while also optimizing the development process and engineering processes for improved developer productivity and addressing technical debt.

Platforms that can answer that question, with verified data from your actual engineering workflow, are the ones worth evaluating.

Choosing What Fits

Jellyfish built a strong foundation in the engineering management space. For enterprise teams that need deep investment allocation, R&D capitalization, and finance alignment, it remains a capable option.

But the category has evolved. AI coding tools have changed what engineering leaders need to measure. Developer experience has become a board-level priority. The importance of software delivery, team collaboration, and operational efficiency has grown as organizations seek platforms that optimize the entire development lifecycle. And the bar for setup speed and pricing transparency has risen.

If you are looking for a platform that covers SDLC visibility, AI coding impact measurement, automated code reviews, and developer experience in a single product, with a setup that takes 60 seconds instead of 60 days, Typo is worth evaluating.

Related Reading

Frequently Asked Questions

What is Jellyfish used for?

Jellyfish is an engineering management platform that aligns engineering work with business objectives. It provides visibility into investment allocation, resource planning, R&D capitalization, and delivery metrics. It integrates with Jira, GitHub, GitLab, and other development tools.

How much does Jellyfish cost?

Jellyfish does not publish pricing publicly. Based on Vendr’s 2026 market data, annual contracts for 50–150 engineering seats typically range from $50,000 to $120,000, depending on modules, integrations, and contract terms.

What are the main limitations of Jellyfish?

Common friction points reported by users include: steep learning curve and complex initial setup, heavy dependency on Jira data quality, no automated AI code review capability, limited custom reporting flexibility, lack of customizable dashboards, limited tracking of quality metrics, and opaque pricing that requires a sales conversation.

Does Jellyfish measure AI coding tool impact?

Jellyfish added AI Impact tracking in late 2024, which measures AI tool adoption and usage across coding assistants like GitHub Copilot and Cursor. However, other engineering analytics tools provide more granular analysis of pull requests and quality metrics, enabling deeper AI-vs-non-AI PR comparison at the delivery impact level. Platforms like Typo provide more granular measurement.

What is the best Jellyfish alternative for mid-market teams?

For mid-market engineering teams (50–500 engineers) that need unified SDLC visibility, AI coding impact measurement, automated code review, and DevEx surveys in a single platform, Typo offers the most comprehensive coverage with the fastest setup (60 seconds) and self-serve pricing.

Introduction

AI impact on DORA metrics reveals a striking productivity paradox: individual developers merged 98% more pull requests while organizational software delivery performance remained essentially flat. The 2025 DORA Report—retitled “State of AI-assisted Software Development”—surveyed nearly 5,000 technology professionals and uncovered that AI tools amplify existing team capabilities rather than universally improving delivery metrics.

This article covers the 2025 DORA Report findings, the seven team archetypes that replaced traditional performance tiers, and practical measurement strategies for engineering leaders navigating AI adoption. The target audience includes VPs and Directors of Engineering responsible for measuring AI tool ROI, deployment frequency improvements, and overall engineering performance. Understanding why AI benefits vary so dramatically across teams has become essential for any organization investing in AI coding assistants.

Direct answer: AI acts as an amplifier that magnifies whatever work practices, cultural health, and platform maturity already exist in an organization. Strong teams see gains; teams with foundational challenges see their dysfunction worsen. This means engineering leaders must fix DORA metric baselines before expecting AI investment to deliver meaningful improvement.

By the end of this article, you will understand:

  • Why the productivity paradox exists and what telemetry data reveals about individual vs. organizational outcomes
  • How to identify your team’s archetype and tailor AI strategy accordingly
  • Which seven foundational practices determine successful AI adoption
  • How to implement AI-aware measurement that provides actionable insights beyond traditional DORA metrics
  • What immediate steps to take in the next 12 months before competitive disadvantages become permanent

Understanding AI’s Amplifier Effect on DORA Metrics

The 2025 DORA Report introduced a critical framing: AI acts as an “amplifier” or “multiplier” rather than a universal productivity booster. According to DevOps research conducted by Google Cloud, organizations with strong engineering systems, healthy data ecosystems, and mature internal platforms see positive gains from AI adoption. Organizations with weak foundations see those weaknesses magnified—higher change failure rate, more production failures, and increased rework.

AI adoption among software professionals surged to approximately 90% in 2025, up from roughly 75% the previous year. Most professionals now use AI tools daily, with median usage around two hours per day. Over 80% report improved individual productivity, and roughly 59% report improved code quality. Yet these perception-based gains don’t translate uniformly to organizational performance—the core insight that defines the AI era for engineering teams.

The 2025 DORA Metrics Evolution

The DORA framework historically tracked four core metrics—Change Lead Time, Deployment Frequency, Change Failure Rate, and Mean Time to Recovery—as the foundation for measuring software delivery performance. These four metrics were used to categorize teams into different performance levels and benchmark improvement areas. In 2024, the DORA framework evolved to include five metrics, adding Deployment Rework Rate and removing the elite/high/medium/low performance tiers that defined earlier reports.

Throughput metrics now include:

  • Lead time for changes (time from committed code to production)
  • Deployment frequency
  • Failed deployment recovery time (essentially moving recovery speed into throughput measurement)

Instability metrics include:

  • Change failure rate (percentage of deployments that fail, require rollback, or cause production incidents—failures or issues that occur after deployment)
  • Rework Rate—a new valid metric that counts unplanned deployments required due to production issues

The addition of Rework Rate acknowledges that failures aren’t always outright rollbacks. Many disruptions are remediated via additional fixes, and tracking this provides a more complete picture of delivery stability. New metrics added to the DORA framework include Deployment Rework Rate and measures of AI Code Share, Code Durability, and Complexity-Adjusted Throughput.

Deployment Rework Rate measures the frequency of unplanned deployments required due to production issues.
AI Code Share tracks the proportion of code generated by AI tools.
Code Durability assesses how long code survives without major rework.
Complexity-Adjusted Throughput accounts for the complexity of changes when measuring delivery speed.

This evolution directly addresses AI-era challenges where AI-generated code may increase deployment volume while simultaneously creating quality assurance burdens downstream. Lead Time for Changes can drop initially as AI accelerates code writing, but bottlenecks may shift to code review, increasing the review time significantly. Tracking code that survives without major rework over time is also important for understanding long-term stability.

Platform Engineering as the AI Success Foundation

Research shows that platform engineering stands out as the primary enabler of successful AI adoption. Approximately 90% of organizations have adopted at least one internal developer platform, and 76% have dedicated platform teams. High-quality internal platforms correlate strongly with AI amplification benefits—teams can move faster because CI/CD pipelines, monitoring, version control practices, and developer experience infrastructure absorb the increased code velocity AI enables, especially when they already understand the importance of DORA metrics for boosting tech team performance.

Without strong platforms, AI tools’ output creates chaos. More committed code flowing through immature pipelines leads to bottlenecks in code review, longer queues, and ultimately more deployments fail. The DORA AI capabilities model emphasizes that platform prerequisites must exist before AI adoption can translate individual developer productivity into organizational outcomes.

This connection between foundational capabilities and the productivity paradox explains why some high performing teams thrive with AI while others struggle.

The AI Productivity Paradox: Individual Gains vs Organizational Outcomes

The productivity paradox represents the most significant finding from 2025: individual developers produce dramatically more output, but engineering teams don’t see proportional improvements in delivery speed or business outcomes. Faros AI, analyzing telemetry from over 10,000 developers, quantified this gap with precision that survey data alone cannot provide, which underscores both the strengths and pros and cons of DORA metrics for continuous delivery.

Individual Developer Metrics Show Strong Gains

At the individual level, AI assisted coding delivers measurable improvements:

  • 98% more pull requests merged per developer
  • 21% more tasks completed per period with AI assistance
  • 67.4% more PR contexts being handled, indicating increased cognitive complexity management

Individual developers report that AI coding assistants help them code faster, produce better documentation, and move through routine tasks with less friction. These gains are real and substantial. The challenge is that individual productivity improvements don’t automatically flow through to organizational performance.

Organizational DORA Metrics Remain Flat

Despite the surge in individual output, Faros AI’s telemetry revealed that organizational delivery metrics—deployment frequency, lead time, and the ability to quickly restore service after incidents (recovery speed)—showed no noticeable improvement. The traditional DORA metrics remained essentially flat across their sample.

Worse, several quality and efficiency signals degraded:

  • Code review time increased approximately 91%—reviewers couldn’t keep pace with AI generated code volume
  • PR sizes grew roughly 154%—larger, more complex changes that take longer to review and more likely to cause issues
  • Bug rates increased approximately 9% when PRs became larger and reviews less efficient. The Change Failure Rate tends to rise significantly, by up to 7.2%, as AI-generated code is often larger and more prone to subtle bugs.
  • 13.8% increase in work restarts indicating systemic issues with code quality or requirements clarity
  • 26% more stalled tasks as review bottlenecks and integration challenges increased. Mean Time to Recover (MTTR) is generally the least affected metric as incident response relies on human judgment, and the ability to quickly restore service remains critical.

This data reveals where AI benefits evaporate: somewhere between individual contribution and organizational delivery, bottlenecks absorb the productivity gains. The complete picture shows AI helps individual developers produce more, but without corresponding improvements in review processes, pipeline efficiency, and quality assurance, that output creates downstream burden rather than business outcomes and often surfaces as classic signs of declining DORA metrics.

The Seven Critical AI Capabilities

The DORA AI capabilities model identifies seven foundational practices that determine whether AI adoption succeeds or fails at the organizational level:

  • Clear and communicated AI stance/governance: Organizations with explicit policy and guidelines about AI usage see better outcomes than those with grassroots experimentation
  • Healthy data ecosystems: Clean data, accessible logs, usable metrics and telemetry enable AI tools to work effectively
  • AI-accessible internal data: Codebases, documentation, and tools structured so AI can work with context
  • Strong version control practices: Atomic commits, branch discipline, small changes, and traceability
  • Small-batch, iterative workflows: The discipline to ship incrementally rather than accumulate large changes
  • User-centric focus: Keeping real problems and product goals central rather than optimizing for output metrics
  • Quality internal platforms: Developer experience infrastructure that enables rather than impedes flow

Teams that score well on these seven capabilities convert AI adoption into real performance benefits. Teams lacking these foundations experience the amplifier effect negatively—AI magnifies their dysfunction rather than solving it.

Seven Team Archetypes and AI Measurement Strategies

The 2025 DORA Report replaced the traditional linear performance tiers (Elite, High, Medium, Low) with seven team archetypes. This shift reflects a more nuanced understanding that team performance is multidimensional—throughput matters, but so does instability, team health, valuable work time, friction, and burnout, which aligns with newer DORA metrics guides for engineering leaders that emphasize a broader view of performance.

The Archetype Framework

The seven archetypes are built from multiple dimensions, which still rely on mastering core DORA metrics implementation:

  • Throughput metrics (lead time, deployment frequency, recovery time)
  • Instability metrics (change failure rate, rework rate)
  • Product performance (business impact, user satisfaction)
  • Individual effectiveness (developer perception)
  • Time spent on valuable work vs. rework
  • Friction in workflows
  • Burnout levels

Gene Kim and the DORA researchers developed this framework because teams with identical DORA metrics might have vastly different experiences and outcomes. A team deploying frequently with low failure rate but high burnout requires different interventions than one with the same metrics but healthy team dynamics.

AI Impact by Team Archetype

  • Harmonious High-Achievers (~20%)
    Current DORA Profile: High throughput, low instability, low burnout
    AI Impact Pattern: Amplified excellence, quality risks at scale
    Measurement Priority: Monitor rework rate and code complexity closely
  • Pragmatic Performers (~20%)
    Current DORA Profile: Strong throughput and stability, moderate engagement
    AI Impact Pattern: Productivity gains with engagement risk
    Measurement Priority: Track time spent on valuable work
  • Stable and Methodical (~15%)
    Current DORA Profile: Quality-focused, measured throughput
    AI Impact Pattern: Benefits from AI with discipline
    Measurement Priority: Maintain failure rate baselines
  • Constrained by Process (~17%)
    Current DORA Profile: Variable performance, process friction
    AI Impact Pattern: AI exacerbates friction
    Measurement Priority: Streamline review and approval workflows first
  • Legacy Bottleneck (~11%)
    Current DORA Profile: Slow deployment, reactive workloads
    AI Impact Pattern: Limited AI benefits until platform investment
    Measurement Priority: Fix foundations before AI rollout
  • High Impact, Low Cadence (~7%)
    Current DORA Profile: High value, infrequent delivery
    AI Impact Pattern: Mixed stability
    Measurement Priority: Balance throughput push with quality gates
  • Foundational Challenges (~10%)
    Current DORA Profile: Struggling across all metrics
    AI Impact Pattern: AI worsens dysfunction
    Measurement Priority: Fix basics before any AI adoption

Tailored AI Strategies by Archetype

Strategies for Foundational Challenges Teams

Prioritize establishing basic CI/CD pipelines, test coverage, build quality, and simple rollback mechanisms. AI adoption before these foundations exist will amplify chaos.

Strategies for Legacy Bottleneck Teams

Address technical debt, modularize monolithic systems, and create internal platforms to standardize processes. AI tools can help with code modernization, but platform investment must come first.

Strategies for Constrained by Process Teams

Identify process friction—reviews, decision bottlenecks, approval chains—and streamline or automate them. Adding AI-generated code to a team already drowning in review backlog makes things worse.

Strategies for High Performing Organizations

Guard against quality degradation by monitoring instability metrics closely. Success creates risk: as throughput increases, maintaining code quality and architecture discipline becomes harder.

Common AI Measurement Challenges and Solutions

Administrative Groupings vs Real Teams

Challenge: HR hierarchies define teams administratively, but actual collaboration patterns don’t match org charts. AI tool adoption may be high in one administrative group while the engineers actually working together span multiple groups.

Solution: Combine HR hierarchies with telemetry data to measure actual collaboration patterns. Track who reviews whose code, who co-authors changes, and where knowledge flows. This provides a more accurate picture of where AI adoption is actually impacting delivery.

Attribution Errors from Developer Movement

Challenge: Developers move between teams, change roles, and contribute to multiple repositories. Attributing AI impact to specific teams or projects becomes unreliable.

Solution: Track AI-influenced code contributions across team boundaries with proper tooling. Engineering intelligence platforms like Typo can measure AI-influenced PR outcomes with verified data rather than relying on license adoption estimates or self-reported usage, which is critical when implementing DORA DevOps metrics in large organizations.

Missing AI-Specific Metrics

Challenge: Traditional DORA metrics don’t distinguish between AI generated code and human-written code. You can’t assess whether AI is helping or hurting without this visibility.

Solution: Layer AI adoption rate, acceptance rates, and quality impact on traditional DORA metrics. Track:

  • Percentage of PRs with AI assistance
  • PR review time for AI-assisted vs. non-AI PRs
  • Bug density in AI-generated vs. manual code
  • Batch size and code complexity trends

Value Stream Visibility Gaps

Challenge: AI productivity gains evaporate somewhere in the delivery pipeline, but without end-to-end visibility, you can’t identify where.

Solution: Implement Value Stream Management to track flow from ideation through commit, review, QA, deploy, and post-release monitoring. This stream management approach reveals where time or defects accumulate—often in review queues or integration testing phases that become bottlenecks when AI dramatically increases deployment frequency upstream, and it depends on accurately measuring DORA metrics across the pipeline.

Conclusion and Next Steps

The 2025 DORA Report confirms that AI amplifies existing team patterns rather than uniformly improving software delivery performance. Teams with strong DORA baselines, mature platforms, and healthy engineering cultures see AI benefits compound. Teams with foundational challenges see AI worsen their dysfunction. The productivity paradox—individual gains that don’t translate to organizational outcomes—will persist until engineering leaders address the bottlenecks between developer output and business value delivery.

Immediate actions for engineering leaders:

  1. Assess your current team archetype using the seven-archetype framework. Understand whether your teams are positioned to benefit from AI or whether foundational fixes must come first.
  2. Establish AI measurement baselines that go beyond traditional DORA metrics. Track AI adoption rate, PR size trends, review time changes, and rework rate to understand AI’s actual impact.
  3. Implement platform prerequisites identified in the DORA AI capabilities model: governance clarity, healthy data ecosystems, version control discipline, and quality internal platforms.
  4. Deploy comprehensive measurement through engineering intelligence platforms that provide actionable insights into where AI productivity gains evaporate in your delivery pipeline.

The window for action is approximately 12 months. Organizations that successfully integrate AI with strong DORA foundations will achieve meaningful improvement in delivery speed and quality. Those that add AI to broken systems will see competitive disadvantages compound as their instability metrics worsen while competitors pull ahead.

Related topics worth exploring: Value Stream Management for end-to-end visibility, DevEx measurement for understanding developer friction, and AI ROI frameworks that connect tool investment to business outcomes.

Frequently Asked Questions

What did the 2025 DORA report say about AI?

The 2025 DORA Report found that approximately 90% of developers now use AI tools, with over 80% reporting productivity gains at the individual level. The central finding is that AI acts as an amplifier—magnifying organizational strengths and weaknesses rather than uniformly improving performance.

The report introduced seven critical capabilities that determine whether AI benefits scale to organizational performance: governance clarity, healthy data ecosystems, AI-accessible internal data, strong version control practices, small-batch workflows, user-centric focus, and quality internal platforms.

Notably, DORA researchers found no correlation between AI adoption and increased developer burnout, possibly because developers feel more productive even when downstream organizational stress increases.

Does AI improve DORA metrics or make them worse?

AI improves individual developer metrics but creates organizational delivery challenges. Teams with strong DORA baselines see amplified benefits; weak teams see amplified dysfunction.

Quality and stability signals often worsen despite throughput improvements. Faros AI telemetry showed bug rates increased approximately 9% and code review time increased 91% as AI-generated code volume overwhelmed review capacity.

Platform engineering maturity determines AI success more than tool adoption rates. Organizations with strong CI/CD pipelines, monitoring, and internal platforms convert AI productivity into delivery improvements. Organizations lacking these foundations see AI create more chaos.

How does AI affect deployment frequency and lead time?

Deployment frequency increases due to AI-generated code volume, but this may not reflect meaningful output. More deployments don’t automatically translate to faster value delivery if those deployments require rework or cause production incidents.

Lead time for changes reduces for individual contributions, but review bottlenecks increase as reviewers struggle to keep pace with higher code volume. The 91% increase in review time documented by Faros AI shows where individual lead time gains get absorbed.

Engineering leaders need to measure complexity-adjusted throughput rather than raw deployment counts. Failed deployment recovery time becomes a more critical metric than traditional MTTR because it captures the full cost of instability.

What are the seven team archetypes in DORA 2025?

The seven team archetypes are: Harmonious High-Achievers, Pragmatic Performers, Stable and Methodical, Constrained by Process, Legacy Bottleneck, High Impact Low Cadence, and Foundational Challenges.

Each archetype requires different AI adoption strategies and measurement approaches. Multidimensional classification considers throughput, stability, team well-being, friction, and time spent on valuable work—not just the four traditional DORA metrics.

One-size-fits-all AI strategies fail because a Legacy Bottleneck team needs platform investment before AI adoption, while Constrained by Process teams need to streamline workflows first. Harmonious High-Achievers can adopt AI aggressively but must monitor quality degradation.

How can engineering leaders measure AI impact on their teams?

Engineering leaders should combine traditional DORA metrics with AI adoption rates and code quality indicators. This means tracking not just deployment frequency and lead time, but also AI-influenced PR outcomes, PR size trends, review time changes, and rework rate.

Track AI-influenced PR outcomes with verified data rather than license adoption estimates. Engineering intelligence platforms like Typo provide visibility into actual AI usage patterns and their correlation with delivery and quality outcomes, complementing high-level resources that keep DORA metrics explained with practical insights.

Implement Value Stream Management to identify where AI gains evaporate in the delivery pipeline. Often, review queues, integration testing, or deployment approval processes become bottlenecks that absorb individual productivity improvements before they translate to business outcomes.

Use engineering intelligence platforms to correlate AI usage with delivery metrics, quality signals, and developer experience indicators. This comprehensive measurement approach provides actionable insights that surface problems before they compound.

Introduction

GitHub Copilot, Cursor, and Claude Code represent the three dominant paradigms in AI coding tools for 2026, each addressing fundamentally different engineering workflow needs. With 85% of developers now using AI tools regularly and engineering leaders actively comparing options in ChatGPT and Claude conversations, choosing the right ai coding assistant has become a strategic decision with measurable impact on delivery speed and code quality.

This guide covers performance benchmarks, pricing analysis, enterprise readiness, and measurable productivity impact specifically for engineering teams of 20-500 developers. It falls outside our scope to address hobbyist use cases or tools beyond these three leaders. The target audience is engineering managers, VPs of Engineering, and technical leads who need data-driven comparisons rather than developer preference debates.

The direct answer: GitHub Copilot excels at IDE integration and enterprise governance with 20M+ users and Fortune 100 adoption. Cursor leads in flow state maintenance and multi file editing for small-to-medium tasks. Claude Code dominates complex reasoning and architecture changes with its 1M token context window and 80.8% SWE-bench score.

By the end of this comparison, you will:

  • Understand each tool’s measurable impact on DORA metrics and PR cycle times
  • Choose the right ai tool for your team size, existing IDE preferences, and codebase complexity
  • Implement proper measurement frameworks to track actual productivity gains
  • Avoid common adoption pitfalls that undermine ROI
  • Build a hybrid approach leveraging different tools for different tasks

While these three tools boost individual productivity, measuring their actual impact on delivery speed and code quality requires dedicated engineering intelligence platforms that track AI-influenced outcomes across your entire codebase.

Understanding AI Coding Tool Categories

The 2026 landscape of ai coding tools has crystallized into three distinct approaches: IDE-integrated completion tools that augment familiar interfaces, AI-native editing environments that reimagine the development workflow entirely, and terminal-based autonomous agents that execute complex tasks independently. Understanding these categories is essential because each addresses different engineering bottlenecks.

IDE Integration vs Standalone Solutions

IDE-integrated tools like GitHub Copilot work within your existing development environment. GitHub Copilot is an extension that works across multiple IDEs, providing the only tool among the three that supports a wide range of editors without requiring a switch. Developers keep their familiar interface, existing extensions, and muscle memory while gaining inline suggestions and chat capabilities. This approach minimizes change management friction and enables gradual adoption across teams using VS Code, JetBrains, or Neovim.

Standalone solutions like Cursor require switching development environments entirely. Cursor is a standalone IDE built as a VS Code fork with AI integrated into every workflow, making it a complete editor redesigned around AI-assisted development. As a vs code fork, Cursor maintains familiarity but demands that teams switch editors and migrate configurations. This tradeoff delivers deeper AI integration at the cost of adoption friction. Enterprise teams often find IDE-integrated approaches easier to roll out, while power users willing to embrace change may prefer the cohesion of AI-native environments.

Autocomplete vs Autonomous Coding

Code completion tools focus on high-frequency, low-friction suggestions. You write code, and the ai generated code appears inline, accepted with a single keystroke. This approach optimizes for flow state and immediate productivity on the current file.

Autonomous Coding

Autonomous coding through agent mode takes a fundamentally different approach. You describe a task in natural language descriptions, and the terminal agent executes multi step tasks across multiple files, potentially generating entire features or refactoring existing codebases. Claude Code is a terminal-based AI coding agent that autonomously writes, refactors, debugs, and deploys code, providing a unique approach compared to IDE-integrated tools. Claude Code leads this category, achieving higher solve rates on complex problems but requiring developers to adapt to conversational coding workflows.

The choice between approaches depends on your primary bottleneck. If developers spend most time on incremental coding, autocomplete delivers immediate time saved. If architectural changes, debugging intermittent issues, or navigating very large codebases consume significant cycles, autonomous agents provide greater leverage.

Individual Tool Analysis and Core Strengths

Building on these foundational distinctions, each tool demonstrates specific capabilities and measurable impact that matter for engineering teams evaluating options.

GitHub Copilot: Enterprise Integration Leader

GitHub Copilot serves over 20 million developers and has become the Fortune 100 standard for ai assisted development. Its deep integration with the github ecosystem provides seamless workflow integration from code completion through pull request review.

Core strengths: Cross-IDE support spans visual studio, VS Code, JetBrains, Neovim, and CLI tools. Enterprise compliance features include SOC 2 certification, IP indemnification, and organizational policy controls. The Business tier ($19/user/month) provides admin controls and 300 premium requests monthly; Enterprise ($39/user/month) adds repository indexing, custom fine-tuned models (beta), and 1,000 premium requests.

Measurable impact: Best for enterprise teams needing consistent autocomplete across diverse development environments. Studies show inline suggestion acceptance rates of 35-40% without further editing. Agent mode and code review features enable multi file changes, though not as autonomously as Claude Code.

Key limitations: The context window presents the most significant constraint. While GPT-5.4 theoretically supports ~400,000 tokens, users report practical limits around 128-200K tokens with early summarization. For complex tasks spanning multiple files or requiring deep understanding of existing codebase, this limitation affects output quality.

Cursor: AI-Native Development Environment

Cursor positions itself as the ai coding tool for developers who want AI woven into every aspect of their workflow. Cursor is a standalone IDE built as a VS Code fork with AI integrated into every workflow, making it a complete editor redesigned around AI-assisted development. As a standalone ide based on a code fork of VS Code, it attracts over 1 million users seeking deeper integration than plugin-based approaches.

Core strengths: Composer mode enables multi file editing with context awareness across your entire project. Background cloud agents handle complex refactoring while you work on other tasks. Supermaven autocomplete achieves approximately 72% acceptance rates in benchmarks, significantly higher than alternatives for simple completions.

Measurable impact: Cursor completes SWE-bench tasks approximately 30% faster than Copilot for small-to-medium complexity work. First-pass correctness reaches ~73% overall, with ~42-45% of inline suggestions accepted without further editing. The tool excels at maintaining flow state, staying out of the way until needed.

Key limitations: Requires teams to switch editors, creating adoption friction. Token-based pricing through cursor pro can become unpredictable for heavy usage limits. On hard tasks, correctness drops to ~54% compared to Claude Code’s ~68%. The underlying model determines actual capabilities, making performance variable depending on configuration.

Claude Code: Complex Reasoning Specialist

Claude Code operates as a terminal agent optimized for autonomous coding on complex tasks. Claude Code is a terminal-based AI coding agent that autonomously writes, refactors, debugs, and deploys code, providing a unique approach compared to IDE-integrated tools. Its 200K standard context window (up to 1M in enterprise/beta tiers) enables reasoning across entire codebases that would overwhelm other tools.

Core strengths: The largest context window available enables architectural changes, legacy system navigation, and debugging intermittent issues that require understanding thousands of files simultaneously. Agent teams enable parallel workflows. The 80.8% SWE-bench Verified score demonstrates superior performance on complex problems. VS Code and JetBrains extensions add claude code to existing workflows for those who prefer IDE integration.

Measurable impact: Claude code leads on first-pass correctness at ~78% overall, reaching ~68% on hard tasks versus Cursor’s ~54%. Pull request acceptance rates show 92.3% for documentation tasks and 72.6% for new features. Complex refactoring executes approximately 18% faster than Cursor.

Key limitations: Terminal-only primary interface requires learning curve for developers accustomed to IDE-centric workflows. Usage based pricing for extended context can become expensive for teams regularly using 1M-token sessions. Performance degrades around 147-150K tokens before auto-compaction triggers, requiring prompt engineering to manage context effectively.

Performance Benchmarks and Feature Comparison

Coding Benchmark Performance

Interpreting benchmark data requires understanding that synthetic benchmarks don’t directly translate to productivity gains in your specific codebase and workflow patterns.

SWE-bench Verified measures complex correctness on real-world code tasks. Claude Code (Opus 4.5) achieves ~80.9%, Cursor ~48%, and Copilot ~55% in comparable benchmark sets. These differences become more pronounced on hard tasks requiring multi step problems across multiple files.

HumanEval and MBPP test function-level code generation. Claude Opus 4.6 reaches ~65.4% on Terminal-Bench 2.0; Cursor’s newer Composer variants achieve ~61-62%. These benchmarks better predict inline suggestion quality than autonomous task completion.

Real-world accuracy patterns:

  • Inline suggestion acceptance (no further edits): Cursor ~42-45%, Copilot ~35-40%
  • First-pass correctness: Claude Code ~78%, Cursor ~73%
  • Hard task correctness: Claude Code ~68%, Cursor ~54%

Interpretation guidance: Benchmark scores indicate ceiling performance under controlled conditions. Actual productivity impact depends on task distribution, codebase characteristics, and how well the tool matches your workflow patterns.

Feature Comparison Matrix

Feature GitHub Copilot Cursor Claude Code
IDE Support 10+ IDEs including Visual Studio VS Code fork only Terminal + VS Code/JetBrains extensions
Context Window ~128–400K (model dependent) Model dependent 200K standard, 1M enterprise
Multi-file Editing Agent mode, limited Composer mode, strong Agent teams, excellent
Autonomous Capabilities Moderate Moderate Very strong
Enterprise Compliance SOC 2, IP indemnity, policy controls Limited public documentation Enterprise plans available
Privacy Mode Yes, in Enterprise Yes Yes

Synthesis:

  • GitHub Copilot fits teams prioritizing minimal workflow disruption and enterprise governance.
  • Cursor suits developers willing to switch editors for superior flow state.
  • Claude code vs cursor decisions often come down to task complexity: Cursor leads for rapid iteration, claude code leads for architectural reasoning.

Pricing and Total Cost of Ownership

Direct licensing costs:

Tool Individual Team/Business Enterprise
GitHub Copilot $10/month $19/user/month $39/user/month
Cursor Pro $20/month ~$20/user/month + usage Enterprise custom
Claude Pro $20/month Usage-based (~$5/M input, $25/M output tokens) Custom

Team cost scenarios:

  • 5-person startup: Copilot ~$50/month, Cursor ~$100/month, Claude variable
  • 20-person scale-up: Copilot Business ~$380/month, Cursor ~$400/month base
  • 100+ enterprise: Copilot Enterprise ~$3,900/month, alternatives highly variable

Hidden costs matter:

  • Training time for new workflows
  • IDE migration effort (Cursor)
  • Prompt engineering learning curve (Claude Code)
  • Measurement infrastructure needs

Teams using cli tools extensively may find Claude Code’s terminal agent more accessible option despite the learning curve.

Implementation Challenges and Measurement Solutions

Adoption and Change Management

Developer resistance challenge: Teams using VS Code or JetBrains resist switching to Cursor’s standalone ide, even though it’s a vs code fork with a familiar interface. Exporting configurations, adjusting plugin sets, and changing muscle memory creates friction that individual developers often avoid.

Solution:

  • Implement gradual rollout strategies.
  • Run side-by-side comparisons with volunteers from each team.
  • Allow team choice flexibility—some developers thrive with Cursor’s composer mode while others prefer Copilot’s minimal disruption.
  • Track actual usage patterns rather than mandating single-tool adoption.

Security and Compliance Concerns

Code privacy challenge: All three tools process code through external ai models, raising IP protection concerns. Different tools offer different guarantees about data retention and model training.

Solution:

  • Select enterprise tiers with explicit privacy mode commitments.
  • GitHub Copilot Enterprise includes IP indemnification.
  • Claude Enterprise offers compliance certifications.
  • Establish clear data policies and run security review processes before deployment.
  • For sensitive codebases, evaluate whether any free tier or individual plan meets your governance requirements.

Measuring Actual Productivity Impact

The brutal truth: These tools report adoption metrics—suggestions accepted, completions generated, features used—but none tell you their actual impact on your DORA metrics. License adoption doesn’t equal delivery speed improvement.

Solution:

  • Implement engineering intelligence platforms that track AI-influenced PR outcomes, cycle time changes, and deployment frequency impact.
  • Establish baseline DORA metrics before tool adoption and measure changes over 30-90 day periods.
  • Typo measures AI tool impact across GitHub Copilot, Cursor, and Claude Code integrations, connecting tool usage to actual engineering outcomes rather than vanity metrics.

Specific measurement approaches (pros and cons of relying on DORA alone):

  1. Track PR cycle time for AI-influenced commits versus non-AI commits
  2. Measure code quality through review iteration counts and change failure rates
  3. Compare deployment frequency before and after adoption
  4. Analyze time saved claims against actual engineering productivity benchmarks

Conclusion and Implementation Roadmap

Tool choice depends on team size, existing IDE preferences, and the complexity distribution of your codebase work. GitHub copilot vs cursor vs claude code isn’t a simple “best tool” question—it’s a workflow fit question requiring measurement to answer definitively.

Immediate next steps

  • Start with free tier options where available to evaluate fit without commitment
  • Run 30-day pilots with small teams representing your typical workload
  • Measure baseline DORA metrics before pilot begins
  • Track actual productivity impact, not just adoption rates

Sequential implementation for enterprise teams

  • Begin with GitHub Copilot for broad adoption—minimal friction, enterprise governance
  • Add Cursor for teams doing complex multi file editing who can absorb IDE migration
  • Integrate Claude Code for architectural tasks, legacy navigation, and analyze entire codebases scenarios

The game changer isn’t choosing the right answer among these other tools—it’s implementing measurement infrastructure to track actual engineering impact rather than license deployment counts. Without that measurement, you’re guessing at ROI rather than proving it.

Related topics worth exploring: AI-assisted coding impact and best practices, engineering intelligence platforms for DORA metrics tracking, AI code review automation, and hybrid tool strategies for different tasks across your organization.

Frequently Asked Questions

Which AI coding tool has the best ROI for engineering teams?

ROI depends on three factors: team size, codebase complexity, and measurement infrastructure. For enterprise teams prioritizing governance and minimal disruption, GitHub Copilot typically delivers fastest time-to-value. For teams doing heavy refactoring, Cursor’s multi-file capabilities justify the IDE migration cost. For complex architectures or legacy systems, Claude Code’s context window provides unique capabilities. Without measuring actual DORA metric impact, ROI claims remain speculative.

Can you use multiple AI coding tools together effectively?

Yes, hybrid approaches are increasingly common. Many teams use GitHub Copilot for daily inline suggestions, Cursor for complex refactoring sessions, and add claude code for architectural analysis or debugging multi step problems. The key is matching each tool to specific task types rather than forcing single-tool standardization, drawing on broader AI coding assistant evaluations and developer productivity tooling strategies.

How do you measure if AI coding tools are actually improving delivery speed?

Focus on DORA metrics: deployment frequency, lead time for changes, change failure rate, and mean time to recovery. Track these metrics before AI tool adoption, then measure changes over 30-90 day periods. Compare PR cycle times for AI-influenced commits versus non-AI commits. Engineering intelligence platforms like Typo provide this measurement across all three tools, and resources such as a downloadable DORA metrics guide can help structure your approach.

Which tool is best for teams using legacy codebases?

Claude Code’s 1M token context window makes it uniquely capable of reasoning across very large codebases without losing context. It can analyze entire codebases that would exceed other tools’ limits. For legacy systems requiring understanding of interconnected components across hundreds of files, this context advantage is significant.

What’s the difference between AI code completion and autonomous coding?

Code completion provides inline suggestions as you write code—high frequency, immediate, minimal disruption. Autonomous coding executes entire tasks from plain language descriptions, making multi file changes, generating api endpoints, or refactoring components. Completion optimizes flow state for solo developer work; autonomous agents leverage AI for complex tasks that would otherwise require hours of manual effort.

How do enterprise security requirements affect tool choice?

GitHub Copilot Enterprise offers the most comprehensive compliance features: SOC 2 certification, IP indemnification, organizational policy controls, and explicit guarantees about code not being used for model training. Cursor’s enterprise features are less publicly documented. Claude Enterprise offers compliance plans but terminal-based workflows may require additional security review. Response cancel respond policies and data retention terms vary by tier—evaluate enterprise agreements carefully.

No items found.

Introduction

Engineering leaders exploring Swarmia alternatives are typically seeking software engineering intelligence platforms that offer broader version control support, automated code review capabilities, or deeper AI impact measurement than Swarmia currently provides. This guide compares the top alternatives available in 2026, helping engineering managers make data-driven decisions about their metrics and visibility tooling.

This article covers seven leading Swarmia alternatives, evaluation criteria based on common feature gaps, and practical migration considerations. It’s designed for VPs of Engineering, Engineering Managers, and CTOs at mid-market companies (20-500 engineers) evaluating engineering intelligence platforms. We focus specifically on tools addressing Swarmia’s documented limitations—teams satisfied with GitHub-only deployments and current feature sets may find this less relevant.

Quick answer: The best Swarmia alternatives for most engineering teams include Typo for all-in-one SDLC visibility with AI code reviews, LinearB for enterprise workflow automation, and DX for research-backed developer experience measurement. Each addresses specific Swarmia limitations while providing valuable insights across the development process.

Top alternatives to Swarmia for engineering metrics and workflow optimization include Jellyfish, LinearB, Waydev, and Haystack, which offer similar DORA metrics and cycle time analytics. These platforms are particularly strong for teams seeking robust analytics, workflow automation, and actionable insights to optimize engineering performance.

By the end of this guide, you’ll be able to:

  • Understand Swarmia’s core limitations driving alternative searches
  • Compare key features across seven comprehensive platforms
  • Identify the best fit based on your team size, tech stack, and priorities
  • Navigate migration challenges with practical guidance
  • Make a confident, data-driven platform decision

Understanding Swarmia and Why Teams Seek Alternatives

Swarmia is a software engineering intelligence platform founded in Finland in 2019, known for its clean user experience, SPACE metrics implementation, working agreements, and team-first philosophy. The platform excels at providing customizable dashboards for engineering metrics, behavioral nudges that promote desired team behavior, and transparent visibility into cycle time and pull requests performance.

Development teams appreciate Swarmia’s approach to quantitative metrics without surveillance culture—focusing on team health rather than individual developer productivity tracking. The platform’s working agreements feature helps engineering teams establish and maintain development process standards collaboratively.

Primary Limitations Driving Alternative Search

Despite these strengths, several documented gaps consistently drive engineering managers to explore alternatives:

GitHub-only integration remains Swarmia’s most significant limitation. According to Swarmia’s own documentation, Bitbucket and Azure DevOps are not supported, with GitLab support only launched in beta as of April 2026. This excludes approximately 40% of engineering teams using GitLab, Bitbucket, or Azure DevOps as their primary version control systems.

No automated code review capabilities forces teams to maintain multiple tools for PR quality checks, security scanning, and code health analysis. While Swarmia tracks AI assistant usage through its AI assistants view, it doesn’t provide the automated, LLM-powered code review functionality that newer platforms offer.

Limited AI impact measurement presents challenges for organizations investing heavily in GitHub Copilot, Cursor, or Claude Code. Swarmia can show which team members are using AI tools, but according to Typo’s AI coding documentation, it cannot distinguish AI-generated code at the commit level or measure AI suggestion acceptance rates with the granularity engineering leaders increasingly require.

Pricing opacity creates friction for mid-market companies. While Swarmia offers self-serve options for teams under 10 developers, larger organizations typically need sales conversations. Comparative analysis suggests Swarmia’s elite plans run approximately $42/developer/month—significantly higher than some alternatives.

Market Context and Timing

Several market factors make 2026 an optimal time to evaluate alternatives. Swarmia’s €10M funding round in June 2025 increased the platform’s visibility and competitive pressure. Meanwhile, the 2025 DORA report found that over 90% of developers now use AI coding tools, yet few teams effectively measure business impact—creating demand for platforms with sophisticated AI attribution capabilities.

Understanding what features matter most will help you evaluate alternatives systematically rather than comparing surface-level functionality, especially when considering AI-driven engineering intelligence platforms that standardize metrics and optimize AI adoption at scale.

Key Features to Evaluate in Swarmia Alternatives

When evaluating Swarmia alternatives, engineering leaders should prioritize features that address documented gaps while maintaining the actionable insights and team health visibility that made Swarmia attractive initially.

Key features to evaluate include:

  • Multi-Platform Version Control Support:
    Comprehensive platforms should integrate with GitHub, GitLab, Bitbucket, and Azure DevOps without requiring workflow changes or separate data pipelines. Look for real-time data collection across all repositories, regardless of hosting platform.
  • AI Code Impact Measurement:
    Beyond tracking which team members have activated Copilot licenses, evaluate whether platforms can measure actual AI influence on engineering productivity. Key capabilities include tracking adoption rates across AI coding tools, measuring AI impact on PR cycle time, deployment frequency, and code churn, quantifying AI coding tool ROI, and distinguishing AI-assisted code at the commit or PR level.
  • Automated Code Review and PR Analytics:
    Modern software engineering intelligence platforms increasingly include automated code review functionality, reducing the need to maintain separate tools. Evaluate capabilities such as context-aware, LLM-powered code reviews, PR health scores, security vulnerability detection, and auto-suggested fixes.
  • Developer Experience (DevEx) Frameworks:
    Beyond quantitative metrics, evaluate how alternatives measure qualitative data about developer experience and well-being. Look for implementation of frameworks like SPACE or DX Core 4, developer experience surveys, sentiment analysis, and developer friction identification.

With these evaluation criteria established, let’s examine how specific alternatives compare.

Top 7 Swarmia Alternatives Compared

Top alternatives to Swarmia for engineering metrics and workflow optimization include Jellyfish, LinearB, Waydev, and Haystack, which offer similar DORA metrics and cycle time analytics. These platforms are particularly strong for teams seeking robust analytics, workflow automation, and actionable insights to optimize engineering performance.

Typo AI

Typo provides a comprehensive platform combining SDLC visibility, automated AI code reviews, verified AI impact measurement, and research-backed developer experience surveys in a single solution. This eliminates the tool sprawl that engineering teams often encounter when addressing multiple Swarmia gaps separately.

Key differentiators:

  • Full VCS coverage: Supports GitHub, GitLab, and Bitbucket with 60-second setup
  • Automated code reviews: LLM-powered reviews on every PR with auto-fix suggestions
  • Verified AI impact: Commit-level attribution showing actual AI coding tool influence on DORA metrics
  • DevEx measurement: Research-backed surveys with actionable metrics and improvement recommendations

Typo serves over 1,000 engineering teams and earned Product Hunt recognition with 2,000+ upvotes. Customer results indicate approximately 30% PR cycle time reduction after implementation.

Best fit: Mid-market engineering teams (20-200 engineers) wanting comprehensive coverage without managing multiple tools. Particularly valuable for teams investing in AI coding tools who need verified business impact data.

LinearB

LinearB excels at workflow automation and delivery pipeline optimization for large organizations. The platform offers strong DORA metrics implementation with executive-level reporting and sophisticated automation capabilities.

Key differentiators:

  • Workflow automation: Auto-assigning reviewers, labeling PRs, and managing bottlenecks
  • Multi-VCS support: GitHub, GitLab, and Bitbucket integration
  • AI metrics dashboard: Recently launched AI code review metrics showing acceptance rates, detected issues, and lines changed via AI
  • Business alignment: Executive dashboards connecting engineering work to business outcomes

The platform serves enterprise needs effectively but requires more complex setup—often necessitating dedicated DevOps resources.

Best fit: Enterprise teams (100+ engineers) with sophisticated automation requirements and resources for implementation complexity.

DX

DX (GetDX) positions itself as the research-backed developer experience platform, implementing the DX Core 4 framework covering Flow, Cognitive Load, Collaboration, and Satisfaction.

Key differentiators:

  • Academic foundation: Frameworks developed by developer productivity researchers
  • Comprehensive DevEx: Combines survey data with system metrics for holistic view
  • Industry benchmarks: Comparison against role and industry peers
  • Workflow analysis: Quantifies hours lost to developer friction and identifies improvement opportunities

DX offers modular pricing with one-year contracts, including proof-of-concept options for evaluation. The platform provides valuable insights into developer experience but offers less SDLC visibility compared to comprehensive platforms, so many organizations also evaluate top developer experience tools to round out their DevEx stack.

Best fit: Organizations prioritizing developer experience as a strategic initiative—particularly those facing retention challenges or scaling rapidly.

Jellyfish

Jellyfish serves large enterprises requiring detailed correlation between engineering work and business value. The platform emphasizes resource allocation, cost capitalization, and ROI measurement for engineering investments.

Key differentiators:

  • Financial reporting: Cost capitalization and engineering investment tracking
  • Business alignment: Connects engineering output to business goals and revenue
  • Resource planning: Detailed allocation tracking across teams and projects
  • C-suite visibility: Board-ready reporting and executive dashboards

However, Jellyfish has documented limitations. According to Swarmia’s comparison, data refresh occurs only every 24 hours—limiting real-time actionability. Implementation complexity and cost mean ROI often takes months to materialize.

Best fit: Large enterprises (200+ engineers) needing detailed business value correlation and board-level reporting capabilities.

Haystack

Haystack offers a lightweight platform focused on core DORA metrics with transparent, affordable pricing at approximately $20/user/month.

Key differentiators:

  • Focused functionality: Lead time, deployment frequency, change failure rate, mean time to recovery
  • Simple setup: Quick implementation without extensive configuration
  • Affordable entry: Transparent pricing accessible to smaller teams
  • Basic PR analytics: Fundamental pull requests insights and cycle time tracking

The tradeoff is limited customization and fewer advanced features compared to comprehensive platforms, so some teams also compare top Swarmia alternatives to find a better balance between simplicity and breadth.

Best fit: Small teams (under 50 engineers) seeking fundamental DORA metrics implementation without enterprise-grade complexity.

Waydev

Waydev provides highly customizable dashboards and metrics definitions for teams with specific requirements that standard platforms don’t address.

Key differentiators:

  • Custom metrics: Define and track your own metrics beyond standard frameworks
  • Flexible dashboards: Extensive visualization and reporting customization
  • Strong integrations: Detailed analytics across development lifecycle
  • Role-based access control: Granular permission management for different stakeholders

The platform’s flexibility can create a steep learning curve for teams preferring opinionated, curated experiences.

Best fit: Teams requiring extensive customization and control over metrics presentation—particularly those with unique workflows or reporting requirements.

Comparison Decision Framework

Feature Typo LinearB DX Jellyfish Haystack Waydev
VCS Support GitHub, GitLab, Bitbucket GitHub, GitLab, Bitbucket Multi-platform Multi-platform (slower refresh) Core platforms Core platforms
AI Code Review ✅ Automated LLM reviews ✅ Metrics dashboard ❌ Limited ❌ Limited ❌ No ❌ No
AI Impact Measurement ✅ Commit-level attribution ✅ Dashboard-level ✅ Commit-level attribution ⚠️ Metadata only ❌ No ❌ Limited
DevEx Surveys ✅ Research-backed ⚠️ Limited ✅ Core strength ⚠️ Basic ❌ No ⚠️ Basic
Pricing Transparency ✅ Self-serve ❌ Sales required ⚠️ Annual contracts ❌ Enterprise ✅ Transparent ⚠️ Varies
Setup Complexity Low (60 seconds) High Medium High Low Medium

Quick decision guide:

  • For VCS flexibility beyond GitHub: Typo, LinearB
  • For AI impact measurement: Typo, LinearB
  • For developer experience focus: DX, Typo
  • For enterprise reporting: Jellyfish, LinearB
  • For budget-conscious teams: Haystack, Typo free tier

Common Challenges When Switching from Swarmia

Data Migration and Historical Metrics

Most alternatives can backfill 6-12 months of historical data from Git repositories and issue trackers, preserving continuity for cycle time trends and deployment frequency analysis. However, metric definition differences between platforms may cause apparent discrepancies.

Plan for 2-4 weeks of parallel running to validate data accuracy before full transition. Export existing working agreements and team goals from Swarmia to reestablish them in your new platform—these cultural artifacts matter as much as quantitative data.

Team Adoption and Change Management

Emphasize continuity of metrics philosophy while highlighting new capabilities your team has requested. Focus demos on solving current pain points—if your team has complained about lacking automated code reviews, lead with that capability and show how AI code reviews for distributed and remote teams can reduce delays and miscommunication, rather than overwhelming with every feature.

Start rollout with engineering managers who will champion the tool, then expand to full development teams. This data-driven approach builds internal advocates before organization-wide adoption.

Integration Complexity

Most platforms offer guided setup with dedicated customer success support during migration. Typo’s 60-second setup and LinearB’s automation reduce integration overhead significantly for teams concerned about DevOps burden, particularly when layering in AI-powered review assistance for remote workflows.

Test integrations in a staging environment with representative repositories before production deployment. Verify that project management tools, communication tools, and CI/CD pipelines all connect properly before decommissioning your previous platform.

Conclusion and Next Steps

While Swarmia offers clean UX and a team-first philosophy that many engineering teams appreciate, documented limitations in VCS support, automated code review, and AI impact measurement lead many organizations to explore alternatives. The platforms compared here each address specific gaps while providing the actionable insights and team health visibility that make engineering intelligence valuable.

Immediate next steps:

  • Audit your current tech stack for VCS platforms, issue trackers, and AI coding tools in use
  • Identify your top 2-3 priorities: AI impact measurement, automated code review, DevEx improvement, or business alignment
  • Schedule demos with shortlisted alternatives—most offer 30-minute overviews
  • Request trial access to validate integrations with your specific toolchain

For engineering teams wanting a comprehensive solution combining SDLC visibility, automated code reviews, and verified AI impact measurement, start with Typo’s free trial to experience the all-in-one approach without tool sprawl and see why many teams view it as the best Swarmia alternative.

Related topics to explore: AI coding tool ROI measurement strategies, automated code review implementation patterns, and developer experience survey best practices for continuous improvement programs.

Additional Resources

  • 2025 DORA Report — Latest research on AI impact and engineering performance benchmarks
  • SPACE Framework Research — Academic foundation for developer productivity measurement
  • Typo Free Trial — All-in-one SDLC visibility with AI code reviews
  • LinearB Platform — Enterprise workflow automation
  • DX Platform — Research-backed developer experience measurement
  • Industry benchmarks for engineering metrics by team size and sector from DORA and DX research

Engineering Analytics

View All
jellyfish-alternatives

Top 10 Jellyfish Alternatives to Enhance Your Project Management

Choosing the right engineering management platform is more critical than ever in 2026. This guide reviews the best alternatives to Jellyfish for engineering leaders, managers, and decision-makers who are seeking to optimize team performance, align engineering with business goals, and adapt to the rapidly evolving landscape of AI, developer experience, and workflow automation. With the increasing importance of actionable insights, real-time data, and seamless integration, selecting the right platform can directly impact your organization’s ability to deliver value, improve productivity, and stay competitive.

Jellyfish built its reputation as the pioneer engineering management platform. Since launching in 2017, the company has raised $114.5 million in funding from Accel, Insight Partners, and Tiger Global. Its core strength is aligning engineering work with business objectives, giving CFOs and VPs of Engineering a shared language around investment allocation, resource planning, engineering effort, and resource allocation—key aspects tracked by such platforms for effective capacity planning and workload management.

That positioning served enterprise buyers well for years. But the engineering intelligence category has shifted. AI coding tools are now standard across most teams. The 2025 DORA Report introduced new measurement frameworks. Developer experience has become a board-level priority. Today, aligning engineering activities with business goals and supporting business teams with actionable insights is critical for organizations seeking to optimize outcomes.

Platforms must now provide seamless integration with existing tools to enable real-time data aggregation, supporting new measurement frameworks and the growing focus on developer experience.

The question is no longer “Where is my engineering time going?” It is “How do I measure the real impact of AI tools on delivery, code quality, and developer experience, all at once?” Making data-driven decisions is now essential for evaluating the impact of engineering investments and driving continuous improvement.

If you are evaluating Jellyfish alternatives, you are likely dealing with one or more of these friction points.

Why Engineering Teams Look Beyond Jellyfish

Jellyfish is a capable platform for enterprise engineering management. It does several things well: investment allocation, capacity planning, R&D cost reporting, and executive dashboards. For organizations with deep Jira workflows and clean data hygiene, it provides solid visibility into where engineering time goes. Jellyfish focuses on quantitative metrics and tracking key metrics, offering dashboards and reports that help monitor team performance, but it may lack qualitative and tailored insights that provide a more complete understanding of engineering productivity.

But several patterns consistently push teams toward alternatives.

Pricing requires a sales conversation. Jellyfish does not publish pricing publicly. According to Vendr’s 2026 analysis, buyers with 50–150 engineering seats on annual contracts often see pricing in the range of $50,000–$120,000 per year. For mid-market teams with 50–200 engineers, that is a significant commitment before you have even seen the platform in action.

Setup and onboarding take time. Multiple competitor analyses and user reviews on G2 note that Jellyfish has a steep learning curve. Users report that training is vital to use the product well, and initial configuration can take weeks. Several G2 reviewers cite complex setup and the need for dedicated staff to manage the platform.

Heavy Jira dependency. Jellyfish treats Jira as its primary system of record. For teams using Linear, GitHub Issues, or hybrid setups, this Jira-centricity can become a constraint. As Faros AI’s analysis points out, Jellyfish’s approach can undercount engineering activities not tied to Jira issues. When only quantitative data is considered, technical debt and workflow bottlenecks can be overlooked, impacting long-term engineering efficiency.

Limited AI coding impact measurement until recently. Jellyfish launched AI Impact tracking in late 2024 and has expanded it since. However, many teams evaluating alternatives report needing deeper AI measurement: not just adoption tracking (who is using Copilot or Cursor), but actual impact on cycle time, code quality, and PR outcomes across AI-assisted versus non-AI PRs.

No automated code review. Jellyfish does not include a code review agent. If you want AI-powered code review alongside your engineering analytics, you need a separate tool or a platform that bundles both.

Customization gaps. G2 reviews consistently flag limited customization as a friction point. Of the top complaint themes, 21 mentions specifically call out lack of custom reporting flexibility, and 19 mentions note limited features and integration depth. Teams increasingly need comprehensive code insights and tailored insights to better understand team performance and address unique workflow challenges.

Many software teams struggle with the limitations of purely quantitative data, realizing it doesn't tell them how to improve or what's happening outside of platforms like Git and Jira, which can hinder actionable progress and slow development speed.

What to Look for in a Jellyfish Alternative

Before comparing specific platforms, it helps to know what separates a useful engineering intelligence tool from one that creates more dashboard fatigue. Here is what matters in 2026. Seamless integration with existing tools and customizable dashboards is essential for capturing real time data, enabling actionable insights, and supporting better decision-making across engineering teams.

  • DORA metrics and SDLC visibility that go beyond Jira. The 2025 DORA Report added a fifth metric, deployment rework rate, and replaced the old elite/high/medium/low tiers with seven team archetypes. Your platform should reflect this, while also tracking team dynamics and operational efficiency to optimize collaboration and delivery.
  • AI coding tool impact measurement. Not just license adoption counts, but actual delivery impact: how do AI-assisted PRs compare to non-AI PRs on cycle time, merge rate, and code quality?
  • Automated code review. AI code review agents have seen adoption jump from 14.8% to 51.4% between January and October 2025. A platform that includes code review alongside analytics removes a tool from your stack.
  • Developer experience measurement. Gartner reports that 58% of engineering leaders now consider DevEx a critical metric. Survey-based DevEx signals correlated with delivery data give a fuller picture than output metrics alone, especially when measuring developer productivity and using data-driven insights for continuous improvement.
  • Fast setup. If a platform takes weeks to configure, you are paying for time you do not have. Look for tools that connect in minutes, not months.
  • Transparent pricing. If you cannot estimate cost before a sales call, budget planning becomes guesswork.

Effective AI-powered workflow optimization requires tools that provide clear, actionable insights to highlight bottlenecks in the development process and offer specific recommendations for data-driven improvements. Seamless integration with existing tools is crucial for automatic data capture and improved decision-making.

Why Teams Choose Jellyfish Alternatives

Alternatives to Jellyfish, such as DX, LinearB, Swarmia, Haystack, Waydev, and Pluralsight Flow, address the main limitations of Jellyfish by offering a more comprehensive approach to engineering management. These platforms combine both qualitative and quantitative insights, allowing teams to track performance and identify bottlenecks more effectively. Platforms like Swarmia and Pluralsight Flow provide engineering teams with tools that focus on team dynamics and workflow optimization, which can be more beneficial than Jellyfish's top-down reporting approach. Jellyfish is often criticized for its limited customization and lack of focus on developer experience, which has led many teams to seek alternatives that offer better insights into daily challenges faced by developers. Additionally, alternatives like Haystack and Waydev emphasize real-time insights and proactive identification of bottlenecks, enhancing team productivity compared to Jellyfish's more rigid reporting structure.

Jellyfish Alternatives at a Glance

When evaluating alternatives to Jellyfish, it's important to consider how some platforms position themselves as engineering effectiveness platforms—offering not just analytics, but comprehensive solutions for operational efficiency, code quality, and developer productivity. The table below compares seven alternatives across the capabilities that matter most for engineering leaders in 2026.

Platform DORA Metrics AI Code Impact AI Code Review DevEx Surveys Setup Speed Pricing
Typo Yes (5 metrics) Native Built-in Built-in Fast Self-serve, free trial
LinearB Yes Native Basic No Moderate Free tier + paid
Swarmia Yes Native No Limited Fast Transparent tiers
DX Yes Native No Core product Moderate Sales-led
Haystack Yes Limited No No Fast Transparent
Waydev Yes Limited Basic Limited Moderate Sales-led
Pluralsight Flow Yes No No No Moderate Bundled

Notably, alternatives to Jellyfish such as DX and Typo AI combine both qualitative and quantitative insights, enabling teams to track performance and identify bottlenecks more effectively than platforms focused solely on high-level metrics.

1. Typo AI: Best All-in-One for AI-Native Engineering Teams

Typo AI is an engineering effectiveness platform that combines SDLC visibility, AI coding tool impact measurement, automated AI code reviews, and developer experience surveys in a single product. It provides comprehensive code insights and tracks DORA and SPACE metrics to help teams optimize productivity, software health, and operational efficiency. Typo connects to GitHub, GitLab, Bitbucket, Jira, Linear, and CI/CD pipelines.

Where Typo differs from Jellyfish is scope and speed. Jellyfish focuses primarily on engineering-to-business alignment, investment allocation, and financial reporting. Typo starts from how work actually moves through the SDLC and layers in AI impact, code quality, and developer experience on top of that foundation, reflecting its broader mission to redefine engineering intelligence.

Key strengths:

  • AI Coding Impact: Typo AI tracks adoption of GitHub Copilot, Cursor, Claude Code, and CodeWhisperer. It measures AI code changes percentage, acceptance rates, and compares metrics between AI-assisted and non-AI PRs across teams, developers, languages, and tools. This goes beyond license-count tracking to answer the question: “Is AI actually improving our delivery?”
  • Automated AI Code Reviews: Context-aware, LLM-powered reviews on every pull request, including AI-powered PR summaries and review time estimates that streamline reviewer focus. Typo’s approach applies AI to remote code review workflows, with PR health scores, merge confidence signals, security checks, and auto-suggested fixes. Typo’s code review agent understands the team’s codebase and engineering patterns, delivering signal-first feedback rather than generic noise.
  • DevEx Intelligence: Research-backed developer experience measurement using anonymous AI-chatbot surveys that achieve higher response rates than traditional survey tools. Benchmarks against industry and team-size comparisons.
  • Performance and Quality Metrics: Typo combines performance and quality metrics to deliver actionable insights, supporting team efficiency and team collaboration through real-time data and analytics.
  • Setup in 60 seconds: Self-serve onboarding. No weeks of configuration. No sales call required to get started.

Customer proof points:

  • Groundworks achieved a 40% reduction in critical code quality issues.
  • JemHR saw 50% improvement in PR cycle time.
  • StackGen reduced PR review time by 30%.
  • Requestly reported a 30% increase in deployment frequency.
  • Prendio achieved 20% more deployments.
  • Typo’s real-time visibility into engineering workflows supports continuous improvement.

Typo is a G2 Leader with 150+ reviews, trusted by 1,000+ engineering teams, and featured in Gartner’s Market Guide for Software Engineering Intelligence Platforms.

Best for: Engineering teams at mid-market SaaS companies (50–500 engineers) who need unified visibility across delivery, AI impact, code quality, and developer experience, without the enterprise pricing or multi-week onboarding—and who are evaluating why companies choose Typo for this use case.

2. LinearB: Best for Workflow Automation and Process Metrics

LinearB focuses on engineering workflow automation, DORA metrics, and cycle time analytics. As an engineering analytics tool, it provides instant insights and workflow automation, delivering automated improvement actions like PR bots and alerts that help teams enforce working agreements around PR size, review turnaround, and merge frequency.

Where LinearB stands out: It is actionable at the team level. Instead of high-level allocation reporting, LinearB provides specific bottleneck identification, tracks key engineering metrics, and offers automated fixes. The free tier is generous for small teams, making it an accessible starting point.

Where it falls short versus Jellyfish alternatives: LinearB does not include native AI coding impact measurement. It does not offer automated code review. And it lacks DevEx survey capabilities. Teams who need to measure how AI tools affect delivery or who want code review bundled into their analytics platform will need to look elsewhere.

Best for: Engineering managers focused on process efficiency who want automated interventions in their development pipeline, particularly those starting with a free-tier budget. Alternatives like Haystack and Waydev emphasize real-time insights and proactive identification of bottlenecks, enhancing team productivity.

3. Swarmia: Best for Developer-First DORA Metrics

Swarmia combines DORA metrics with developer experience signals. It tracks cycle time, deployment frequency, and review throughput alongside “working agreements” that let teams set norms like PR size limits and review turnaround expectations. Swarmia helps development teams and software development teams track quality metrics and improve team's productivity by providing actionable insights and real-time analytics.

Where Swarmia stands out: Clean UX. Team-first approach. Positions itself explicitly as the “humane alternative to engineering surveillance,” which resonates with engineering leaders who care about developer experience as much as process metrics. The company raised €10 million in June 2025, signaling continued growth.

Where it falls short: No automated code review. Limited AI coding impact measurement. Limited customization for complex enterprise needs. G2 and Reddit discussions consistently cite feature depth as the primary gap compared to more comprehensive platforms.

Best for: Teams starting their metrics journey who want clean dashboards and team-first norms without enterprise complexity.

4. DX: Best for Research-Backed Developer Experience Measurement

DX (formerly GetDX) is an engineering intelligence platform founded by the researchers who created the DORA, SPACE, and DevEx frameworks. It combines structured developer surveys with system metrics through its Data Cloud product to measure developer experience, productivity friction, and organizational health, while also measuring developer productivity and individual performance metrics. DX incorporates developer feedback as a qualitative element, ensuring that both quantitative data and direct input from developers are used to identify issues and suggest improvements.

Where DX stands out: Deep research pedigree. The DX Core 4 framework is becoming a standard reference in the DevEx space. No other tool has the same academic backing for its measurement methodology. DX leverages the SPACE framework (Satisfaction, Performance, Activity, Communication, Efficiency) to provide a holistic view of developer experience and productivity.

Where it falls short: DX is primarily a survey and sentiment platform. It incorporates self reported metrics from developers, which complements system-generated data, but does not include automated code review, native AI coding impact measurement, or deep SDLC analytics. If you need to see how work moves through your pipeline, diagnose PR bottlenecks, or track AI tool impact on cycle time, DX will not cover those use cases alone.

Best for: Organizations investing heavily in developer experience improvement and platform engineering who want the most rigorous DevEx measurement methodology available.

5. Haystack: Best Lightweight Option for Smaller Teams

Haystack is a lightweight engineering analytics platform focused on DORA metrics, delivery visibility, and team health. It targets teams that want engineering metrics without the complexity of enterprise platforms, while providing real time data and real time visibility for distributed teams and software teams.

Where Haystack stands out: Quick setup, transparent pricing, and a focused feature set that does not overwhelm smaller teams. For engineering managers overseeing 5–50 developers who need basic delivery visibility, Haystack provides fast time-to-value.

Where it falls short: No AI coding impact measurement. No automated code review. No DevEx surveys. As teams scale past 50–100 engineers or need to measure AI tool ROI, Haystack’s feature set may not keep pace.

Best for: Small-to-mid engineering teams (under 50 developers) who want straightforward delivery metrics without enterprise complexity or pricing.

6. Waydev: Best for Git-Level Developer Analytics

Waydev is an engineering intelligence platform that uses DORA metrics, the SPACE framework, developer experience insights, and AI capabilities to provide delivery analytics. It automatically tracks work from Git activity, visualizes project timelines, and includes basic code review workflow features, while also offering detailed analytics on pull requests and the entire development lifecycle.

Where Waydev stands out: Automated work logs from Git activity eliminate manual entry. Project timeline visualization gives clear progress views. Sprint planning integration supports agile workflows. Waydev also supports the software delivery process by providing engineering insights that help teams optimize performance and identify bottlenecks.

Where it falls short: AI coding impact measurement is limited. Code review capabilities are basic compared to dedicated AI code review tools. DevEx survey depth does not match platforms like DX or Typo.

Best for: Teams that want Git-level activity analytics with automated work tracking and sprint planning support.

7. Pluralsight Flow: Best for Organizations Already Using Pluralsight

Pluralsight Flow (formerly GitPrime) tracks coding activity: commits, lines of code, code churn, and review patterns. It was acquired by Appfire from Pluralsight in February 2025 and now operates as a standalone product within the Appfire ecosystem alongside BigPicture PPM and 7pace Timetracker. Flow also enables tracking of individual performance and individual performance metrics, providing visibility into productivity metrics and key metrics for both teams and developers—similar to platforms like Code Climate Velocity.

Where Flow stands out: Mature Git activity analytics with ML-powered insights. The Appfire ecosystem positions it alongside project management tools. For organizations already invested in Pluralsight for developer training, Flow provides natural synergy.

Where it falls short: No AI coding impact measurement. No automated code review. No DevEx surveys. No manager productivity agents. The platform focuses on Git-level patterns rather than full SDLC visibility, and it does not cover sprint analytics, deployment metrics, or incident tracking.

Best for: Large organizations that want mature Git analytics and are already invested in the Appfire or Pluralsight ecosystem.

How to Choose the Right Jellyfish Alternative

The right platform depends on what gap Jellyfish is not filling for your team. Here is a framework for making the decision. For engineering organizations, leveraging data-driven approaches and data-driven insights is essential—these enable leaders to make informed decisions, optimize workflows, and align engineering efforts with strategic goals.

If your primary need is measuring AI coding tool impact: Typo is the strongest option for improving developer productivity with AI intelligence. It natively tracks GitHub Copilot, Cursor, Claude Code, and CodeWhisperer, and compares AI-assisted versus non-AI PR outcomes on cycle time, quality, and developer experience. Jellyfish added AI Impact tracking recently, but Typo’s approach measures verified impact, not just adoption.

If you need automated code review bundled with analytics: Typo is the only platform on this list that includes a context-aware AI code review agent alongside SDLC analytics, AI impact measurement, and DevEx surveys. Every other alternative requires a separate code review tool. Typo also supports engineering productivity and team efficiency by surfacing actionable metrics and workflow bottlenecks.

If your primary need is developer experience measurement: DX offers the deepest research-backed methodology. Typo offers DevEx surveys combined with delivery analytics and AI impact in one platform. The tradeoff is depth of DevEx research (DX) versus breadth of the platform (Typo).

If budget is your primary constraint: LinearB’s free tier or Swarmia’s transparent pricing provide accessible starting points. Typo also offers flexible plans and a self-serve free trial with no sales call required.

If you need enterprise finance alignment: Jellyfish may still be the right choice. Its investment allocation, R&D capitalization, and DevFinOps features are designed for CFO-level conversations. Jellyfish stands out for tracking engineering investments and aligning them with business outcomes. No alternative on this list matches Jellyfish’s depth in financial engineering reporting.

The AI Measurement Gap: Why It Matters in 2026

The 2025 DORA Report found that 90% of developers now use AI coding tools. But the report also found that AI amplifies existing practices rather than fixing broken ones. Teams with poor DORA baselines do not improve with AI. They accelerate their dysfunction.

This creates a measurement problem. Most organizations track AI tool adoption through license counts. They know how many seats are active. They do not know whether those tools are actually improving delivery speed, code quality, or developer experience. Tracking engineering effort and resource allocation is essential for understanding the true impact of AI tools, as it reveals how team resources are distributed and whether productivity gains are realized.

That gap is why AI coding impact measurement has become the defining capability in the engineering intelligence category. It is not enough to know that 80% of your team uses Copilot. You need to know whether AI-assisted PRs merge faster, introduce more rework, or create code quality issues that show up downstream—while also optimizing the development process and engineering processes for improved developer productivity and addressing technical debt.

Platforms that can answer that question, with verified data from your actual engineering workflow, are the ones worth evaluating.

Choosing What Fits

Jellyfish built a strong foundation in the engineering management space. For enterprise teams that need deep investment allocation, R&D capitalization, and finance alignment, it remains a capable option.

But the category has evolved. AI coding tools have changed what engineering leaders need to measure. Developer experience has become a board-level priority. The importance of software delivery, team collaboration, and operational efficiency has grown as organizations seek platforms that optimize the entire development lifecycle. And the bar for setup speed and pricing transparency has risen.

If you are looking for a platform that covers SDLC visibility, AI coding impact measurement, automated code reviews, and developer experience in a single product, with a setup that takes 60 seconds instead of 60 days, Typo is worth evaluating.

Related Reading

Frequently Asked Questions

What is Jellyfish used for?

Jellyfish is an engineering management platform that aligns engineering work with business objectives. It provides visibility into investment allocation, resource planning, R&D capitalization, and delivery metrics. It integrates with Jira, GitHub, GitLab, and other development tools.

How much does Jellyfish cost?

Jellyfish does not publish pricing publicly. Based on Vendr’s 2026 market data, annual contracts for 50–150 engineering seats typically range from $50,000 to $120,000, depending on modules, integrations, and contract terms.

What are the main limitations of Jellyfish?

Common friction points reported by users include: steep learning curve and complex initial setup, heavy dependency on Jira data quality, no automated AI code review capability, limited custom reporting flexibility, lack of customizable dashboards, limited tracking of quality metrics, and opaque pricing that requires a sales conversation.

Does Jellyfish measure AI coding tool impact?

Jellyfish added AI Impact tracking in late 2024, which measures AI tool adoption and usage across coding assistants like GitHub Copilot and Cursor. However, other engineering analytics tools provide more granular analysis of pull requests and quality metrics, enabling deeper AI-vs-non-AI PR comparison at the delivery impact level. Platforms like Typo provide more granular measurement.

What is the best Jellyfish alternative for mid-market teams?

For mid-market engineering teams (50–500 engineers) that need unified SDLC visibility, AI coding impact measurement, automated code review, and DevEx surveys in a single platform, Typo offers the most comprehensive coverage with the fastest setup (60 seconds) and self-serve pricing.

github-copilot-vs-cursor-vs-claude-code

GitHub Copilot vs Cursor vs Claude Code: The Ultimate AI Tool Showdown

Introduction

GitHub Copilot, Cursor, and Claude Code represent the three dominant paradigms in AI coding tools for 2026, each addressing fundamentally different engineering workflow needs. With 85% of developers now using AI tools regularly and engineering leaders actively comparing options in ChatGPT and Claude conversations, choosing the right ai coding assistant has become a strategic decision with measurable impact on delivery speed and code quality.

This guide covers performance benchmarks, pricing analysis, enterprise readiness, and measurable productivity impact specifically for engineering teams of 20-500 developers. It falls outside our scope to address hobbyist use cases or tools beyond these three leaders. The target audience is engineering managers, VPs of Engineering, and technical leads who need data-driven comparisons rather than developer preference debates.

The direct answer: GitHub Copilot excels at IDE integration and enterprise governance with 20M+ users and Fortune 100 adoption. Cursor leads in flow state maintenance and multi file editing for small-to-medium tasks. Claude Code dominates complex reasoning and architecture changes with its 1M token context window and 80.8% SWE-bench score.

By the end of this comparison, you will:

  • Understand each tool’s measurable impact on DORA metrics and PR cycle times
  • Choose the right ai tool for your team size, existing IDE preferences, and codebase complexity
  • Implement proper measurement frameworks to track actual productivity gains
  • Avoid common adoption pitfalls that undermine ROI
  • Build a hybrid approach leveraging different tools for different tasks

While these three tools boost individual productivity, measuring their actual impact on delivery speed and code quality requires dedicated engineering intelligence platforms that track AI-influenced outcomes across your entire codebase.

Understanding AI Coding Tool Categories

The 2026 landscape of ai coding tools has crystallized into three distinct approaches: IDE-integrated completion tools that augment familiar interfaces, AI-native editing environments that reimagine the development workflow entirely, and terminal-based autonomous agents that execute complex tasks independently. Understanding these categories is essential because each addresses different engineering bottlenecks.

IDE Integration vs Standalone Solutions

IDE-integrated tools like GitHub Copilot work within your existing development environment. GitHub Copilot is an extension that works across multiple IDEs, providing the only tool among the three that supports a wide range of editors without requiring a switch. Developers keep their familiar interface, existing extensions, and muscle memory while gaining inline suggestions and chat capabilities. This approach minimizes change management friction and enables gradual adoption across teams using VS Code, JetBrains, or Neovim.

Standalone solutions like Cursor require switching development environments entirely. Cursor is a standalone IDE built as a VS Code fork with AI integrated into every workflow, making it a complete editor redesigned around AI-assisted development. As a vs code fork, Cursor maintains familiarity but demands that teams switch editors and migrate configurations. This tradeoff delivers deeper AI integration at the cost of adoption friction. Enterprise teams often find IDE-integrated approaches easier to roll out, while power users willing to embrace change may prefer the cohesion of AI-native environments.

Autocomplete vs Autonomous Coding

Code completion tools focus on high-frequency, low-friction suggestions. You write code, and the ai generated code appears inline, accepted with a single keystroke. This approach optimizes for flow state and immediate productivity on the current file.

Autonomous Coding

Autonomous coding through agent mode takes a fundamentally different approach. You describe a task in natural language descriptions, and the terminal agent executes multi step tasks across multiple files, potentially generating entire features or refactoring existing codebases. Claude Code is a terminal-based AI coding agent that autonomously writes, refactors, debugs, and deploys code, providing a unique approach compared to IDE-integrated tools. Claude Code leads this category, achieving higher solve rates on complex problems but requiring developers to adapt to conversational coding workflows.

The choice between approaches depends on your primary bottleneck. If developers spend most time on incremental coding, autocomplete delivers immediate time saved. If architectural changes, debugging intermittent issues, or navigating very large codebases consume significant cycles, autonomous agents provide greater leverage.

Individual Tool Analysis and Core Strengths

Building on these foundational distinctions, each tool demonstrates specific capabilities and measurable impact that matter for engineering teams evaluating options.

GitHub Copilot: Enterprise Integration Leader

GitHub Copilot serves over 20 million developers and has become the Fortune 100 standard for ai assisted development. Its deep integration with the github ecosystem provides seamless workflow integration from code completion through pull request review.

Core strengths: Cross-IDE support spans visual studio, VS Code, JetBrains, Neovim, and CLI tools. Enterprise compliance features include SOC 2 certification, IP indemnification, and organizational policy controls. The Business tier ($19/user/month) provides admin controls and 300 premium requests monthly; Enterprise ($39/user/month) adds repository indexing, custom fine-tuned models (beta), and 1,000 premium requests.

Measurable impact: Best for enterprise teams needing consistent autocomplete across diverse development environments. Studies show inline suggestion acceptance rates of 35-40% without further editing. Agent mode and code review features enable multi file changes, though not as autonomously as Claude Code.

Key limitations: The context window presents the most significant constraint. While GPT-5.4 theoretically supports ~400,000 tokens, users report practical limits around 128-200K tokens with early summarization. For complex tasks spanning multiple files or requiring deep understanding of existing codebase, this limitation affects output quality.

Cursor: AI-Native Development Environment

Cursor positions itself as the ai coding tool for developers who want AI woven into every aspect of their workflow. Cursor is a standalone IDE built as a VS Code fork with AI integrated into every workflow, making it a complete editor redesigned around AI-assisted development. As a standalone ide based on a code fork of VS Code, it attracts over 1 million users seeking deeper integration than plugin-based approaches.

Core strengths: Composer mode enables multi file editing with context awareness across your entire project. Background cloud agents handle complex refactoring while you work on other tasks. Supermaven autocomplete achieves approximately 72% acceptance rates in benchmarks, significantly higher than alternatives for simple completions.

Measurable impact: Cursor completes SWE-bench tasks approximately 30% faster than Copilot for small-to-medium complexity work. First-pass correctness reaches ~73% overall, with ~42-45% of inline suggestions accepted without further editing. The tool excels at maintaining flow state, staying out of the way until needed.

Key limitations: Requires teams to switch editors, creating adoption friction. Token-based pricing through cursor pro can become unpredictable for heavy usage limits. On hard tasks, correctness drops to ~54% compared to Claude Code’s ~68%. The underlying model determines actual capabilities, making performance variable depending on configuration.

Claude Code: Complex Reasoning Specialist

Claude Code operates as a terminal agent optimized for autonomous coding on complex tasks. Claude Code is a terminal-based AI coding agent that autonomously writes, refactors, debugs, and deploys code, providing a unique approach compared to IDE-integrated tools. Its 200K standard context window (up to 1M in enterprise/beta tiers) enables reasoning across entire codebases that would overwhelm other tools.

Core strengths: The largest context window available enables architectural changes, legacy system navigation, and debugging intermittent issues that require understanding thousands of files simultaneously. Agent teams enable parallel workflows. The 80.8% SWE-bench Verified score demonstrates superior performance on complex problems. VS Code and JetBrains extensions add claude code to existing workflows for those who prefer IDE integration.

Measurable impact: Claude code leads on first-pass correctness at ~78% overall, reaching ~68% on hard tasks versus Cursor’s ~54%. Pull request acceptance rates show 92.3% for documentation tasks and 72.6% for new features. Complex refactoring executes approximately 18% faster than Cursor.

Key limitations: Terminal-only primary interface requires learning curve for developers accustomed to IDE-centric workflows. Usage based pricing for extended context can become expensive for teams regularly using 1M-token sessions. Performance degrades around 147-150K tokens before auto-compaction triggers, requiring prompt engineering to manage context effectively.

Performance Benchmarks and Feature Comparison

Coding Benchmark Performance

Interpreting benchmark data requires understanding that synthetic benchmarks don’t directly translate to productivity gains in your specific codebase and workflow patterns.

SWE-bench Verified measures complex correctness on real-world code tasks. Claude Code (Opus 4.5) achieves ~80.9%, Cursor ~48%, and Copilot ~55% in comparable benchmark sets. These differences become more pronounced on hard tasks requiring multi step problems across multiple files.

HumanEval and MBPP test function-level code generation. Claude Opus 4.6 reaches ~65.4% on Terminal-Bench 2.0; Cursor’s newer Composer variants achieve ~61-62%. These benchmarks better predict inline suggestion quality than autonomous task completion.

Real-world accuracy patterns:

  • Inline suggestion acceptance (no further edits): Cursor ~42-45%, Copilot ~35-40%
  • First-pass correctness: Claude Code ~78%, Cursor ~73%
  • Hard task correctness: Claude Code ~68%, Cursor ~54%

Interpretation guidance: Benchmark scores indicate ceiling performance under controlled conditions. Actual productivity impact depends on task distribution, codebase characteristics, and how well the tool matches your workflow patterns.

Feature Comparison Matrix

Feature GitHub Copilot Cursor Claude Code
IDE Support 10+ IDEs including Visual Studio VS Code fork only Terminal + VS Code/JetBrains extensions
Context Window ~128–400K (model dependent) Model dependent 200K standard, 1M enterprise
Multi-file Editing Agent mode, limited Composer mode, strong Agent teams, excellent
Autonomous Capabilities Moderate Moderate Very strong
Enterprise Compliance SOC 2, IP indemnity, policy controls Limited public documentation Enterprise plans available
Privacy Mode Yes, in Enterprise Yes Yes

Synthesis:

  • GitHub Copilot fits teams prioritizing minimal workflow disruption and enterprise governance.
  • Cursor suits developers willing to switch editors for superior flow state.
  • Claude code vs cursor decisions often come down to task complexity: Cursor leads for rapid iteration, claude code leads for architectural reasoning.

Pricing and Total Cost of Ownership

Direct licensing costs:

Tool Individual Team/Business Enterprise
GitHub Copilot $10/month $19/user/month $39/user/month
Cursor Pro $20/month ~$20/user/month + usage Enterprise custom
Claude Pro $20/month Usage-based (~$5/M input, $25/M output tokens) Custom

Team cost scenarios:

  • 5-person startup: Copilot ~$50/month, Cursor ~$100/month, Claude variable
  • 20-person scale-up: Copilot Business ~$380/month, Cursor ~$400/month base
  • 100+ enterprise: Copilot Enterprise ~$3,900/month, alternatives highly variable

Hidden costs matter:

  • Training time for new workflows
  • IDE migration effort (Cursor)
  • Prompt engineering learning curve (Claude Code)
  • Measurement infrastructure needs

Teams using cli tools extensively may find Claude Code’s terminal agent more accessible option despite the learning curve.

Implementation Challenges and Measurement Solutions

Adoption and Change Management

Developer resistance challenge: Teams using VS Code or JetBrains resist switching to Cursor’s standalone ide, even though it’s a vs code fork with a familiar interface. Exporting configurations, adjusting plugin sets, and changing muscle memory creates friction that individual developers often avoid.

Solution:

  • Implement gradual rollout strategies.
  • Run side-by-side comparisons with volunteers from each team.
  • Allow team choice flexibility—some developers thrive with Cursor’s composer mode while others prefer Copilot’s minimal disruption.
  • Track actual usage patterns rather than mandating single-tool adoption.

Security and Compliance Concerns

Code privacy challenge: All three tools process code through external ai models, raising IP protection concerns. Different tools offer different guarantees about data retention and model training.

Solution:

  • Select enterprise tiers with explicit privacy mode commitments.
  • GitHub Copilot Enterprise includes IP indemnification.
  • Claude Enterprise offers compliance certifications.
  • Establish clear data policies and run security review processes before deployment.
  • For sensitive codebases, evaluate whether any free tier or individual plan meets your governance requirements.

Measuring Actual Productivity Impact

The brutal truth: These tools report adoption metrics—suggestions accepted, completions generated, features used—but none tell you their actual impact on your DORA metrics. License adoption doesn’t equal delivery speed improvement.

Solution:

  • Implement engineering intelligence platforms that track AI-influenced PR outcomes, cycle time changes, and deployment frequency impact.
  • Establish baseline DORA metrics before tool adoption and measure changes over 30-90 day periods.
  • Typo measures AI tool impact across GitHub Copilot, Cursor, and Claude Code integrations, connecting tool usage to actual engineering outcomes rather than vanity metrics.

Specific measurement approaches (pros and cons of relying on DORA alone):

  1. Track PR cycle time for AI-influenced commits versus non-AI commits
  2. Measure code quality through review iteration counts and change failure rates
  3. Compare deployment frequency before and after adoption
  4. Analyze time saved claims against actual engineering productivity benchmarks

Conclusion and Implementation Roadmap

Tool choice depends on team size, existing IDE preferences, and the complexity distribution of your codebase work. GitHub copilot vs cursor vs claude code isn’t a simple “best tool” question—it’s a workflow fit question requiring measurement to answer definitively.

Immediate next steps

  • Start with free tier options where available to evaluate fit without commitment
  • Run 30-day pilots with small teams representing your typical workload
  • Measure baseline DORA metrics before pilot begins
  • Track actual productivity impact, not just adoption rates

Sequential implementation for enterprise teams

  • Begin with GitHub Copilot for broad adoption—minimal friction, enterprise governance
  • Add Cursor for teams doing complex multi file editing who can absorb IDE migration
  • Integrate Claude Code for architectural tasks, legacy navigation, and analyze entire codebases scenarios

The game changer isn’t choosing the right answer among these other tools—it’s implementing measurement infrastructure to track actual engineering impact rather than license deployment counts. Without that measurement, you’re guessing at ROI rather than proving it.

Related topics worth exploring: AI-assisted coding impact and best practices, engineering intelligence platforms for DORA metrics tracking, AI code review automation, and hybrid tool strategies for different tasks across your organization.

Frequently Asked Questions

Which AI coding tool has the best ROI for engineering teams?

ROI depends on three factors: team size, codebase complexity, and measurement infrastructure. For enterprise teams prioritizing governance and minimal disruption, GitHub Copilot typically delivers fastest time-to-value. For teams doing heavy refactoring, Cursor’s multi-file capabilities justify the IDE migration cost. For complex architectures or legacy systems, Claude Code’s context window provides unique capabilities. Without measuring actual DORA metric impact, ROI claims remain speculative.

Can you use multiple AI coding tools together effectively?

Yes, hybrid approaches are increasingly common. Many teams use GitHub Copilot for daily inline suggestions, Cursor for complex refactoring sessions, and add claude code for architectural analysis or debugging multi step problems. The key is matching each tool to specific task types rather than forcing single-tool standardization, drawing on broader AI coding assistant evaluations and developer productivity tooling strategies.

How do you measure if AI coding tools are actually improving delivery speed?

Focus on DORA metrics: deployment frequency, lead time for changes, change failure rate, and mean time to recovery. Track these metrics before AI tool adoption, then measure changes over 30-90 day periods. Compare PR cycle times for AI-influenced commits versus non-AI commits. Engineering intelligence platforms like Typo provide this measurement across all three tools, and resources such as a downloadable DORA metrics guide can help structure your approach.

Which tool is best for teams using legacy codebases?

Claude Code’s 1M token context window makes it uniquely capable of reasoning across very large codebases without losing context. It can analyze entire codebases that would exceed other tools’ limits. For legacy systems requiring understanding of interconnected components across hundreds of files, this context advantage is significant.

What’s the difference between AI code completion and autonomous coding?

Code completion provides inline suggestions as you write code—high frequency, immediate, minimal disruption. Autonomous coding executes entire tasks from plain language descriptions, making multi file changes, generating api endpoints, or refactoring components. Completion optimizes flow state for solo developer work; autonomous agents leverage AI for complex tasks that would otherwise require hours of manual effort.

How do enterprise security requirements affect tool choice?

GitHub Copilot Enterprise offers the most comprehensive compliance features: SOC 2 certification, IP indemnification, organizational policy controls, and explicit guarantees about code not being used for model training. Cursor’s enterprise features are less publicly documented. Claude Enterprise offers compliance plans but terminal-based workflows may require additional security review. Response cancel respond policies and data retention terms vary by tier—evaluate enterprise agreements carefully.

reduce pr cycle time

Effective Strategies to Reduce PR Cycle Time for Faster Development

Introduction

PR cycle time measures the duration from pull request creation to merge into the main branch—and it’s the most actionable metric engineering leaders can move quickly. Code review cycle time, specifically, is the period from when a pull request is submitted until it is merged, serving as a critical indicator of development velocity and team collaboration efficiency. Elite teams achieve total cycle times under 24 hours, while median performers take 2-5 days. That gap represents days of delayed features, slower feedback loops, and compounding context switching costs across your entire development pipeline. High code review cycle times often indicate communication gaps, unclear requirements, or overburdened reviewers, while consistently low cycle times suggest efficient collaboration and well-defined review processes.

This guide covers how to measure PR cycle time components, break down the different phases of the cycle, interpret benchmarks for your team size, diagnose root causes of delays, and implement proven reduction strategies. As an essential part of DORA metrics for engineering performance, understanding PR cycle time is crucial for evaluating engineering team performance and efficiency and for appreciating why PR cycle time is often a better metric than velocity. The target audience is engineering managers, VPs of Engineering, and team leads managing 5-50 developers who want to accelerate their software development process without sacrificing code quality.

The short answer: Reduce PR cycle time through smaller PRs (< 200 lines), automated triage and reviewer assignment, clear code ownership, and AI-powered pre-screening that catches issues before human reviewers engage. Keeping pull requests small and manageable is key—research shows that PRs with over 200 changes often deter reviewers, while smaller PRs lead to quicker, more effective code reviews.

By the end of this guide, you will:

  • Understand the three components of PR cycle time and how to track cycle time for each
  • Know what “good” looks like based on team size and industry benchmarks
  • Identify the specific bottlenecks causing longer cycle times on your team
  • Implement data-backed interventions that have delivered 30-50% improvements
  • Set realistic targets and measure progress over time
  • Understand how code reviews and code review cycle time impact team efficiency, and how to address high cycle time issues

Understanding PR Cycle Time

PR cycle time, often referred to as code review cycle time, is the total elapsed time from when a pull request is opened until it successfully merges into the main branch. This key metric measures the duration of the code review process and is central to DORA’s Lead Time for Changes—one of the four key metrics that distinguish elite engineering organizations from average performers. Understanding cycle time vs lead time within DORA metrics clarifies how PR cycle time fits into broader delivery performance. Code review cycle time can be broken down into different phases, such as initial development, waiting time, and review, to pinpoint where delays occur and optimize each segment for efficiency.

Understanding cycle time requires breaking it into these distinct phases, because the interventions for each are different. Tracking other pull request metrics—like PR Pickup Time and PR size—alongside PR review time and overall cycle time helps teams identify bottlenecks and target improvements more effectively. A team with high PR pickup time needs different solutions than one with slow merge times. High cycle time is often a sign of inefficiency and can indicate hidden problems within the workflow. Shorter PR cycle times usually indicate smoother workflows, while longer cycle times often signal hidden problems such as unclear ownership or overloaded reviewers.

PR Pickup Time

PR pickup time measures the duration from PR creation until the first reviewer begins reviewing. This is the waiting period where new code sits idle, and it typically dominates overall cycle time.

In an analysis of 117,413 reviewed pull requests, median pickup time was approximately 0.6 hours—but the P90 (slowest 10%) reached 128.9 hours. That’s over five days of waiting before anyone even looks at the code change.

High PR pickup time correlates directly with reviewer availability, team awareness of pending reviews, and lack of automated assignment. When it’s unclear who should review a PR, developers passively wait for someone else to pick it up. Ensuring the team is promptly notified when a PR exists is essential to avoid unnecessary delays and keep the workflow moving.

Managing review requests and making sure PRs are reviewed in a timely manner is crucial for reducing pickup time. Dashboards that track pending review requests and highlight bottlenecks can help teams respond faster and improve overall PR cycle time.

PR Review Time

Review time covers the active period from first review through final approval. This includes reading code, providing feedback, waiting for author responses, and iterating through review rounds. Code reviews are an essential process for maintaining code quality and delivery speed, but complex PRs can significantly increase review time due to the additional effort required to understand and assess them.

Key factors affecting review duration include pull request size, code complexity, and reviewer experience with the codebase. Large pull requests take exponentially longer—not just because there’s more code, but because reviewers defer them, requiring more context switching when they finally engage. Common causes of long PR cycle times include large pull requests, unclear ownership, and overloaded reviewers, which can create bottlenecks in the review process.

The tradeoff between review depth and speed is real. Teams must decide how much scrutiny different types of changes warrant. A one-line configuration fix shouldn’t require the same review process as complex changes to core business logic.

PR Merge Time

Merge time is the interval from final approval to actual merge into the main branch. This phase is often overlooked, but in the same GitHub dataset, P90 merge delay reached 19.6 hours.

Technical factors driving merge time include CI/CD pipeline duration, merge conflicts with other branches, required compliance checks, and branch policies that restrict merge windows. Teams with long-running test suites or manual deployment gates see this phase balloon.

Understanding each component matters because you can’t fix what you don’t measure. A team might assume review quality is the problem when actually their developers are waiting days for the first comment. The next section establishes benchmarks so you can identify where your team falls.

PR Cycle Time Benchmarks and Measurement

Industry benchmarks provide context for your team’s performance, but they require interpretation based on your specific situation. Metrics like code review cycle time and other pull request metrics—such as PR Pickup Time, overall cycle time, and PR size—are important benchmarks for assessing team performance and identifying bottlenecks in your workflow, especially when you follow the dos and don'ts of using DORA metrics effectively. A 24-hour cycle time means something different for a 5-person startup versus a 50-person team in regulated fintech. Frequent measurement of key performance indicators (KPIs) helps teams understand which strategies are effective in reducing PR cycle time and optimizing development velocity.

Elite vs Average Performance

Based on aggregated data from DORA reports, Typo and CodePulse research, code review cycle time benchmarks break down as follows:

Performance Tier Total Cycle Time Time to First Review
Elite < 12 hours < 2 hours (with four hours as a key benchmark for first review in elite teams)
High performers 12–24 hours 2–4 hours
Medium performers 1–3 days 8–12 hours
Low performers > 5 days > 24 hours

For teams of 5-50 engineers specifically: elite performers achieve under 12-24 hours total code review cycle time, with first review happening within four hours during business hours.

The median reviewed PR on public GitHub takes approximately 3 hours total—but P90 reaches 149 hours. That spread indicates most PRs move quickly, but a significant tail of delayed reviews drags down team velocity.

Measuring Each Component

Effective measurement requires tracking each phase separately rather than just total duration. Breaking down the process into different phases enables more targeted improvements:

  1. Pickup time: From PR creation to first reviewer comment
  2. Active review time: From first comment to final approval
  3. Merge delay: From approval to merge into main branch
  4. Review iterations: Number of request-changes cycles per PR
  5. PR size: Lines changed and files touched

Tracking other pull request metrics such as PR Pickup Time and PR size alongside these phases provides additional insight into where delays or inefficiencies occur in the pull request process.

Consider business hours versus calendar time. An 18-hour cycle time that spans overnight isn’t the same as 18 hours during working hours. Some tools normalize for this; others require manual interpretation.

Typo surfaces real-time PR analytics that break down these components automatically, helping engineering leaders identify bottlenecks without manual data collection. The platform tracks cycle time trends across teams and repos, flagging when metrics drift outside acceptable ranges and making it easier to track and improve DORA metrics across your SDLC.

Team Size and Context Factors

Benchmarks shift based on team composition and business context:

Small teams (5-10 engineers): Expect shorter cycle times due to higher code familiarity and simpler coordination. Target <4 hours for elite performance.

Medium teams (10-50 engineers): Coordination overhead increases. Target <24 hours for strong performance. Cross-team reviews and code ownership complexity require explicit processes.

Regulated industries: Compliance requirements, security reviews, and audit trails legitimately extend cycle time. Focus on reducing variance and eliminating unnecessary delays rather than hitting startup-speed benchmarks.

High-risk code changes: Critical paths warrant thorough review despite longer cycle times. The goal isn’t uniform speed—it’s appropriate speed for each type of change.

With benchmarks established, the next section covers specific interventions proven to reduce cycle time.

Proven Strategies to Reduce PR Cycle Time

These strategies come from teams that have achieved measurable improvements—not theoretical best practices. Setting WIP limits and actively managing review PRs are proven methods to reduce PR cycle time, as they help prevent bottlenecks and maintain a steady workflow. Each intervention addresses specific phases of the PR cycle and includes implementation guidance. Effective PR teams can save up to 40% of their time by streamlining processes and eliminating bottlenecks through structured workflows.

Optimize PR Size and Scope

Pull request size is the single strongest predictor of cycle time. Typo data shows small PRs get picked up 20× faster than large ones. The relationship is exponential, not linear. Complex PRs—those with many files changed or large code diffs—tend to slow down reviews, increase the risk of bugs, and create bottlenecks for both authors and reviewers.

Implementation steps:

  1. Enforce PR size limits: Target < 200 lines of code changes as standard practice. Configure automated warnings when PRs exceed thresholds.
  2. Break large features into incremental chunks: Each PR should represent one logical unit of change that can be reviewed independently. Avoid complex PRs by splitting large or multifaceted changes into smaller, manageable parts.
  3. Use feature flags: Decouple deployment from release. Merge incomplete features behind flags rather than waiting for everything to be done.
  4. Train developers on decomposition: Junior developers especially need coaching on how to slice work into reviewable pieces. Pair programming sessions can accelerate this skill.

For example, a team working on a major refactor initially submitted a single complex PR with over 1,000 lines changed. Reviewers hesitated to pick it up, and the PR sat idle for days. After splitting the work into five smaller PRs, each focused on a specific module, reviews were completed within hours, and feedback was more actionable.

Smaller PRs benefit everyone: authors get faster feedback, reviewers maintain focus without context switching overload, and the team catches issues earlier in the development process. Keeping pull requests small and manageable significantly enhances the likelihood of timely reviews, as large or complex PRs often deter reviewers and delay progress.

Implement Automated Triage and Assignment

When it’s unclear who should review a PR, it sits in limbo. Automated assignment eliminates this ambiguity and ensures that every team member is promptly notified when a PR exists, reducing the risk of overlooked or stalled pull requests. Managing review requests effectively—by tracking pickup times and monitoring pending review requests—helps teams identify bottlenecks and maintain steady progress.

Implementation steps:

  1. Set up CODEOWNERS files: Define ownership by directory or file pattern. GitHub, GitLab, and Bitbucket all support this.
  2. Configure automated reviewer assignment: Use round-robin or load-balanced assignment to distribute reviews across team members rather than concentrating on senior developers. Ensure that review requests are clearly assigned and visible so the team knows when a PR exists and can act quickly.
  3. Implement backup reviewer policies: When primary owners are unavailable, PRs should automatically route to qualified alternates.
  4. Add automated pre-checks: Linting, formatting, and basic tests should run before human review. This catches trivial issues automatically.

Establish Async Review Norms

Clear expectations around response times eliminate ambiguity and ensure reviews and merges are completed in a timely manner, which is essential for maintaining workflow efficiency and reducing waiting.

PR Priority Expected First Review Expected Resolution
Critical/Hotfix < 1 hour < 4 hours
Standard < 4 hours < 24 hours
Low priority < 8 hours < 48 hours

Supporting practices:

  • Daily review time blocking: Schedule 30-60 minutes specifically for reviewing pull requests rather than treating reviews as interrupts. This helps ensure reviews are handled in a timely manner.
  • Working agreement documentation: Write down expectations so new team members understand norms immediately.
  • PR description standards: Require context (what/why), test coverage notes, and risk assessment. Structured descriptions reduce review back-and-forth by 20-30% according to Microsoft research.

Async norms work because they remove negotiation overhead. Reviewers know what’s expected; authors know when to escalate, helping the team consistently complete reviews and merges in a timely manner.

Leverage AI Code Review

AI-powered pre-screening represents the largest recent advancement in reducing cycle time. These tools act as a first reviewer, catching issues before human reviewers engage and transforming how AI is used in the code review process.

Atlassian’s internal deployment of their AI code review agent reduced PR cycle time by approximately 45%. Their median time from open to merge had crept above 3 days, with pickup waits averaging 18 hours. After implementing AI pre-screening, the wait for first feedback dropped to effectively zero.

How AI code review helps:

  • Catches style violations, linting issues, and formatting problems automatically
  • Verifies acceptance criteria and checks for common patterns
  • Identifies potential security issues or performance concerns
  • Provides instant feedback so authors can fix issues before reviewers engage

Typo customers have seen substantial improvements: StackGen achieved 30% reduction in PR review time, and JemHR improved PR cycle time by 50%. These gains come from reducing review iterations—AI code reviews catch what would otherwise require human feedback rounds.

The balance between automation and human judgment matters. AI handles mechanical checks; humans focus on architecture, logic, and maintainability. This division makes both more effective.

Common Challenges and Solutions

Even teams committed to improvement hit obstacles. These are the most frequent bottlenecks and proven solutions. Setting WIP limits helps manage work-in-progress and prevent bottlenecks, while tracking other pull request metrics—such as PR Pickup Time, cycle time, and PR size—enables teams to monitor and optimize the entire pull request process. Additionally, mapping workflows visually, creating standard operating procedures (SOPs), and implementing a RACI matrix are effective strategies for improving PR processes and reducing cycle time.

Reviewer Availability and Overload

Problem: Senior engineers become bottlenecks, reviewing most PRs while their queues grow.

Solution: Implement load balancing across team members. Cross-train developers on different code areas so multiple people can approve in each subsystem. Track review distribution metrics and adjust when imbalance appears.

Unclear Review Ownership

Problem: PRs sit waiting because no one knows who should review them.

Solution: CODEOWNERS files combined with automated assignment rules. Define clear escalation paths for when owners are unavailable. Every directory should have at least two qualified reviewers.

Context Switching and Notification Fatigue

Problem: Constant PR notifications interrupt deep work, leading developers to ignore them entirely.

Solution: Batch review sessions instead of interrupt-driven reviews. Configure intelligent notification filtering that surfaces urgent items while batching routine reviews. Some teams find dedicated “review o’clock” times effective.

Large Legacy PRs

Problem: Some changes genuinely can’t be decomposed easily, especially migrations or refactoring.

Solution: Establish different review processes for known-large changes. Use incremental migration strategies where possible. When large PRs are unavoidable, schedule dedicated review time with appropriate reviewers rather than expecting async turnaround.

Conclusion and Next Steps

Reducing PR cycle time requires a systematic approach across three dimensions: controlling PR size, automating triage and initial review, and establishing clear team processes. The teams seeing 30-50% improvements aren’t doing one thing differently—they’re applying multiple interventions that compound.

Immediate next steps:

  1. Measure your current baseline: Track pickup time, review time, and merge time separately for two weeks. Identify which component dominates.
  2. Implement PR size limits: Set a <200 line guideline and configure automated warnings. This single change often delivers the largest impact.
  3. Set up automated reviewer assignment: Configure CODEOWNERS and assignment rules so PRs never sit waiting for someone to claim them.
  4. Establish response time expectations: Document expected turnaround by PR priority and share with the team.

Related areas to explore: Overall DORA metrics optimization connects PR cycle time to broader delivery performance, including CI/CD optimization using DORA metrics. Developer experience measurement helps identify whether cycle time improvements translate to actual productivity gains. Understanding how AI coding tools impact your metrics ensures you’re measuring what matters as development practices evolve.

See PR Analytics in Typo to track cycle time components and identify bottlenecks in real time. The platform surfaces where your team loses time across the entire code review process, enabling targeted interventions rather than guesswork.

Frequently Asked Questions

What’s the difference between PR cycle time and lead time for changes?

PR cycle time measures from pull request creation to merge. DORA’s Lead Time for Changes spans from first commit to running in production—a broader measure that includes time before PR creation and deployment time after merge. PR cycle time is a subset of lead time and typically the most actionable component for engineering teams to improve when you are mastering the art of DORA metrics.

How do I convince my team to keep PRs smaller without sacrificing quality?

Frame it as reducing cognitive load, not cutting corners. Smaller PRs get faster, more thorough reviews because reviewers can actually focus. Share data: PRs under 200 lines get reviewed 20× faster. Start with guidelines rather than hard limits, and celebrate examples of good decomposition. Feature flags enable shipping incomplete features safely, removing the pressure to batch everything into large PRs.

Should we prioritize speed over thorough code review?

No—but the framing is misleading. Smaller PRs enable both speed and thoroughness. A reviewer spending 20 focused minutes on a 100-line PR catches more issues than spending 90 distracted minutes on a 500-line PR. Optimize for review quality per line of code, not absolute time spent. Reserve intensive review for high-risk changes; routine changes can move faster.

How does AI code review impact overall cycle time?

AI code review primarily reduces pickup time (providing instant first feedback) and review iterations (catching issues authors would otherwise need to fix after human review). Atlassian saw 45% cycle time reduction; Exceeds AI data shows PRs with AI assistance close in 2.1 days versus 4.2 days without. The tradeoff: some research indicates AI-assisted PRs may have higher defect density, so human review remains essential for complex changes.

What’s a realistic target for teams just starting to optimize PR cycle time?

Start with reducing time to first review by 25% and ensuring 80%+ of PRs stay under 200 lines. For a team currently at 3-5 day cycle times, target reaching <48 hours within a quarter. Elite performance (<12 hours) typically requires multiple optimization cycles. Focus on consistency before speed—reducing variance in your slowest PRs often matters more than improving your already-fast ones.

throughput-metrics

Understanding Throughput Metrics: A Guide to Boosting Team Performance

In 2026, organizations across manufacturing, IT, and product development face mounting pressure to deliver more value with fewer resources. Throughput metrics have become the universal language for quantifying exactly how much value—whether units, tasks, transactions, or data—a system delivers per unit of time. Understanding throughput is no longer optional; it’s the foundation of operational efficiency and competitive advantage.

Throughput metrics are typically tracked over a certain period, such as daily or weekly intervals, to analyze and optimize efficiency.

This guide is intended for operations managers, software development leads, IT professionals, and anyone responsible for optimizing system performance or delivery processes. Tracking key metrics is essential for monitoring system performance and identifying opportunities to improve throughput.

This article covers throughput metrics across three critical domains: manufacturing operations, Agile and Kanban workflows in software development processes, and system performance including network and load testing. You’ll learn core formulas with practical examples, discover how to calculate throughput in different contexts, and understand how to interpret throughput data alongside related metrics like cycle time, lead time, and bandwidth.

What Is Throughput? Core Concept and Simple Formula

Throughput refers to the number of completed units of output delivered per defined period.

Throughput metrics measure the rate at which a system processes, completes, or delivers work within a specific timeframe. Throughput is the amount of data or transactions a system processes within a defined time frame under specific conditions. Throughput is the amount of a product that a company can produce and deliver within a set time period. Throughput measures how quickly and efficiently an organization can deliver products, services, or completed work to meet customer demands.

Whether you’re measuring products per hour, stories per sprint, or requests per second, the fundamental concept remains consistent: throughput quantifies your system’s actual delivery rate.

The basic formula is straightforward:

Throughput = Number of Completed Units / Time Period

  • A fulfillment center processing 480 orders during an 8-hour shift achieves throughput of 60 orders/hour
  • A software team completing 14 user stories in a two-week sprint has throughput of 7 stories/week
  • A web server handling 3,600 requests in one minute operates at 60 requests/second

The critical distinction here is that “completed units” must represent actual value delivered—sold products, deployed features, or successfully processed requests—rather than merely work started. A chair manufacturer with 100 chairs in their production process and an average flow time of 10 days has a throughput of 10 chairs per day, regardless of how many units are still being assembled.

Because throughput is a rate (not a raw count), it’s sensitive to both volume and time. This characteristic makes measuring throughput central for capacity planning, allowing teams to forecast how many units or tasks they can realistically deliver within a given period.

Throughput Metrics Across Domains

While the mathematical definition of throughput remains consistent, its practical interpretation varies across industries:

  • Manufacturing throughput: Units of product shipped per day, shift, or week. A factory producing 2,400 units daily provides a clear benchmark for capacity and scheduling.
  • Agile/Kanban/Scrum throughput: The team's throughput refers to the number of work items (user stories, tasks, bugs) completed per sprint or week. Tracking the team's throughput helps measure team productivity, monitor performance trends, and identify bottlenecks in the process. For example, a team delivering 12 items per sprint can forecast future delivery with reasonable confidence.
  • System and network throughput: Requests per second, transactions per minute, or Mbps of effective data transfer. An API handling 850 requests/second under load demonstrates real-world capacity.
  • Financial and healthcare systems: Critical transactions processed per second or hour under regulatory constraints. A hospital laboratory processing 220 lab tests hourly meets compliance requirements while maintaining high throughput.

These variations share a common thread: throughput always answers “how many units of value does this process deliver per unit of time?”

Throughput vs Related Metrics (Lead Time, Cycle Time, Velocity, Bandwidth)

Throughput rarely tells the complete story on its own. To gain valuable insights into team performance and organizational performance, you need to analyze throughput alongside other key flow metrics that capture different dimensions of system behavior.

Metric What It Measures Typical Units
Throughput Volume of completed work per time period Items/sprint, units/day, requests/sec
Lead time Total time from request to delivery Days, hours
Cycle time Time from work start to completion Days, hours
Velocity Effort completed per sprint (Agile) Story points/sprint
Bandwidth Theoretical maximum capacity Mbps, Gbps
  • Lead time spans from the moment a customer or stakeholder makes a request until delivery. While throughput counts how many units get done, lead time reveals how long each individual item spends waiting and being processed. High lead time with stable throughput often signals oversized work items or excessive wait time in queues.
  • Cycle time measures the duration from when active work begins until completion. Little’s Law creates a direct mathematical relationship: Throughput = Work in Progress / Cycle Time. A process with 20 items in progress and an average cycle time of 4 days yields throughput of 5 items per day.
  • Velocity in Agile measures story points per sprint, providing an effort-based planning metric. Teams that understand how to use Scrum velocity the right way can pair it effectively with throughput, whose advantage is its unit-agnostic nature—counting completed items rather than estimated effort—making cross-team comparisons simpler and forecasting more reliable.
  • Bandwidth represents theoretical maximum capacity (a 1 Gbps network link), while network throughput captures actual achieved data transfer rates under real conditions. Understanding this distinction is throughput important for realistic capacity planning.

Theory of Constraints and Throughput Optimization in Operations

Throughput metrics gained strategic prominence through the Theory of Constraints (TOC), pioneered by Eliyahu Goldratt in his 1984 novel “The Goal.” TOC positions throughput as the primary measure of system success, with all performance ultimately limited by a single constraint or bottleneck.

  • System constraint: A single resource or stage that caps overall output. A packaging machine limiting an entire plant’s output, or a final inspection station that can only process 350 units when upstream assembly produces 500, demonstrates how one bottleneck determines system throughput.
  • The five focusing steps: TOC provides a systematic approach—identify the constraint, exploit it (maximize utilization), subordinate everything else to it, elevate it (invest to expand capacity), and repeat the cycle as new constraints emerge.
  • Theoretical vs practical capacity: Theoretical capacity assumes zero downtime and perfect efficiency. Practical throughput accounts for setup time, changeovers, maintenance, and real-world variability. The gap between these figures reveals improvement opportunities.
  • Throughput accounting: In TOC’s financial framework, only units actually sold contribute to economic throughput. Built-up inventory sitting in warehouses doesn’t count—making throughput a measure of revenue generation rather than mere production volume.

Consider a factory capable of assembling 500 units daily, yet shipping only 350 units due to final inspection capacity limits. This throughput analysis immediately highlights where management should focus improvement efforts. Organizations use throughput per shift, per day, or per week as a governance metric in manufacturing, logistics, and warehouse operations to identify areas requiring intervention.

Throughput Metrics in Agile, Kanban, and Scrum

In software development and knowledge work, throughput tracks completed work items—user stories, tasks, bugs, or features—over a sprint or week. This performance metric provides a count-based view of delivery capacity that supports forecasting and process stability assessment.

  • Agile throughput: Number of work completed per time-box. A team finishing 14 stories in two week sprints has throughput of 14 items/sprint—simple, countable, and comparable over time. Distinguishing this from Agile velocity vs capacity is essential for realistic sprint planning.
  • Kanban throughput via Little’s Law: Throughput = WIP / Average Cycle Time. With 20 items in progress and a 4-day average cycle time, throughput equals 5 items/day. Reducing work in progress while maintaining cycle time directly increases throughput.
  • Throughput vs velocity: Velocity measures estimated effort (story points) while throughput counts actual completed items. When teams standardize item sizes, throughput becomes a simpler, more reliable forecasting tool than velocity, especially when combined with other top Agile metrics and why they matter.
  • Rolling averages: Track throughput over 3-5 sprints to see trends and stability rather than reacting to one-off spikes. This approach smooths out normal variability and reveals genuine improvement or decline, especially when supported by tools that move beyond JIRA sprint reports in 2024 for richer analysis.

Consider two teams with similar velocity of 40 story points per sprint. Team A completes 8 large items while Team B completes 16 smaller items. Differences in how teams estimate work—such as whether they rely more on story points vs hours for estimation—also influence how throughput and velocity trends are interpreted. Team B’s higher throughput typically indicates better predictability and more frequent customer feedback—demonstrating why throughput matters for agile project management.

Kanban Throughput Charts and Histograms

Kanban tools commonly visualize throughput using specialized charts that reveal patterns invisible in raw numbers:

  • Histograms display how often different throughput values occur. A team might see that they most frequently complete 6-8 items per day, occasionally hitting 15 items after major releases. This distribution shape helps teams understand variability and set realistic expectations.
  • Run charts plot work items over time, showing throughput trends across days or weeks. These charts help identify areas of seasonality (lower throughput during holiday weeks) and measure the impact of process changes.

A typical pattern might show a team whose throughput centers around 6-8 items/day under normal conditions but occasionally spikes to 15 items immediately following big releases when accumulated items flow through to completion. Recognizing these patterns enables better sprint planning and resource allocation.

Scrum Throughput: Best Practices and Examples

In Scrum, throughput measures completed Product Backlog Items per sprint, regardless of story point estimates. This simplicity makes it powerful for tracking team’s throughput over time, especially when complemented with DORA metrics to improve Scrum team performance.

Example progression:

  • Team A completes 11, 13, 12, and 14 items over four consecutive two-week sprints (average throughput: 12.5 items/sprint)
  • After implementing WIP limits and standardizing story sizes, the same team stabilizes at 15-16 items/sprint with less variability

Best practices for Scrum throughput:

  • Standardize item sizes within manageable ranges (limit to 1-3 story points) for more interpretable throughput trends
  • Segment throughput by work type—features, bugs, technical debt—to identify where the team spends time and identify bottlenecks
  • Use throughput trends for probabilistic forecasting (e.g., “85% chance of completing 18-22 items in the next 3 sprints based on historical data”), and augment this view with top JIRA metrics to boost productivity such as WIP, cycle time, and team workload
  • Avoid using throughput for individual performance ranking; emphasize team-level continuous improvement and system optimization instead

Throughput in Performance and Load Testing

In performance testing, throughput measures transactions processed per second or minute under specific load conditions. This metric is central to validating that systems can handle expected—and unexpected—traffic volumes.

  • Core formula: Throughput = Total Requests Successfully Processed / Test Duration. An API handling 18,000 requests in 5 minutes achieves 60 requests/second.
  • Context is essential: Throughput must be interpreted alongside response time and error rate. High throughput with high error rates indicates system failure, not success. Target thresholds might specify “850 requests/second with <300ms median response time and <0.1% error rate,” similar to how DORA metrics help boost engineering efficiency by pairing throughput-like measures with quality and reliability indicators.
  • Modern testing practice: Performance engineers routinely track throughput for HTTP requests, database queries, and message bus operations during load and stress tests. Real-time monitoring identifies exactly when throughput plateaus or degrades.
  • Real-world example: An e-commerce API maintained 850 requests/second with sub-300ms median response time during Black Friday simulations in November 2025. Testing revealed that throughput dropped significantly when concurrent users exceeded 50,000—leading to infrastructure scaling decisions before the actual event.

Test reports typically present time-series throughput graphs, helping teams identify at what user load throughput plateaus and correlate performance degradation with specific system components.

Network Throughput vs Bandwidth

Network throughput represents actual volume of data successfully delivered over a link per second, while bandwidth defines maximum theoretical capacity. Understanding this distinction is crucial for realistic capacity planning.

  • Practical example: A 1 Gbps fiber link typically achieves 700-800 Mbps real-world throughput due to protocol overhead, latency, and congestion in 2026 enterprise environments.
  • Measurement tools: Common network throughput measurement tools include iperf for point-to-point testing, SNMP-based monitoring for network infrastructure, and flow logs for traffic analysis.
  • Limiting factors: Several factors can limit throughput below theoretical bandwidth—latency, packet loss, retransmissions, intermediate device bottlenecks (firewalls, load balancers), and storage I/O constraints.
  • Holistic optimization: Increasing bandwidth alone may not improve throughput if other constraints remain unresolved. A 10 Gbps link connecting to a database with 100 Mbps I/O capability won’t deliver 10 Gbps throughput regardless of network capacity.

Engineers read throughput graphs during incident analysis to pinpoint whether network capacity, application logic, or backend systems are causing degradation.

How to Calculate and Interpret Throughput Metrics

This section provides ready-to-use formulas for typical contexts along with guidance on interpretation and common pitfalls.

Operations/Manufacturing:

  • Throughput = Units Shipped / Time
  • Example: 12,000 units over a 5-day week = 2,400 units/day
  • Check against machine capacity and labor availability to identify gaps between actual and potential throughput

Agile/Kanban:

  • Throughput = Number of Items Completed / Time Window
  • Example: 32 items in 4 weeks = 8 items/week
  • Ensure consistent definition of “done”—only count items that meet your Definition of Done, not partially completed work

Performance Testing:

  • Throughput = Successful Transactions / Measurement Interval
  • Break down by endpoint, transaction type, or user journey for granular insights
  • Exclude failed requests, timeouts, and error responses from throughput calculations

Financial/Healthcare:

  • Throughput expressed as transactions processed per hour or messages per second
  • Filter out failed or rolled-back operations to measure true processing time capability

Interpretation guidance:

  • Use median rather than mean throughput for more reliable planning when distribution is skewed
  • Track percentiles (50th, 90th, 95th) to understand variability
  • Document assumptions including test data characteristics, workload mix, and operating hours when reporting throughput figures

Throughput Measurement Tools

Throughput measurement tools play a key role in helping organizations achieve operational efficiency by providing the data and insights needed to calculate throughput, analyze performance, and identify bottlenecks across workflows. By leveraging these tools, teams can visualize throughput, track progress on tasks, and pinpoint areas where efficiency can be improved.

Time tracking software is a foundational tool for measuring how long tasks and projects take to complete. By capturing detailed throughput data, these tools enable teams to analyze throughput trends, identify areas where work slows down, and make informed decisions to optimize productivity.

Project management platforms such as Asana, Trello, and Jira are widely used to manage workflows, monitor work in progress, and track completed items over a set timeframe. These tools not only help teams calculate throughput but also provide valuable insights into team performance, allowing managers to identify bottlenecks and allocate resources more effectively. By visualizing throughput and work completed, organizations can quickly spot inefficiencies and implement targeted improvements.

Analytics software, including solutions like Google Analytics and Mixpanel, extends throughput measurement to digital environments. These tools help organizations analyze throughput in terms of website traffic, user actions, and conversion rates, offering a data-driven approach to optimizing digital processes and increasing throughput.

In supply chains and logistics, specialized supply chain management software is essential for tracking inventory, monitoring the flow of raw materials, and managing the production process. These tools help organizations identify areas where wait time or processing time limits throughput, enabling more efficient sourcing of raw materials and smoother delivery of finished goods.

By integrating these throughput measurement tools into their operations, organizations gain the ability to continuously monitor, analyze, and improve throughput. This leads to greater efficiency, higher productivity, and a more agile response to changing business demands.

Benefits of Tracking Throughput Metrics

Consistently tracking throughput gives organizations a quantitative basis for improvement decisions rather than relying on intuition or anecdotes. The benefits span operational, financial, and customer-facing dimensions.

  • Capacity planning: Use historical data to estimate how many units or tasks can realistically be completed per day, sprint, or month. This throughput data directly informs budget and staffing decisions, helping teams plan hiring and equipment investments for 2026 cycles, and complements development velocity as a planning metric in software teams.
  • Bottleneck identification: When throughput at one stage is significantly lower than upstream or downstream steps, you’ve found a constraint. This visibility enables targeted intervention rather than across-the-board resource increases.
  • Financial impact: Higher throughput at stable cost base improves margins. Organizations optimizing throughput and reducing idle time document profit improvements ranging from 10-25%, making throughput important as a financial metric, particularly when paired with strong development velocity in software delivery.
  • Customer experience: Higher and more stable throughput reduces lead times, improves on-time delivery rates, and supports SLA commitments. For SaaS products and logistics operations, increased throughput directly correlates with customer satisfaction.
  • Supply chain optimization: Understanding throughput across supply chains—from sourcing raw materials through production to delivery—reveals where raw materials bottleneck and where processing capacity exceeds demand.

These benefits apply across functions: operations teams use throughput for scheduling, engineering teams for sprint planning, and finance teams for margin analysis.

Strategies to Increase Throughput

Improving throughput isn’t simply about working faster—it requires systematically removing constraints and reducing waste. The flow rate through any system depends on its weakest link, so indiscriminate effort often yields minimal results.

  • Reduce work in progress (WIP): Lower WIP shortens cycle times and frees capacity. Per Little’s Law, reducing WIP with stable throughput mathematically decreases cycle time. Teams implementing strict WIP limits frequently see throughput increase within weeks.
  • Standardize work: Create checklists and standard procedures to reduce rework and variability. In manufacturing, standardized changeover procedures reduce downtime. In software, standardized deployment processes eliminate manual errors.
  • Automate repetitive steps: Deployment pipelines, regression tests, data imports, and reporting consume significant capacity when handled manually. Automation raises sustainable throughput while freeing human capacity for higher-value work.
  • Improve upstream quality: Better requirements and fewer defects mean downstream stages can process more items with less interruption. Quality problems compound through the production process, so prevention beats detection.
  • Implement real-time monitoring: Dashboards tracking throughput, latency, and queue length detect slowdowns early. Whether in factory operations or IT systems, visibility enables rapid response before minor issues cascade.
  • Rebalance around the constraint: Add operators to inspection, scale database replicas, or increase packaging capacity—focus resources where they’ll have the greatest throughput impact rather than applying generic headcount increases.

Any throughput increase must be balanced with quality and risk management. Track defect rates, error percentages, and customer complaints alongside throughput to ensure speed doesn’t compromise value. Maintaining high throughput means nothing if quality degrades.

Organizational Approaches to Throughput

Organizations seeking to maximize throughput and maintain high operational efficiency often adopt proven methodologies and frameworks that focus on continuous improvement, reducing bottlenecks, and increasing productivity. These organizational approaches are designed to optimize the flow of work, streamline processes, and ensure that resources are used as efficiently as possible.

Lean manufacturing is a widely adopted approach that emphasizes the elimination of waste, reduction of variability, and improvement of process flow. By focusing on value-added activities and systematically removing inefficiencies, Lean helps organizations increase throughput and deliver more value with fewer resources.

Agile project management is another powerful strategy, particularly in software development and knowledge work. By breaking down large projects into smaller, manageable tasks and prioritizing work based on customer value, Agile teams can improve throughput, adapt quickly to change, and foster a culture of continuous improvement. Regular retrospectives and iterative planning help teams identify bottlenecks and implement targeted improvements to their workflows.

Total Quality Management (TQM) takes a holistic approach to improving throughput by engaging employees at all levels in the pursuit of quality and efficiency. TQM emphasizes continuous improvement, data-driven decision-making, and a strong focus on customer satisfaction. By embedding quality into every stage of the production process, organizations can reduce rework, minimize delays, and increase overall throughput.

Just-in-time (JIT) production is a strategy that aligns production schedules closely with customer demand, minimizing inventory and reducing wait times. By producing and delivering products only as needed, organizations can optimize throughput, reduce excess work in progress, and respond more flexibly to market changes.

By implementing these organizational approaches, companies can systematically improve throughput, reduce bottlenecks, and drive ongoing improvements in efficiency and productivity. These strategies not only enhance team performance and project management outcomes but also position organizations for long-term success in competitive markets.

Common Pitfalls and Misuses of Throughput Metrics

Throughput can mislead when measured incorrectly or incentivized poorly. Awareness of common pitfalls helps teams avoid optimizing for the wrong outcomes.

  • Gaming through item splitting: Teams may artificially split work items to “complete more” tickets without delivering more value. Throughput counts should reflect genuine value delivered, not arbitrary subdivisions.
  • Ignoring quality: Throughput increases that correlate with rising defect rates, rollbacks, or customer complaints indicate false progress. Watch for quality metrics degrading when throughput spikes.
  • Incompatible comparisons: Comparing teams with fundamentally different work (support tickets vs complex features) or different definitions of “done” produces meaningless rankings. Standardize units before comparing.
  • Short-window volatility: Single-day or single-sprint measurements exaggerate normal variability. Evaluate multi-period trends over several sprints or weeks for reliable insights into efficiency.
  • Local optimization at system expense: One team maximizing their output while overwhelming downstream teams creates bottlenecks elsewhere. System-level throughput matters more than any single team’s numbers.

In one documented case, throughput-tied bonuses led a team to fragment large projects into dozens of tiny tickets, technically increasing throughput while delaying actual project completion by weeks. The lesson: throughput incentives must align with customer value, not just item counts.

Conclusion

Throughput metrics, when clearly defined and consistently measured, provide a powerful lens on system performance across manufacturing, Agile delivery, and IT operations. From how many units a factory ships daily to transactions processed by financial systems per second, throughput answers the fundamental question of delivery capacity.

The most effective use of throughput combines:

  • A precise definition of completed units that represent actual value
  • Appropriate time windows that smooth variability while enabling timely decisions
  • Context from closely related metrics including lead time, cycle time, response time, bandwidth, and quality indicators

Industry leaders in 2026 leverage throughput metrics not just for reporting, but for probabilistic forecasting, constraint identification, and continuous improvement. Real-time dashboards in manufacturing execution systems and Kanban tools provide immediate visibility, while AI-driven simulations enable more sophisticated planning than simple averages allow.

Start by mapping your current process and identifying the single biggest constraint limiting your throughput today. Implement basic throughput tracking with consistent definitions and measurement periods. As your data matures, incorporate other metrics and move toward more advanced analyses. Building resilient, scalable, and customer-centric operations requires exactly this kind of quantitative foundation—and throughput metrics provide the starting point.

full-development-cycle

Mastering the Full Development Cycle: A Practical Guide for Success

The full development cycle, commonly referred to as the Software Development Life Cycle (SDLC), is a structured, iterative methodology used to plan, create, test, and deploy high-quality software efficiently at a low cost. The SDLC consists of several core stages, also known as common SDLC phases and key phases: planning, design, implementation, testing, deployment, and maintenance. Each of these phases plays a critical role in the software development process, serving as essential checkpoints that contribute to quality and project success.

  • The planning phase is the foundation of any successful software development project, where the project team gathers and documents project goals, objectives, requirements, project scope, and cost estimates. This phase often begins with a discovery phase, which helps define the project plan, deadlines, and resource allocation through tasks like cost-benefit analysis, scheduling, and resource estimation.
  • The design phase involves software engineers analyzing requirements and identifying the best solutions to create the software. This phase is all about building the framework for the software, including the creation of the software's architecture as a blueprint for the system, as well as defining detailed design specifications.
  • In the implementation phase (also called the development phase or coding phase), the development team and full cycle developers transform the design into a functional application by coding the product based on the design specifications and conducting code reviews.
  • The testing phase is critical because it generates essential performance and usability feedback while revealing defects and quirks. It includes software testing activities such as unit testing, integration testing, system testing, and executing test cases by QA engineers and the testing team. This corresponding testing phase checks the software for bugs and ensures it meets customer requirements.
  • The deployment phase includes several tasks to move the latest build copy to the production environment and involves rolling out the meticulously tested software to end-users.
  • Finally, the maintenance phase focuses on continuous improvement, providing ongoing support, fixing bugs, resolving customer issues, and managing software changes to keep the product functional and relevant.

After understanding the phases, it’s important to recognize the variety of SDLC models available. Common SDLC models include the Waterfall model (a linear, sequential approach best for small projects), the Agile model (an iterative, flexible methodology emphasizing collaboration and customer feedback), the V-shaped model (which focuses on validation and verification through testing at each stage), the Spiral model (which combines iterative development with risk assessment), and the RAD (Rapid Application Development) model (which emphasizes quick prototyping and user feedback). Choosing the right SDLC model depends on the software project’s requirements, team structure, and complexity, especially for complex projects.

The full development cycle refers to managing a software product’s entire process and full life cycle through a structured SDLC process that maintains team continuity and a unified project vision. This approach is central to custom software development and full cycle development, where the same project team is engaged throughout the software development lifecycle. A full cycle developer is involved in all stages of the software development process, ensuring seamless workflow, clear communication, and comprehensive responsibility for project success. Unlike segmented or sprint-based development, full-cycle software development services ensure no interruptions during the development cycle, leading to faster time-to-market, better budget management, and cost-effectiveness.

Full-cycle software development is also ideal for MVP development, as it allows for planning all steps in advance and gradual implementation. This is particularly beneficial for complex projects, as it allows for comprehensive planning, risk management, and proactive problem-solving. The consistency of engaging the same team throughout the entire process enhances communication, collaboration, and the quality of the final product. A unified dev team boosts developer productivity and operational efficiency, empowering the team to deliver better results and reduce burnout.

Why does this matter? With fast-changing market demands and high customer expectations, managing the entire lifecycle allows faster response to change, better alignment to business objectives, and improved quality assurance. Effective project management in a software project includes monitoring & controlling, risk management, and maintaining cost & time efficiency through detailed planning and improved visibility, all of which contribute to effective software delivery across the SDLC. Improved visibility and efficiency in SDLC keeps stakeholders informed and streamlines project tracking.

Organizations using fragmented approaches often accumulate significant technical debt because early decisions in system architecture, security, and user experience suffer when later teams lack context from previous development stages. Effective communication among team members and full cycle developers further enhances workflow efficiency and project success, particularly when supported by well-chosen KPIs for software development team success that align everyone on shared outcomes.

Risk management in SDLC detects issues early, mitigating potential security or operational risks, especially when teams follow well-defined software development life cycle phases with clear deliverables and review points. Additionally, SDLC addresses security by integrating security measures throughout the entire software development life cycle, not just in the testing phase. Approaches such as DevSecOps incorporate security early in the process and make it a shared responsibility, ensuring a proactive stance on security management during SDLC from initial design to deployment.

Introduction to Development Cycle

The development cycle, often referred to as the software development life cycle (SDLC), is a structured process that guides development teams through the creation of high quality software. By following a systematic approach, the SDLC ensures that every stage of software development—from initial planning to final deployment—is carefully managed to meet customer expectations and business goals. This life cycle is designed to bring order and efficiency to software development, reducing risks and improving outcomes. Each phase of the development cycle plays a vital role in shaping the software development life, ensuring that the final product is robust, reliable, and aligned with user needs. By adhering to a structured process, organizations can deliver software that not only functions as intended but also exceeds customer expectations throughout its entire life cycle.

Development Life Cycle SDLC

The Development Life Cycle SDLC is the backbone of a successful software development process, providing a systematic framework that guides teams from concept to completion. By breaking down the software development process into distinct, interconnected phases—such as planning, design, implementation, testing, deployment, and maintenance—the SDLC process ensures that every aspect of the project is carefully managed and aligned with customer expectations. This structured approach not only helps development teams produce high quality software, but also enables them to anticipate challenges, allocate resources efficiently, and maintain a clear focus on project goals throughout the life cycle. By adhering to the development life cycle SDLC, organizations can deliver software that is reliable, scalable, and tailored to meet the evolving needs of users, ensuring long-term success and satisfaction.

Streamlined Workflow for the Development Team

A streamlined workflow is the backbone of an effective software development life cycle. In full cycle software development, the development team benefits from a clearly defined process where each stage—from planning through deployment—is mapped out and responsibilities are transparent. This clarity allows the team to collaborate efficiently, minimizing bottlenecks and ensuring that every member knows their role in the development cycle. By maintaining a structured workflow, the development process becomes more predictable and manageable, which is essential for delivering high quality software that aligns with customer expectations. Project management plays a pivotal role in this, with methodologies like agile and Lean development practices for SDLC helping teams adapt quickly to changes and stay focused on their goals, and with resources on engineering data management and workflow automation further supporting continuous improvement. Ultimately, a streamlined workflow supports the entire life cycle, enabling the development team to deliver consistent results and maintain momentum throughout the software development life.

Planning and Requirement Gathering

The planning and requirement gathering phase is the cornerstone of a successful software development life cycle. During this stage, the development team collaborates closely with stakeholders—including customers, end-users, and project managers—to collect and document all necessary requirements for the software project. This process results in the creation of a comprehensive software requirement specification (SRS) document, which outlines the project scope, objectives, and key deliverables. The SRS serves as a roadmap for the entire development process, ensuring that everyone involved has a clear understanding of what needs to be achieved. In addition to defining requirements, the planning phase involves careful risk management, accurate cost estimates, and strategic resource allocation that directly influence developer productivity throughout the project. These activities help the team assess project feasibility and set realistic timelines, laying a solid foundation for the rest of the software development life, including planning for effective code review best practices that will support code quality later in the cycle. By investing time and effort in thorough planning, development teams can minimize uncertainties and set the stage for a smooth and successful project execution.

Design Phase

The Design Phase is a pivotal part of the software development life cycle, where the vision for the software begins to take concrete shape. During this stage, software engineers use the insights gathered during the planning phase to craft a detailed blueprint for the software product. This involves selecting the most appropriate technologies, development tools, and considering the integration of existing modules to streamline the development process. The design phase also addresses how the new solution will fit within the current IT infrastructure, ensuring compatibility and scalability. The result is a comprehensive design document that outlines the software’s architecture, user interfaces, and system components, serving as a roadmap for the implementation phase. By investing in a thorough design phase, development teams lay a strong foundation for the entire development process, reducing risks and setting the stage for a successful software development life.

Development Stages

The development stages of the software development life cycle encompass the design, implementation, and testing phases, each contributing to the creation of a high quality software product. In the design phase, software engineers translate requirements into a detailed blueprint, defining the software’s architecture, components, and interfaces. This careful planning ensures that the system will be scalable, maintainable, and aligned with the project’s goals, while also creating the context needed to avoid common mistakes during code reviews that can undermine software quality. The implementation phase follows, where the development team brings the design to life by writing code, conducting code reviews, and performing unit testing to verify that each component functions correctly. Collaboration and attention to detail are crucial during this stage, as they help maintain code quality and consistency. Once the core features are developed, the testing phase begins, involving integration testing, system testing, and acceptance testing. These activities validate the software’s functionality, performance, and security, ensuring that it meets the standards set during the earlier phases. By progressing through these development stages in a structured manner, teams can effectively manage the software development life, reduce overall software cycle time, and minimize coding time within cycle time to deliver reliable solutions that fulfill user needs.

Testing and Quality Assurance

Testing and quality assurance are essential components of the software development life cycle, ensuring that the final product meets both technical standards and customer expectations. During the testing phase, the testing team employs a variety of techniques—including black box, white box, and gray box testing—to thoroughly evaluate the software’s functionality, performance, and security, often relying on specialized tools that improve the SDLC from automated testing to continuous integration. These methods help identify and report defects early, reducing the risk of issues in the production environment. Quality assurance goes beyond testing by incorporating activities such as code reviews, validation, and process improvements to guarantee that the software is reliable, stable, and maintainable, often supported by an effective code review checklist that standardizes review criteria. The creation of detailed test cases, test scripts, and test data enables comprehensive coverage and repeatable testing processes. By prioritizing quality assurance throughout the life cycle, development teams can produce high quality software that not only meets but often exceeds customer expectations, supporting long-term success and continuous improvement in the software development process.

Deployment and Maintenance

Deployment and Maintenance are essential phases in the software development life cycle that ensure the software product delivers ongoing value to users. The deployment phase is when the software is packaged, configured, and released into the production environment, making it accessible to end-users. This stage requires careful planning to ensure a smooth transition and minimal disruption. Once deployed, the maintenance phase begins, focusing on supporting the software throughout its operational life. This includes addressing bugs, implementing updates, and responding to user feedback to ensure the software continues to meet customer expectations. Maintenance also involves monitoring system performance, enhancing security, and making necessary adjustments to keep the software reliable and efficient. Together, the deployment and maintenance phases are crucial for sustaining the software development life and ensuring the product remains robust and relevant over time.

Faster Time-to-Market

One of the standout advantages of full cycle software development is the ability to achieve faster time-to-market by improving key delivery metrics such as cycle time and lead time. By following a structured development process and leveraging iterative development practices, development teams can quickly transform ideas into a working software product. This approach allows for rapid prototyping, frequent releases, and continuous feedback, ensuring that new features and improvements reach users sooner. Automation in testing and deployment further accelerates the process, reducing manual effort and minimizing delays. As a result, businesses can respond swiftly to evolving market demands, outpace competitors, and better satisfy customer needs. The full cycle approach not only speeds up delivery but also ensures that the software product maintains the quality and functionality required for long-term success.

Risks, Mitigation, and Risk Management

Navigating the software development life cycle comes with its share of risks, from project delays and budget overruns to the delivery of subpar software. Effective risk management is essential to a successful development process. Development teams can proactively address potential issues through comprehensive risk analysis, identifying and evaluating threats early in the development cycle. Contingency planning ensures that the team is prepared to handle unexpected challenges without derailing the project. Continuous testing throughout the development life cycle SDLC helps catch defects early, while analyzing cycle time across development stages reduces the likelihood of costly fixes later on. Strong project management practices, supported by the right tools and careful tracking of issue cycle time in engineering operations and accurately calculating cycle time in software development, keep the team organized and focused, further minimizing risks. By integrating these strategies, teams can safeguard the software development life, ensuring that the final product meets both quality standards and customer expectations.

Tools and Technologies

A successful software development life cycle relies on a suite of tools and technologies that support each phase of the development process. Project management tools help the development team organize tasks, track progress, and collaborate effectively. Version control systems, such as Git, ensure that code changes are managed efficiently and securely, while tracking key DevOps metrics for performance helps teams understand how those changes affect delivery speed and stability. Integrated development environments (IDEs) like Eclipse streamline coding and debugging, while testing frameworks such as JUnit enable thorough and automated software testing. Deployment tools, including Jenkins, facilitate smooth transitions from development to production environments. The selection of these tools depends on the project’s requirements and the preferences of the development team, but their effective use can significantly enhance the efficiency, quality, and reliability of the software development process throughout the life cycle.

Best Practices

Adopting best practices is vital for development teams aiming to deliver high quality software that meets and exceeds customer expectations. Following a structured software development life cycle ensures that every phase is executed with precision and accountability. Thorough requirements gathering and analysis lay the groundwork for success, while iterative and incremental development approaches allow for flexibility and continuous improvement. Regular code reviews help maintain code quality and catch issues early, and the use of version control systems safeguards project assets, especially when teams follow best practices for setting software development KPIs to measure and improve these activities. Continuous testing and integration ensure that new features are reliable and do not disrupt existing functionality. Additionally, investing in the ongoing training and development of the team, embracing agile methodologies, and fostering a culture of learning and adaptation all contribute to a robust software development life. By integrating these best practices into the life cycle, development teams can consistently produce software that is reliable, maintainable, and aligned with customer needs.

github-copilot-roi

Maximizing GitHub Copilot ROI: Strategies for Effective Implementation

GitHub Copilot ROI is top of mind in February 2026, and engineering leaders everywhere are asking the same question: is this tool actually worth it? Understanding Copilot ROI helps engineering leaders make informed investment decisions and optimize team productivity. ROI (Return on Investment) is a measure of the value gained relative to the cost incurred. The short answer is yes—if you measure beyond license usage and set it up intentionally. Most teams still only see 28-day adoption windows, not business impact.

The data shows real potential. GitHub’s 2023 controlled study found developers with Copilot completed coding tasks 55% faster (1h11m vs 2h41m). But GitClear’s analysis of millions of PRs revealed ~41% higher churn in AI-assisted code. Typo customers who combined Copilot with structured measurement saw different results: JemHR achieved 50% improvement in PR cycle time, and StackGen reduced PR review time by 30%.

This article is for VP/Directors of Engineering and EMs at SaaS companies with 20–500 developers already piloting Copilot, Cursor, or Claude Code. Here’s what we’ll cover:

  • Why measuring ROI of GitHub Copilot is harder than it looks
  • A 4-step measurement framework you can implement this quarter
  • Benchmarks, pitfalls, and what the research actually says
  • How Typo measures Copilot ROI end-to-end with real SDLC (Software Development Life Cycle) data

The state of GitHub Copilot adoption in 2026

Over 50,000 businesses and roughly one-third of the Fortune 500 now use GitHub Copilot. Yet most organizations only track seats purchased and monthly active users—metrics that tell you nothing about software delivery improvement.

Adoption patterns vary dramatically across teams:

Copilot Adoption Patterns

  • Top-quartile teams show 60–70% weekly Copilot usage
  • Long-tail teams remain below 30% adoption
  • Acceptance rates typically hover around 27–30%
  • Usage patterns differ significantly by language and editor

This creates the “AI productivity paradox”: individual developer speed goes up, but org-level delivery metrics stay flat. Telemetry studies across 10,000+ developers confirm this pattern—faster individual coding, but modest or no change in lead time until teams rework their review and testing pipelines.

GitHub’s built-in Copilot metrics provide a 28-day window with per-seat usage and suggestion acceptance rates. But engineering leaders need trend lines over quarters, impact on PR flow, incident rates, and rework data. Typo connects to GitHub, GitLab, Bitbucket, Jira, and other core tools in ~60 seconds to unify this data without extra instrumentation using its full suite of engineering tool integrations.

Adoption vs. impact: the metrics most teams get wrong

Most dashboards answer “How many people use Copilot?” instead of “Is our SDLC (Software Development Life Cycle) healthier because of it?” This distinction matters because license utilization can look great while PR throughput and code quality degrade.

Adoption Metrics (Only Step 1)

  • Seats purchased vs. activated
  • Daily/weekly active Copilot users
  • Suggestions accepted and lines generated
  • Language, editor, and team breakdowns

Impact Metrics Tied to Business Value

  • PR cycle time and time to merge
  • Lead time for changes and overall delivery velocity
  • Deployment frequency and deployment rework rate
  • Change failure rate and MTTR
  • Churn in AI-influenced files (41% higher per GitClear data)

Developer experience metrics—satisfaction, cognitive load, burnout risk—are part of ROI, not “nice to have.” Satisfied developers perform better and stay longer. Many teams overlook that improved developer satisfaction directly affects retention costs, even though developer productivity in the age of AI is increasingly shaped by these factors.

Definition: AI-assisted work refers to code or pull requests (PRs) created with the help of tools like GitHub Copilot. AI-influenced PRs are pull requests where AI-generated code or suggestions have been incorporated.

What the research actually says about GitHub Copilot ROI

The evidence base for AI-assisted development is now much stronger than in 2021–2022.

Key Research Findings

  • GitHub controlled experiment (2023): 55% faster task completion, 78% vs 70% completion rate
  • GitHub developer survey (2,000+ devs): 88–90% reported higher productivity and more “flow”
  • GitClear PR analysis (2023–2024): ~41% higher churn in AI-assisted repos
  • Platform telemetry (10K+ devs): Faster individual coding, flat org-level lead time

Typo’s dataset of 15M+ PRs across 1,000+ teams reveals a consistent pattern: teams that combine Copilot with disciplined PR practices see 20–30% reductions in PR cycle time and more deployments within 3–6 months. The key insight: Copilot has strong potential ROI, but only when measured within the SDLC, not just the IDE—exactly the gap Typo’s AI engineering intelligence platform is built to address.

A 4-step framework to measure GitHub Copilot ROI in your org

This framework is designed for VP/Director-level implementation: baseline → track → survey → benchmark. Everything must be measurable with real data from GitHub, Jira, and CI/CD tools.

Step 1: Establish a pre-Copilot baseline

You can’t calculate ROI without “before” data—ideally 4–12 weeks of history. Capture these baseline metrics per team and repo:

Engineering Delivery Metrics

These maps closely to DORA metrics for engineering leaders, so you can compare your Copilot impact to industry benchmarks.

  • Average PR cycle time (open → merge)
  • Lead time for changes (first commit → production deploy)
  • Deployment frequency and deployment rework rate
  • Change failure rate and incident MTTR

Code Quality Measures

  • Bug density (defects per KLOC or per story)
  • Percentage of PRs requiring rework before merge
  • Churn in critical modules

Developer Experience Baseline

Use structured DevEx questions and lightweight in-tool prompts from an AI-powered developer productivity platform rather than ad hoc surveys.

  • Short, anonymous survey about focus time, cognitive load, and tooling satisfaction
  • Developer satisfaction scores as a retention indicator

Example baseline: “Team Alpha: 2.5-day median PR cycle time, 15 deployments/month, 18% change failure rate in Q4 2025.”

Step 2: Instrument and tag AI-assisted work

You must distinguish AI-influenced PRs from non-AI PRs to get valid comparisons. Without this, you’re measuring noise.

Definition: AI-assisted work refers to code or pull requests (PRs) created with the help of tools like GitHub Copilot.

Practical Tagging Approaches

For remote and distributed teams, pairing tagging with AI-assisted code reviews for remote teams can make it easier to consistently flag AI-generated changes.

  • Use GitHub Copilot’s per-commit AI attribution (GA Feb 2026)
  • Infer AI influence from IDE telemetry or commit metadata
  • As fallback, use PR labels or branch naming conventions

Data Sources to Integrate

Treat Git events and work items as a single system of record by leaning on deep GitHub and Jira integration so that Copilot usage is always tied back to business outcomes.

  • GitHub Copilot metrics API for usage and acceptance rates
  • GitHub/GitLab/Bitbucket for commits and PRs
  • Jira/Linear for issue and cycle-time context
  • CI/CD tools for deployment outcomes

Typo’s AI Impact Measurement pillar automatically correlates “AI-assisted” signals with PR outcomes—no Elasticsearch + Grafana setup required, and its broader AI-powered code review capabilities ensure risky changes are flagged early.

Step 3: Run a time-boxed Copilot experiment

Treat this as a data-driven experiment, not a permanent commitment: 8–12 weeks, 1–3 pilot teams, clear hypotheses.

Experiment Design

  • Select comparable teams with at least one control group using minimal AI
  • Provide Copilot to pilot teams with structured onboarding
  • Keep other process variables stable (same review rules, sprint cadence)

Weekly Tracking Metrics

  • PR cycle time and review latency per team
  • Throughput (PRs merged, story points delivered)
  • AI-influenced PR percentage and suggestion acceptance rates
  • Code review rounds and comments per PR

Example result: “Pilot Team Bravo reduced median PR cycle time from 30h to 20h over 10 weeks while AI-influenced PR share climbed from 0% to 45%.”

Step 4: Quantify ROI across speed, quality, and DevEx

ROI Formula: ROI = (Value of Time Saved + Quality Gains + DevEx Improvements − Costs) ÷ Costs

Time Savings Calculation

  • Estimate hours saved per developer per week (2–6 hours based on benchmarks)
  • Multiply by fully loaded hourly cost ($120–$160/hr)
  • Annualize for the pilot team

Worked Example

  • 20 devs saving 1.5 hours/week at $140/hr = ~$218K/year
  • Copilot Enterprise at $39/dev/month = $9,360/year
  • Implied ROI > 20× before accounting for fewer bugs and faster delivery

Quality gains include fewer incidents, lower rework, and reduced churn. DevEx value covers reduced burnout risk and improved developer happiness tied to retention.

Key metrics to track for GitHub Copilot ROI

Anchor on a small, rigorous set of concrete metrics rather than dozens of vanity charts.

Delivery Speed Metrics

  • Lead time for changes
  • PR cycle time
  • Review wait time
  • Deployment frequency
  • Time from merge to production

Code Quality & Risk Metrics

  • Change failure rate
  • MTTR
  • Deployment rework rate
  • Churn in AI-influenced files vs non-AI files
  • Security findings per PR

Developer Experience Metrics

  • Self-reported productivity (SPACE-style surveys)
  • “Good day” scores
  • Friction hotspots
  • Perceived Copilot’s impact on stress

GitHub’s Copilot metrics (activation, acceptance, language breakdown) are useful input signals but must be correlated with these SDLC metrics to tell an ROI story. Typo surfaces all three buckets in a single dashboard, broken down by team, repo, and AI-adoption cohort.

Real-world Copilot ROI stories (with numbers)

JemHR (Scale-up SaaS)

40–60 engineers using Node.js/React with GitHub + Jira. After measuring baseline and implementing Copilot with Typo analytics, they achieved ~50% improvement in PR cycle time over 4 months. Deployment frequency increased ~30% with no increase in change failure rate.

StackGen (DevTools startup)

15 engineers facing severe PR review bottlenecks. Copilot adoption plus Typo’s automated AI code review reduced PR review time by ~30%. Reviewers focused on architectural concerns while AI caught style issues and performed more thorough analysis of routine tasks.

Enterprise pilot

120-engineer org runs a 12-week Copilot+Typo pilot with 3 teams. Pilot teams see 25% reduction in lead time, 20% more deployments, and 10–15% fewer production incidents. Financial impact: faster feature delivery yields estimated competitive advantage versus <$100K annual spend.

These outcomes only materialized where leaders treated Copilot as an experiment with measurement—not “flip the switch and hope.”

Common pitfalls when measuring Copilot ROI

Poor measurement can make Copilot look useless—or magical—when reality is nuanced.

  • Only tracking AI usage without delivery outcomes: Pair every adoption metric with a DORA metric. DORA metrics are industry-standard measures of software delivery performance, including lead time, deployment frequency, change failure rate, and mean time to recovery (MTTR).
  • Comparing greenfield vs legacy projects: Cohort-stratify by project type and maturity.
  • Ignoring process changes introduced alongside Copilot: Use control groups and document all changes.
  • Overestimating time savings without data: Validate with actual PR timestamps, not vendor claims.
  • Failing to distinguish AI-assisted work: Tag systematically using Copilot attribution or labels.
  • Using metrics to surveil individuals: Focus on team-level metrics; communicate transparently.

Typo’s dashboards are intentionally team- and cohort-focused to avoid surveillance concerns and encourage widespread adoption.

How Typo measures GitHub Copilot ROI end-to-end

Typo is an engineering intelligence platform purpose-built to answer “Is our AI coding stack actually helping?” for GitHub Copilot, Cursor, and Claude Code, grounded in a mission to redefine engineering intelligence for modern software teams.

Data Sources (Connects in ~60 Seconds)

  • GitHub/GitLab/Bitbucket for commits and PRs
  • GitHub Copilot and other AI tools for usage and attribution
  • Jira/Linear for issue and cycle-time context
  • CI/CD for deployments and incidents

Copilot ROI Views in Typo

  • Side-by-side trends for AI-assisted vs non-AI PRs (cycle time, review count, rework)
  • Team-level adoption cohorts and DORA metrics evolution
  • Correlation of AI assistance with deployment frequency and change failure rate

Typo’s automated AI code review layer complements Copilot by catching risky AI-generated code patterns before merge—reducing the churn that GitClear data warns about and leveraging AI-powered PR summaries for efficient reviews to keep feedback fast and focused. Connect Typo to your GitHub org and run a 30–60 day Copilot ROI experiment using prebuilt dashboards.

Putting it all together: your next 30 days with Copilot ROI

Copilot has real, measurable ROI—but only if you baseline, instrument, and analyze with the right productivity metrics.

Week 1

Connect GitHub/Jira/CI to Typo and freeze your baseline. Capture quantitative metrics and run an initial DevEx survey for qualitative feedback.

Week 2

Enable Copilot for 1–2 pilot programs, run enablement sessions, and start tagging AI-influenced work. Set realistic expectations with teams working on the pilot.

Week 3

Monitor PR cycle time, lead time, and early quality signals. Identify optimization opportunities in existing workflows and development cycles.

Week 4

Run a quick DevEx survey and produce a preliminary ROI snapshot for leadership using data driven insights.

Report Copilot ROI using DORA and DevEx language—lead time, change failure rate, developer satisfaction—not “lines of code” or “suggestions accepted.” This enables continuous improvement and seamless integration with your digital transformation initiatives.

Ready to see your actual Copilot impact quantified with real SDLC data? Start a free Typo trial or book a demo to measure your GitHub Copilot ROI in 60 seconds—not 60 days.

linearb-alternatives

Top 10 LinearB Alternatives for Streamlined Engineering Management

Engineering leaders evaluating LinearB alternatives in 2026 face a fundamentally different landscape than two years ago. The rise of AI coding tools like GitHub Copilot, Cursor, and Claude Code has transformed how engineering teams write and review code—yet most engineering analytics platforms haven’t kept pace with measuring what matters most: actual AI impact on delivery speed and code quality.

Note: LinearB should not be confused with Linear, which is a project management tool often used as a faster alternative to Jira.

This guide covers the top LinearB alternatives for VPs of Engineering, CTOs, and engineering managers at mid-market SaaS companies who need more than traditional DORA metrics. We focus specifically on platforms that address LinearB’s core gaps: native AI impact measurement, automated code review capabilities, and simplified setup processes. Enterprise-focused platforms requiring months of implementation fall outside our primary scope, though we include them for context.

The direct answer: The best LinearB alternatives combine SDLC visibility with AI impact measurement and AI powered code review capabilities that LinearB currently lacks. Platforms like Typo deliver automated code review on every pull request while tracking GitHub Copilot ROI with verified data—capabilities LinearB offers only partially.

By the end of this guide, you’ll understand:

  • Why LinearB’s limitations matter for AI-native engineering teams
  • How 8 leading alternatives compare on AI capabilities, setup complexity, and pricing
  • Which platform fits your specific workflow automation and engineering metrics needs
  • Practical steps for migrating from LinearB without losing historical data

Understanding LinearB and Its Core Limitations

Note: LinearB should not be confused with Linear, which is a project management tool often used as a faster alternative to Jira.

LinearB positions itself as a software engineering intelligence platform focused on SDLC visibility, workflow automation, and DORA metrics like deployment frequency, cycle time, and lead time. The platform integrates with Git repositories, CI/CD pipelines, and project management tools to expose bottlenecks in pull requests and delivery flows. For engineering teams seeking basic delivery analytics, LinearB delivers solid DORA metrics and PR workflow automation through GitStream.

However, LinearB’s architecture reflects an era before AI coding tools became central to the software development process. Three specific limitations now create friction for AI-native engineering teams.

LinearB’s Missing AI Impact Measurement

LinearB tracks traditional engineering metrics effectively—deployment frequency, cycle time, change failure rate—but lacks native AI coding tool impact measurement. While LinearB has introduced dashboards showing Copilot and Cursor usage, the tracking remains surface-level: license adoption and broad cycle time correlations rather than granular attribution.

Recent analysis of LinearB’s own data reveals the problem clearly. A study of 8.1 million pull requests from 4,800 teams found AI-generated PRs wait 4.6x longer in review queues, with 10.83 issues per AI PR versus 6.45 for manual PRs. Acceptance rates dropped from 84.4% for human code to 32.7% for AI-assisted code. These findings suggest AI speed gains may be cancelled by verification costs—exactly the kind of insight teams need, but LinearB’s current metrics don’t capture this nuance.

For engineering leaders asking “What’s our GitHub Copilot ROI?” or “Is AI code increasing our delivery risks?”, LinearB provides estimates rather than verified engineering data connecting AI usage to business outcomes.

Complex Setup and Learning Curve

G2 reviews consistently highlight LinearB’s steep learning curve. Teams report multi-week onboarding processes for organizations with many repositories, complex CI/CD pipelines, or non-standard branching workflows. Historical data import challenges and dashboard configuration complexity add friction.

This contrasts sharply with modern alternatives offering 60-second setup. For mid-market SaaS companies without dedicated platform teams, weeks of configuration work represents real engineering effort diverted from product development.

Limited Automated Code Review Capabilities

LinearB introduced AI-powered code review features including auto-generated PR descriptions, context-aware suggestions, and reviewer assignment through GitStream. However, these capabilities complement workflow automation rather than replace deep code analysis.

Missing from LinearB’s offering: merge confidence scoring, scope drift detection (identifying when code changes solve the wrong problem), and context-aware reasoning that considers codebase history. For teams where AI-generated code comprises 30-40% of pull requests, this gap creates review bottlenecks that offset AI productivity gains.

Essential Features in Modern LinearB Alternatives

Given LinearB’s gaps, what should engineering managers prioritize when evaluating alternatives? Three capability areas separate platforms built for 2026 from those designed for 2020.

AI Impact Measurement and Analytics

Modern engineering intelligence platforms must track AI coding tool impact beyond license counts. Essential capabilities include:

  • Per-PR attribution: Distinguishing AI-assisted versus human-written code at the pull request level
  • Quality correlation: Connecting AI usage to defect rates, test coverage, and production incidents
  • Review queue analysis: Measuring whether AI PRs create bottlenecks despite faster initial development
  • Verified ROI data: Providing concrete numbers for “AI tools saved X hours” claims rather than estimates

This engineering data enables informed decisions about AI tool investments and identifies where human review processes need adjustment.

Automated Code Review with Context Awareness

AI powered code review has evolved beyond syntax checking. Leading platforms now offer:

  • LLM-powered reasoning: Understanding intent from linked issues and detecting scope drift
  • Merge confidence scoring: Quantifying PR risk based on complexity, test coverage, and historical patterns
  • Multi-context analysis: Examining cross-repository dependencies and architectural compliance
  • Actionable suggestions: Providing specific fixes rather than generic warnings

These capabilities address the verification bottleneck revealed in AI PR data—where faster writing means slower reviewing without intelligent automation.

Simplified Setup and Integration

Setup complexity directly impacts time to value. Modern alternatives provide:

  • 60-second onboarding: Git-native connection without weeks of configuration
  • Pre-built dashboards: Immediate access to DORA metrics and delivery insights without manual setup
  • One-click integrations: Native support for GitHub, GitLab, Jira, and common CI/CD tools
  • API-first architecture: Clean data export and integration with existing tools

Top 8 LinearB Alternatives Detailed Comparison

The following analysis evaluates each platform against criteria most relevant for AI-native engineering teams: AI capabilities, setup speed, DORA metrics support, and pricing transparency.

Top alternatives to LinearB for software development analytics include Jellyfish, Swarmia, Waydev, and Allstacks.

Platform Analysis and Scoring

1. Typo

Typo operates as an AI-native engineering management platform built specifically for teams using AI coding tools. The platform combines delivery analytics with automated code review on every pull request, using LLM-powered analysis to provide reasoning-based feedback rather than pattern matching.

Key differentiators include native GitHub Copilot ROI measurement with verified data, merge confidence scoring for delivery risk detection, and 60-second setup. Typo has processed 15M+ pull requests across 1,000+ engineering teams, earning G2 Leader status with 100+ reviews as an AI-driven engineering intelligence platform.

For teams where AI impact measurement and code review automation are primary requirements, Typo addresses LinearB’s core gaps directly.

2. Swarmia

Swarmia focuses on developer experience alongside delivery metrics, combining DORA metrics with DevEx surveys and team agreements, though several Swarmia alternatives offer broader AI-focused analytics. The platform emphasizes research-backed metrics rather than overwhelming teams with every possible measurement.

Strengths include clean dashboards, real-time Slack integrations, and faster setup (hours versus days). However, Swarmia provides limited AI impact tracking and no automated code review—teams still need separate tools for AI powered code review capabilities.

Best for: Teams prioritizing developer workflow optimization and team health measurement over AI-specific analytics, though some organizations will prefer a Swarmia alternative with deeper automation.

3. Jellyfish

Jellyfish serves enterprise organizations needing engineering visibility tied to business strategy, and there is now a growing ecosystem of Jellyfish alternatives for engineering leaders. The platform excels at resource allocation, capacity planning, R&D capitalization, and aligning engineering effort with business priorities.

The trade-off: Jellyfish requires significant implementation time—often 6-9 months to full ROI per published comparisons. Pricing reflects enterprise positioning with custom contracts typically exceeding $100,000 annually.

Best for: Large organizations needing financial data integration and executive-level strategic planning capabilities.

4. DX (getdx.com)

DX specializes in developer experience measurement using the DX Core 4 framework. The platform combines survey instruments with system metrics to understand morale, burnout, and workflow friction.

DX provides valuable insights into developer productivity factors but lacks delivery analytics, code review automation, or AI impact tracking. Teams typically use DX alongside other engineering analytics tools rather than as a standalone solution, especially when implementing broader developer experience (DX) improvement strategies.

Best for: Organizations with mature engineering operations seeking to improve team efficiency through DevEx insights.

5. Haystack

Haystack offers lightweight, Git-native engineering metrics with minimal configuration, sitting alongside a broader set of Waydev and similar alternatives in the engineering analytics space. The platform delivers DORA metrics, PR bottleneck identification, and sprint summaries without enterprise complexity.

Setup takes hours rather than weeks, making Haystack attractive for smaller teams wanting quick delivery performance visibility. However, the platform lacks AI code review features and provides basic AI impact tracking at best.

Best for: Smaller engineering teams needing fast delivery insights without comprehensive AI capabilities.

6. Waydev

Waydev provides Git analytics with individual developer insights and industry benchmarks and is frequently evaluated in lists of top LinearB alternative platforms. The platform tracks code contributions, PR patterns, and identifies skill gaps across engineering teams.

Critics note Waydev’s focus on individual metrics can create surveillance concerns. The platform offers limited workflow automation and no AI powered code review capabilities.

Best for: Organizations comfortable with individual contributor tracking and needing benchmark comparisons.

7. Allstacks

Allstacks positions itself as a value stream intelligence platform with predictive analytics and delivery forecasting, often compared against Intelligent LinearB alternatives like Typo. The platform helps teams identify bottlenecks across the value stream and predict delivery risks before they impact schedules.

Setup complexity and enterprise pricing limit Allstacks’ accessibility for mid-market teams. AI impact measurement remains basic.

Best for: Larger organizations needing predictive risk detection and value stream mapping across multiple products.

8. Pluralsight Flow

Pluralsight Flow combines engineering metrics with skill tracking and learning recommendations. The platform links identified skill gaps to Pluralsight’s training content, creating a development-to-learning feedback loop and is also frequently listed among Waydev competitor tools.

The integration with Pluralsight’s learning platform provides unique value for organizations invested in developer skill development. However, Flow provides no automated code review and limited AI impact tracking.

Best for: Organizations using Pluralsight for training who want integrated skill gap analysis, while teams focused on broader engineering performance may compare it with reasons companies choose Typo instead.

Feature Comparison Matrix

Platform AI Impact Tracking Automated Code Review Setup Time DORA Metrics Starting Price
Typo Yes (Native) Yes (LLM-powered) 60 seconds Yes Contact for pricing
Swarmia Limited No Few hours Yes $39/developer/month
Jellyfish Basic No Several weeks Yes Custom pricing
DX No No Few hours Limited $39/developer/month
Haystack Basic No Few hours Yes Contact for pricing
Waydev Limited No Few days Yes Custom pricing
Allstacks Basic No Several days Yes Custom pricing
Pluralsight Flow No No Few days Yes Custom pricing
LinearB Basic Limited Several days Yes $19–59/developer/month

Interpretation: For AI-native engineering teams, the key differentiators are native AI impact tracking and automated code review. Only Typo currently delivers both capabilities with fast setup. Swarmia and Haystack offer simpler alternatives if AI measurement isn’t critical. Jellyfish and Allstacks serve enterprise needs requiring comprehensive insights and business alignment at higher cost and implementation complexity.

Common Migration Challenges and Solutions

Data Migration and Historical Metrics

Challenge: Teams want to retain baseline engineering metrics covering previous quarters for trend analysis and comparison.

Solution: Choose platforms with API import capabilities and dedicated migration support. Typo’s architecture, having processed 15M+ pull requests across 2M+ repositories, demonstrates capability to handle historical data at scale. Request a migration timeline and data mapping documentation before committing. Most platforms can import GitHub/GitLab historical data directly, though Jira integration may require additional configuration.

Team Adoption and Change Management

Challenge: Engineering teams resist new tools, especially if previous implementations required significant configuration effort.

Solution: Prioritize platforms offering intuitive interfaces and dramatically faster setup. The difference between 60-second onboarding and multi-week implementation directly impacts adoption friction. Choose platforms that provide immediate team insights without requiring teams to build custom dashboards first.

Present the switch as addressing specific pain points (like “we can finally measure our Copilot ROI” or “automated code review on every PR”) rather than as generic tooling change.

Integration Complexity with Existing Tools

Challenge: Engineering teams rely on specific GitHub/GitLab configurations, Jira workflows, and CI/CD pipelines that previous tools struggled to accommodate.

Solution: Verify one-click integrations with your specific toolchain before evaluation. Modern platforms should connect to existing tools without requiring workflow changes. Ask vendors specifically about your branching strategy, monorepo setup (if applicable), and any non-standard configurations.

Conclusion and Next Steps

LinearB delivered solid DORA metrics and workflow automation for its era, but lacks the native AI impact measurement and automated code review capabilities that AI-native engineering teams now require. The 4.6x longer review queue times for AI-generated PRs—revealed in LinearB’s own data—demonstrate why teams need platforms that address AI coding tool verification, not just adoption tracking.

  • Audit your AI coding tool usage
    • Calculate what percentage of pull requests involve AI-generated code. If above 25%, AI impact measurement becomes critical for understanding actual delivery speed.
  • Compare setup complexity
    • Evaluate 60-second platforms like Typo against multi-day implementations. Engineering effort spent on tool configuration is effort not spent on product development.
  • Test AI-native features
    • Request demonstrations specifically showing automated code review with merge confidence scoring and AI impact analytics with verified data rather than estimates.
  • Verify proof points
    • Look for platforms with established track records—Typo’s 1,000+ engineering teams, 100+ G2 reviews, and 15M+ PRs processed demonstrate production-grade capability. Compare against alternatives with similar scale evidence.

The Essential Guide to Effective Software Performance Measurement

Software performance measurement has become the backbone of modern engineering organizations. Achieving high performance is a key goal of software performance measurement, as it enables teams to optimize processes and deliver superior results. As teams ship faster and systems grow more complex, understanding how software behaves in production—and how effectively it’s built—separates high-performing teams from those constantly firefighting.

This guide is intended for engineering leaders, software developers, and technical managers seeking to improve software performance measurement practices in software development. Effective performance measurement is critical for delivering reliable, scalable, and high-quality software products.

This guide explores the full landscape of performance measurement, from runtime metrics that reveal user experience to delivery signals that drive engineering velocity. APM metrics are key indicators that help business-critical applications achieve peak performance, ensuring that organizations can maintain reliability and efficiency at scale.

Key Takeaways

  • Software performance measurement spans two critical dimensions: runtime behavior (APM-style metrics like latency, errors, and throughput) and delivery behavior (DORA metrics and engineering productivity signals). Both DORA and APM metrics are used to measure performance across runtime and delivery, and understanding both is essential for complete visibility.
  • Modern development teams combine DORA metrics, application performance metrics, and engineering intelligence platforms like Typo to connect code changes with production outcomes.
  • More metrics isn’t the goal. Selecting the right metrics—a focused, actionable set that includes the most important metric for your organization, typically DORA plus 5–10 APM metrics plus a few DevEx signals—drives real improvement in reliability, speed, and developer experience.
  • Implementation requires integrating tools like GitHub/GitLab, Jira, and CI/CD pipelines with platforms that automate data collection and provide real-time engineering dashboards.
  • Typo helps engineering leaders move beyond vanity metrics to get actionable performance measurements that link code changes, AI coding tools, and delivery outcomes in a single view.

What Is Software Performance Measurement?

Software performance measurement systematically tracks how a software application behaves in production and how effectively it’s built and delivered. It evaluates speed, stability, and scalability at runtime, alongside cycle time, deployment frequency, and code quality on the delivery side.

This practice covers two main areas. First, application-level performance monitored by traditional tools: response times, CPU usage, error rates, memory usage, throughput, request rates, concurrent users, uptime, database lock time, and the Apdex score measuring user satisfaction. Monitoring these metrics helps maintain a positive end user experience by preventing issues that degrade satisfaction or disrupt service. Second, delivery-level performance focuses on how quickly and safely code moves from commit to production, measured through DORA metrics and developer experience indicators.

Since around 2010, performance measurement has shifted from manual checks to continuous, automated monitoring using telemetry from logs, traces, metrics, and SDLC tools. Organizations now combine application and delivery metrics for full visibility. Typo specializes in consolidating delivery data to complement traditional APM tools.

Performance evaluation is essential for identifying bottlenecks, ensuring scalability, and improving user experience before deployment.

Why Software Performance Measurement Matters

Consider a typical SaaS scenario: a checkout flow that suddenly slows by 300 milliseconds. Users don’t see the metrics—they just feel the friction and leave. Meanwhile, the engineering team can’t pinpoint whether the issue stems from a recent deployment, a database bottleneck, or infrastructure strain. Without proper measurement, this becomes a recurring mystery.

Business Impact of Application Performance

Application performance directly affects business outcomes in measurable ways. A 200ms increase in page load time can reduce conversion rates in e-commerce by meaningful percentages. Research consistently shows that 53% of mobile users abandon sites that take longer than 3 seconds to load. High memory usage during peak traffic can cause cascading failures that breach SLAs and damage customer trust.

Latency, availability, and error rates aren’t abstract technical concerns—they translate directly to revenue, churn, and customer satisfaction. When web requests slow down, users notice. When errors spike, support tickets follow.

Delivery Performance and Innovation

Delivery performance metrics like those tracked in DORA metrics reveal how quickly teams can respond to market demands. Organizations with faster, safer deployments run more experiments, gather feedback sooner, and maintain competitive advantage. Elite performers achieve multiple deployments per day with lead time for changes measured in hours rather than weeks.

This speed isn’t reckless. The best teams ship fast and maintain stability because they measure both dimensions. They identify bottlenecks before they become blockers and catch regressions before they reach users.

Risk Management and Reliability

Objective metrics enable early detection of problems. Rather than discovering issues through customer complaints, teams with proper measurement see anomalies in real-time. This supports SRE practices, post-incident reviews, and proactive infrastructure scaling.

When you can track application errors as they emerge—not after they’ve affected thousands of users—you transform incident management from reactive scrambling to systematic improvement.

Cultural Impact

Transparent, well-designed metrics foster trust across product, engineering, and operations teams. When everyone can see the same data, discussions move from blame to problem-solving. The key is using metrics for continuous improvement rather than punishment—focusing on systems and processes, not individual developer surveillance.

Core Dimensions of Software Performance

Performance measurement typically spans three interconnected dimensions: runtime behavior, delivery performance, and developer experience.

Developer experience captures the ease and satisfaction of creating and shipping software—tooling friction, cognitive load, time lost in reviews, and test reliability.

Typo bridges these dimensions on the delivery side, measuring engineering throughput, quality signals, and DevEx indicators while integrating outcomes from production where relevant.

Application Performance Metrics (Runtime Behavior)

Runtime metrics are collected through APM and observability tools, forming the foundation for SRE, operations, and backend teams to understand system health. These metrics answer the fundamental question: what do users actually experience? Request rates are a vital metric for monitoring application traffic, helping to identify traffic spikes and detect anomalies such as potential cybersecurity threats or load capacity issues. Additionally, database queries provide an overview of the total number of queries executed within the applications and services, indicating potential performance issues.

Key Metric Definitions

Below are brief definitions for the key software performance metrics, ensuring clarity for all readers:

  • Response time: The time taken for a system to respond to a user request. The average response time is calculated by averaging the response times for all requests over a given time period.
  • Throughput: The number of requests or transactions a system can handle per second.
  • Error rate: The percentage of errors observed in the application, calculated as the number of requests that have errors compared to the total number of requests in a given time frame.
  • Uptime: A measure of the availability of the applications and services to the end users, usually indicated by a percentage value.
  • CPU usage: The amount of CPU processing power in instances or computer applications, measured by percentage values.
  • Memory usage: Indicates high resource consumption in the server and can adversely affect application performance and scalability.
  • Database lock time: The time spent waiting for database locks, which affects responsiveness.
  • Apdex score: A standard measure of how satisfied end-users are with a particular web application and its service response time.

Request and Transaction Metrics

Key categories include:

  • Request and transaction metrics: rates, latency, throughput

Monitoring the number of requests an application receives is essential to assess performance, detect traffic spikes, and determine scalability needs. Tracking concurrent users helps you understand traffic patterns and plan for scalability, as the number of users simultaneously active can impact system resources. It's also important to monitor how the application performs under different loads, focusing on requests per minute and data throughput during each request to assess server performance and capacity. Request rate and throughput indicate load patterns—requests per second or transactions per second reveal weekday peaks, seasonal spikes, and capacity limits. High throughput, defined as the application's ability to handle a large number of requests or transactions within a specific time frame, is crucial for performance and scalability under varying loads. When your web application handles 10,000 requests per second during normal operation but receives 25,000 during a flash sale, you need visibility into how the system responds. Load testing evaluates how the system behaves under normal and peak loads, while endurance testing checks system performance over an extended period to identify memory leaks.

Average response time and latency remain critical indicators, but relying solely on averages masks important patterns. Achieving low average response time leads to better performance and improved user experience. Common targets include under 100ms for API calls and under 2 seconds for full page loads. Percentiles matter more: p95 tells you what 95% of users experience, while p99 reveals the worst-case scenarios that often drive complaints.

For example, an API might show 50ms average response time while p99 sits at 800ms—meaning 1% of users face significantly degraded experience.

Apdex score (Application Performance Index) provides a 0–1 scale measuring user satisfaction. With a threshold T of 500ms:

  • Responses under 500ms = Satisfied
  • Responses between 500ms and 2000ms = Tolerating
  • Responses over 2000ms = Frustrated

An Apdex of 0.85 indicates generally good performance with room for improvement on slower requests.

Reliability Metrics

  • Reliability metrics: error rate, uptime, Apdex

Error rate—failed requests divided by total requests—should stay low for critical paths. The industry standard for production systems often targets keeping 5xx errors under 1% of total traffic, with stricter thresholds for checkout or authentication flows.

Uptime and availability translate directly to user trust:

SLA Monthly Uptime Allowed Downtime
99.9% ~43 minutes ~10 minutes per week
99.99% ~4.3 minutes ~1 minute per week
99.999% ~26 seconds ~5 seconds per week

Understanding the difference between 99.9% and 99.99% helps teams make informed tradeoffs between investment in reliability and business requirements.

Common error categories include application errors, timeouts, 4xx client errors, and 5xx server errors. Correlating error spikes with specific deployments or infrastructure changes helps teams quickly identify root causes. When logged errors suddenly increase after a release, the connection becomes actionable intelligence.

These reliability metrics tie into SLAs and SLOs that most companies have maintained since around 2016, forming the basis for incident management processes and customer commitments.

Infrastructure Metrics

  • Infrastructure metrics: CPU usage, memory usage, instance count, database queries, garbage collection behavior

CPU usage directly impacts responsiveness. Sustained CPU above 70% signals potential bottlenecks and often triggers autoscaling policies in AWS, GCP, or Azure environments. When CPU spikes during normal traffic patterns, inefficient code paths usually deserve investigation.

Memory usage (heap, RSS, page faults) and garbage collection metrics reveal different classes of problems. Memory leaks cause gradual degradation that manifests as crashes or slowdowns during extended operation. GC pauses in Java or .NET applications can cause latency spikes that frustrate users even when average response times look acceptable. High memory usage combined with insufficient memory allocation leads to out-of-memory errors that crash application instances.

Instance count and node availability indicate system capacity and resiliency. In Kubernetes-based architectures common since 2017, tracking pod health, node availability, and container restarts provides early warning of infrastructure issues.

Database-specific metrics often become the bottleneck as applications scale:

  • Query latency (average and p99)
  • Slow query counts
  • Connection pool saturation
  • Lock contention (database lock time affects responsiveness by measuring time spent waiting for database locks)
Symptom Metric Pattern Likely Cause
Slow responses, normal traffic High CPU Inefficient code
Gradual degradation Rising memory Memory leaks
Intermittent timeouts Connection pool exhaustion Database bottleneck
Spiky latency GC pauses Memory pressure

Delivery Performance Metrics (DORA & Beyond)

Research programs like DevOps Research and Assessment (DORA) established since the mid-2010s have identified key metrics that correlate with software delivery success. Performance measurement and benchmarks are essential for effective software development, as they help track the efficiency, productivity, and scalability of the development process. These metrics have become the industry standard for measuring delivery performance.

Companies that have visibility into development performance are most likely to win markets.

DORA Metrics Overview

The classic DORA metrics include:

  1. Deployment frequency: How often code reaches production
  2. Lead time for changes: Time from commit to production
  3. Change failure rate: Percentage of deployments causing incidents
  4. Time to restore service: How quickly teams recover from failures
  5. Reliability: The operational performance of the system

These metrics are widely used to measure performance in software delivery, helping organizations assess team progress, prioritize improvements, and predict organizational success.

These split conceptually into throughput (how much change you ship) and stability (how safe those changes are). Elite teams consistently score well on both—fast delivery and high reliability reinforce each other rather than compete.

Typo automatically computes DORA-style signals from Git, CI, and incident systems, providing real-time dashboards that engineering leaders can use to track progress and identify improvement opportunities.

Throughput: How Fast You Deliver

Deployment frequency measures production releases per time period—per day, week, or month. High-performing teams often release multiple times per day, while lower performers might deploy monthly. This metric reveals organizational capacity for change.

Lead time for changes tracks elapsed time from code committed (or pull request opened) to successfully running in production. This breaks down into stages:

  • Coding time
  • Review waiting time
  • Active review time
  • CI/CD pipeline time
  • Deployment time

A team might reduce average lead time from 3 days to 12 hours by improving CI pipelines, automating approvals, and reducing PR queue depth. This real value comes from identifying which stage consumes the most time.

Typo surfaces throughput metrics at team, service, and repository levels, making it clear where bottlenecks occur. Is the delay in slow code reviews? Flaky tests? Manual deployment gates? The data reveals the answer.

Instability: How Safely You Deliver

Change failure rate measures the proportion of deployments that lead to incidents, rollbacks, or hotfixes. Elite performers maintain rates under 15%, while lower performers often exceed 46%. This metric reveals whether speed comes at the cost of stability.

Mean time to restore (MTTR) tracks average recovery time from production issues. Strong observability and rollback mechanisms reduce MTTR from days to minutes. Teams with automated canary releases and feature flags can detect and revert problematic changes before they affect more than a small percentage of users.

Typo can correlate Git-level events (merges, PRs) with incident and APM data to highlight risky code changes and fragile components. When a particular service consistently shows higher failure rates after changes, the pattern becomes visible in the data.

For example, a team might see their change failure rate drop from 18% to 8% after adopting feature flags and improving code review practices—measurable improvement tied to specific process changes.

Engineering Productivity & Developer Experience Metrics

Beyond DORA and APM, engineering leaders need visibility into how effectively engineers turn time into valuable changes and how healthy the overall developer experience remains.

Key Productivity Signals

Key productivity signals include:

  • Cycle time decomposition: Coding, review, waiting, deployment stages
  • Pull request size and review latency: Large PRs create review bottlenecks
  • Net new value vs. rework: How much effort goes to forward progress vs. fixing previous work

Developer Experience (DevEx) Metrics

Developer experience (DevEx) metrics capture friction points:

  • Time lost to flaky tests
  • Tool integration issues
  • Context switching frequency
  • Build and deploy wait times

Typo blends objective SDLC telemetry with lightweight, periodic developer surveys to give leaders a grounded view of productivity and experience without resorting to surveillance-style tracking.

Cycle Time and Pull Request Analytics

End-to-end cycle time measures total duration from first commit on a task to production deployment. Breaking this into segments reveals where time actually goes:

Stage What It Measures Common Bottlenecks
Coding Active development time Unclear requirements, complex changes
PR Waiting Time until review starts Reviewer availability, queue depth
PR Review Active review time Large PRs, multiple review rounds
CI Build and test execution time Slow tests, flaky pipelines
Deployment Release process duration Manual gates, deployment windows

Long review queues, large PRs, and flaky tests typically dominate cycle time across teams from small startups to enterprises. A team might discover that 60% of their cycle time is spent waiting for reviews—a problem with clear solutions.

Useful PR-level metrics include:

  • Median lines of code changed (smaller is usually better)
  • Review depth (comments per PR)
  • Number of review rounds
  • Comment resolution time

Typo’s pull request analysis and AI-based code reviews flag oversized or risky changes early, recommending smaller, safer units of work.

Before/after example: A team enforcing a 400-line PR limit and 4-hour review SLA reduced median cycle time from 5 days to 1.5 days within a single quarter.

Code Quality and AI Code Impact

Code quality metrics relevant to performance include:

  • Defect density: Defects per thousand lines of code (target: under 1 for mature codebases)
  • Escaped defects: Bugs found in production vs. testing
  • Security vulnerabilities: CVEs and security issues
  • Hotspots: Components with frequent changes and incidents

The growing impact of AI coding tools like GitHub Copilot, Cursor, and Claude Code has added a new dimension. Teams need to measure both benefits and risks of AI-assisted development. Does AI-generated code introduce more bugs? Does it speed up initial development but slow down reviews?

Typo can differentiate AI-assisted code from manually written code, allowing teams to assess its effect on review load, bug introduction rates, and delivery speed. This data helps organizations make informed decisions about AI tool adoption and training needs.

Implementing a Software Performance Measurement Strategy

Measurement should follow a clear strategy aligned with business goals, not just a random collection of dashboards. The goal is actionable insights, not impressive-looking charts.

Defining Objectives

  1. Define objectives: What business outcomes matter? Faster releases? Fewer incidents? Better user experience?

Choosing Metrics

  1. Choose a limited metric set: Start with 10-20 metrics maximum

Connecting Data Sources

  1. Connect data sources: Integrate existing tools

Building Dashboards

  1. Build dashboards: Create views that answer specific questions

Creating Feedback Loops

  1. Create feedback loops: Review metrics regularly with teams

Typo simplifies this process by consolidating SDLC data into a single platform, providing out-of-the-box views for DORA, cycle time, and DevEx. Engineering leaders can Start a Free Trial or Book a Demo to see how unified visibility works in practice.

Selecting Metrics That Matter

Map business goals to a small set of performance metrics:

Business Goal Relevant Metrics
Reduce customer churn Error rates, response times, uptime
Ship features faster Lead time, deployment frequency, cycle time
Improve reliability Change failure rate, MTTR, incident count
Scale engineering Productivity per team, onboarding time

A practical baseline set includes:

  • APM: Latency (p95, p99), error rate, uptime
  • DORA: All four/five core metrics
  • Engineering productivity: Cycle time, PR metrics, review latency
  • DevEx: Developer satisfaction, friction points

Avoid vanity metrics like total lines of code or raw commit counts—these correlate poorly with value delivered. A developer who deletes 500 lines of unnecessary code might contribute more than one who adds 1,000 lines of bloat.

Revisit your metric set at least twice yearly to adjust for organizational changes. Report metrics per service, team, or product area to preserve context and avoid misleading blended numbers.

Practical Integration Steps

To connect your tools and automate data collection, follow these steps:

  1. Git providers: Connect GitHub, GitLab, or Bitbucket for commit and PR data
  2. Issue trackers: Link Jira or Azure DevOps for ticket flow
  3. CI/CD systems: Integrate Jenkins, GitHub Actions, or CircleCI for build and deployment data
  4. Incident management: Connect PagerDuty or Opsgenie for failure data

Automation is essential: Metrics should be gathered passively and continuously with every commit, build, and deployment—not via manual spreadsheets or inconsistent reporting. When data collection requires effort, data quality suffers.

Typo’s integrations reduce setup time by automatically inferring repositories, teams, and workflows from existing data. Most organizations can achieve full SDLC visibility within days rather than months.

For enterprise environments, ensure secure access control and data governance. Compliance requirements often dictate who can see which metrics and how data is retained.

Creating Feedback Loops and Continuous Improvement

Metrics only drive improvement when regularly reviewed in team ceremonies:

  • Weekly engineering reviews: Check throughput and stability trends
  • Sprint retrospectives: Discuss cycle time and blockers
  • Quarterly planning: Use data to prioritize infrastructure investments

Use metrics to generate hypotheses and experiments rather than rank individuals. “What happens if we enforce smaller PRs?” becomes a testable question. “Why did cycle time increase this sprint?” opens productive discussion.

Typo surfaces trends and anomalies over time, helping teams verify whether process changes actually improve performance. When a team adopts trunk-based development, they can measure the impact on lead time and stability directly.

A healthy measurement loop:

  1. ✅ Observe current metrics
  2. ✅ Discuss patterns and anomalies
  3. ✅ Form improvement hypotheses
  4. ✅ Implement changes
  5. ✅ Measure results
  6. ✅ Repeat

Pair quantitative data with qualitative insights from developers to understand why metrics change. A spike in cycle time might reflect a new architecture, major refactor, or onboarding wave of new developers—context that numbers alone can’t provide.

Common Pitfalls in Software Performance Measurement

Poorly designed measurement initiatives can backfire, creating perverse incentives, mistrust, and misleading conclusions. Understanding common pitfalls helps teams avoid them.

Metric Overload

  • Metric overload: Tracking too many numbers, creating noise rather than signal

Lack of Context

  • Lack of context: Comparing teams without accounting for domain or architecture differences

Misaligned Incentives

  • Misaligned incentives: Optimizing for metrics rather than outcomes

Blending Unrelated Data

  • Blending unrelated data: Aggregating across incompatible contexts

Ignoring the Human Side

  • Ignoring the human side: Forgetting that engineers respond to how metrics are used

Typo’s focus on team- and system-level insights helps avoid the trap of individual developer surveillance, supporting healthy engineering culture.

Misinterpretation and Misuse of Metrics

Specific examples where metrics mislead:

  • Celebrating speed without quality: Higher deployment frequency looks great—until you notice change failure rate rising in parallel. Shipping faster while breaking more isn’t improvement.
  • Meaningless aggregation: Averaging cycle time across a team building greenfield microservices and a team maintaining legacy monolith produces a number that describes neither reality.
  • Speed at the cost of debt: Reducing cycle time by skipping code reviews creates short-term gains and long-term incident spikes.

Pair quantitative metrics with clear definitions, baselines, and documented assumptions. When someone asks “what does this number mean?”, everyone should give the same answer.

Leaders should communicate intent clearly. Teams who understand that metrics aim to improve processes—not judge individuals—engage constructively rather than defensively.

Over-Reliance on a Single Metric or Tool

Treating one metric as the complete picture creates blind spots:

  • DORA alone might show great throughput while missing user-facing latency issues
  • APM alone shows production behavior but not why changes keep breaking things
  • Survey-only DevEx captures perception but not objective friction points

A multi-source approach combining APM, DORA, engineering productivity, and DevEx metrics provides complete visibility. Typo serves as the SDLC analytics layer, complementing APM tools that focus on runtime behavior.

Regular cross-checks matter: verify that improvements in delivery metrics correspond to better business or user outcomes. Better numbers should eventually mean happier customers.

Avoid frequent metric definition changes that break historical comparison, while allowing occasional refinement as organizational understanding matures.

How Typo Helps Measure and Improve Software Performance

AI-powered engineering intelligence platform built for modern software teams using tools like GitHub, GitLab, Jira, and CI/CD pipelines. It addresses the gap between APM tools that monitor production and the delivery processes that create what runs in production.

By consolidating SDLC data, Typo delivers real-time views of delivery performance, code quality, and developer experience. This complements APM tools that focus on runtime behavior, giving engineering leaders complete visibility across both dimensions.

Key Typo capabilities include:

  • SDLC visibility and DORA metrics: Automated calculation from Git, CI, and incident systems
  • AI-assisted code reviews: Augmented reviews that catch issues before merge
  • PR analysis: Surfacing patterns like oversized changes and long-lived branches
  • AI coding tool impact: Measuring effects of Copilot and similar tools
  • Developer experience insights: Combining behavioral data with feedback

Typo is especially suited for engineering leaders—VPs, Directors, and Managers—at mid-market to enterprise software companies who need to align engineering performance with business goals.

Unifying SDLC Metrics and DORA Signals

Typo connects to Git, ticketing, and CI tools to automatically calculate DORA-style metrics at team and service levels. No manual data entry, no spreadsheet wrangling—just continuous measurement from existing workflows.

Cycle time decomposition shows exactly where delays concentrate:

  • Is most time spent in coding or waiting for review?
  • Do CI pipelines consistently add days to delivery?
  • Are deployment gates creating unnecessary queues?

This unified view helps engineering leaders benchmark teams, spot process regressions, and prioritize investments in tooling or automation. When a service shows 3x longer cycle time than similar services, the data drives investigation.

Typo’s focus remains on team-level insights, avoiding individual developer ranking that undermines collaboration and trust.

AI Code Reviews, PR Analytics, and Quality Insights

Typo’s AI-based code review capabilities augment traditional reviews by:

  • Highlighting risky changes likely to cause incidents
  • Identifying performance-sensitive code paths
  • Flagging potential defects before merge
  • Suggesting improvements based on codebase patterns

PR analysis across repositories surfaces trends like oversized changes, long-lived branches, and under-reviewed code. These patterns correlate with higher defect rates and longer recovery times.

Example scenario: An engineering manager notices a service with recurring performance-related bugs. Typo’s dashboards reveal that PRs for this service average 800 lines, undergo only one review round despite complexity, and merge with minimal comment resolution. The data points toward review process gaps, not developer skill issues.

Typo also quantifies the impact of AI coding tools by comparing metrics like review time, rework, and stability between AI-assisted and non-assisted changes—helping teams understand whether AI tooling delivers real value.

Developer Experience and Continuous Improvement

Typo incorporates lightweight developer feedback (periodic surveys) alongside behavioral data like time in review, CI failures, and context switches. This combination reveals systemic friction points:

  • Slow pipelines that waste developer time
  • Complex release processes that create cognitive overhead
  • Unclear ownership boundaries that cause coordination failures

Dashboards designed for recurring ceremonies—weekly engineering reviews, monthly DevEx reviews, quarterly planning—make metrics part of regular decision-making rather than occasional reporting.

Example: A team uses Typo data to justify investment in CI speed improvements, showing that 30% of engineering time is lost to waiting for builds. The business case becomes clear with concrete numbers.

The aim is enabling healthier, more sustainable performance by improving systems and workflows—not surveillance of individual contributors.

FAQ

How many software performance metrics should we track at once?

Most teams do best starting with a focused set of roughly 10–20 metrics across runtime, delivery, and DevEx dimensions. Tracking dozens of loosely related numbers creates noise rather than actionable insights.

A practical split: a handful of APM metrics (latency, error rate, uptime), the core DORA metrics, and a small number of SDLC and DevEx indicators from a platform like Typo. Start narrow and expand only when you’ve demonstrated value from your initial set.

What’s the difference between APM and engineering intelligence platforms like Typo?

APM tools monitor how applications behave in production—response time, CPU, database queries, errors. They answer “what is the system doing right now?”

Engineering intelligence platforms like Typo analyze how teams build and ship software—cycle time, PRs, DORA metrics, developer experience. They answer “how effectively are we delivering changes?”

These are complementary: APM shows user-facing outcomes, Typo shows the delivery processes and code changes that create those outcomes. Together they provide complete visibility.

How do we start measuring performance without disrupting our teams?

Start by integrating existing tools (Git, Jira, CI, APM) into a non-intrusive analytics platform like Typo. Data is collected automatically without adding manual work or changing developer workflows.

Be transparent with teams about goals. Focus on team-level insights and continuous improvement rather than individual tracking. When engineers understand that measurement aims to improve processes rather than judge people, they become collaborators rather than skeptics.

Can software performance metrics be used for individual performance reviews?

This approach is strongly discouraged. Using these metrics to evaluate individual developers encourages gaming, undermines collaboration, and creates perverse incentives. A developer might avoid complex work that could increase their cycle time, even when that work delivers the most value.

Metrics are far more effective when applied at team or system level to improve processes, tooling, and architecture. Focus on making the system better rather than judging individuals.

How long does it usually take to see results from a measurement program?

Teams often see clearer visibility within a few weeks of integrating their tools—the data starts flowing immediately. Measurable improvements in cycle time or incident rates typically emerge over 1–3 quarters as teams identify and address bottlenecks.

Set concrete, time-bound goals (e.g., reduce average lead time by 20% in six months) and use a platform like Typo to track progress. The combination of clear targets and continuous measurement creates accountability and momentum toward improvement.

Top Key Performance Indicators for Software Development Success

Introduction

Key performance indicators in software development are quantifiable measurements that track progress toward strategic objectives and help engineering teams understand how effectively they deliver value. Software development KPIs are quantifiable measurements used to evaluate the success and efficiency of development processes. Unlike vanity metrics that look impressive but provide little actionable insight, software development KPIs connect daily engineering activities to measurable business outcomes. These engineering metrics form the foundation for data driven decisions that improve development processes, reduce costs, and accelerate delivery.

This guide covers essential engineering KPIs including DORA metrics, developer productivity indicators, code quality measurements, and developer experience tracking. The content is designed for engineering managers, development team leads, and technical directors who need systematic approaches to measure and improve team performance. Whether you’re establishing baseline measurements for a growing engineering firm or optimizing metrics for a mature organization, understanding the right engineering KPIs determines whether your measurement efforts drive continuous improvement or create confusion.

Direct answer: Software engineering KPIs are measurable values that track engineering team effectiveness across four dimensions—delivery speed, code quality, developer productivity, and team health—enabling engineering leaders to identify bottlenecks, allocate resources effectively, and align technical work with business goals.

By the end of this guide, you will understand:

  • The fundamental distinction between leading and lagging performance indicators
  • Essential software development KPIs across DORA, productivity, quality, and experience categories
  • Practical implementation strategies for tracking KPIs through automated infrastructure
  • Common measurement pitfalls and how to avoid metric gaming behaviors
  • Benchmark comparisons to assess your engineering team’s performance level

Understanding Software Development KPIs

Key performance indicators in software development are strategic measurements that translate raw engineering data into actionable insights. While your development tools generate thousands of data points—pull requests merged, builds completed, tests passed—KPIs distill this information into indicators that reveal whether your engineering project is moving toward intended outcomes. The distinction matters: not all metrics qualify as KPIs, and tracking the wrong measurements wastes resources while providing false confidence.

Effective software development KPIs help identify bottlenecks, optimize processes, and make data-driven decisions that improve developer experience and productivity.

Effective software engineering KPIs connect engineering activities directly to business objectives. When your engineering team meets deployment targets while maintaining quality thresholds, those KPIs should correlate with customer satisfaction improvements and project revenue growth. This connection between technical execution and business impact is what separates engineering performance metrics from simple activity tracking.

Leading vs Lagging Indicators

Leading indicators predict future performance by measuring activities that influence outcomes before results materialize. Code review velocity, for example, signals how quickly knowledge transfers across team members and how efficiently code moves through your review pipeline. Developer satisfaction scores indicate retention risk and productivity trends before they appear in delivery metrics. These forward-looking measurements give engineering managers time to intervene before problems impact project performance.

Lagging indicators measure past results and confirm whether previous activities produced desired outcomes. Deployment frequency shows how often your engineering team delivered working software to production. Change failure rate reveals the reliability of those deployments. Mean time to recovery demonstrates your team’s incident response effectiveness. These retrospective metrics validate whether your processes actually work.

High performing teams track both types together. Leading indicators enable proactive adjustment, while lagging indicators confirm whether those adjustments produced results. Relying exclusively on lagging indicators means problems surface only after they’ve already impacted customer satisfaction and project costs.

Quantitative vs Qualitative Metrics

Quantitative engineering metrics provide objective, numerical measurements that enable precise tracking and comparison. Cycle time—the duration from first commit to production release—can be measured in hours or days with consistent methodology. Merge frequency tracks how often code integrates into main branches. Deployment frequency counts production releases per day, week, or month. These performance metrics enable benchmark comparisons across teams, projects, and time periods.

Qualitative indicators capture dimensions that numbers alone cannot represent. Developer experience surveys reveal frustration with tooling, processes, or team dynamics that quantitative metrics might miss. Code quality assessments through peer review provide context about maintainability and design decisions. Net promoter score from internal developer surveys indicates overall team health and engagement levels.

Both measurement types contribute essential perspectives. Quantitative metrics establish baselines and track trends with precision. Qualitative metrics explain why those trends exist and whether the numbers reflect actual performance. Understanding this complementary relationship prepares you for systematic KPI implementation across all relevant categories.

Essential Software Development KPI Categories

Four core categories provide comprehensive visibility into engineering performance: delivery metrics (DORA), developer productivity, code quality, and developer experience. Together, these categories measure what your engineering team produces, how efficiently they work, the reliability of their output, and the sustainability of their working environment. Tracking across all categories prevents optimization in one area from creating problems elsewhere.

DORA Metrics

DORA metrics—established by DevOps Research and Assessment—represent the most validated framework for measuring software delivery performance. These four engineering KPIs predict organizational performance and differentiate elite teams from lower performers.

Deployment frequency measures how often your engineering team releases to production. Elite teams deploy multiple times per day, while low performers may deploy monthly or less frequently. High deployment frequency indicates reliable software delivery pipelines, small batch sizes, and confidence in automated testing. This metric directly correlates with on time delivery and ability to respond quickly to customer needs.

Lead time for changes tracks duration from code commit to production deployment. Elite teams achieve lead times under one hour; low performers measure lead times in months. Short lead time indicates streamlined development processes, efficient code review practices, and minimal handoff delays between different stages of delivery.

Change failure rate monitors the percentage of deployments causing production incidents requiring remediation. Elite teams maintain change failure rates below 5%, while struggling teams may see 16-30% or higher. This cost performance indicator reveals the reliability of your testing strategies and deployment practices.

Mean time to recovery (MTTR) measures how quickly your team restores service after production incidents. Elite teams recover in under one hour; low performers may take days or weeks. MTTR reflects incident response preparedness, system observability, and operational expertise across your engineering team.

Developer Productivity Metrics

Productivity metrics help engineering leaders measure how efficiently team members convert effort into delivered value. These engineering performance metrics focus on workflow efficiency rather than raw output volume.

Cycle time tracks duration from first commit to production release for individual changes. Unlike lead time (which measures the full pipeline), cycle time focuses on active development work. Shorter cycle times indicate efficient workflows, minimal waiting periods, and effective collaboration metrics between developers and reviewers.

Pull requests size correlates strongly with review efficiency and merge speed. Smaller pull requests receive faster, more thorough reviews and integrate with fewer conflicts. Teams tracking this metric often implement guidelines encouraging incremental commits that simplify code review processes.

Merge frequency measures how often developers integrate code into shared branches. Higher merge frequency indicates continuous integration practices where work-in-progress stays synchronized with the main codebase. This reduces integration complexity and supports reliable software delivery.

Coding time analysis examines how developers allocate hours across different activities. Understanding the balance between writing new code, reviewing others’ work, handling interruptions, and attending meetings reveals capacity utilization patterns and potential productivity improvements.

Code Quality Indicators

Quality metrics track the reliability and maintainability of code your development team produces. These indicators balance speed metrics to ensure velocity improvements don’t compromise software reliability.

Code coverage percentage measures what proportion of your codebase automated tests validate. While coverage alone doesn’t guarantee test quality, low coverage indicates untested code paths and higher risk of undetected defects. Tracking coverage trends reveals whether testing practices improve alongside codebase growth.

Rework rate monitors how often recently modified code requires additional changes to fix problems. High rework rates for code modified within the last two weeks indicate quality issues in initial development or code review effectiveness. This metric helps identify whether speed improvements create downstream quality costs.

Refactor rate tracks technical debt accumulation through the ratio of refactoring work to new feature development. Engineering teams that defer refactoring accumulate technical debt that eventually slows development velocity. Healthy teams maintain consistent refactoring as part of normal development rather than deferring it indefinitely.

Number of bugs by feature and severity classification provides granular quality visibility. Tracking defects by component reveals problem areas requiring additional attention. Severity classification ensures critical issues receive appropriate priority while minor defects don’t distract from planned work.

Developer Experience Metrics

Experience metrics capture the sustainability and health of your engineering environment. These indicators predict retention, productivity trends, and long-term team performance.

Developer satisfaction surveys conducted regularly reveal frustration points, tooling gaps, and process inefficiencies before they impact delivery metrics. Correlation analysis between satisfaction scores and retention helps engineering leaders understand the actual cost of poor developer experience.

Build and test success rates indicate development environment health. Flaky tests, unreliable builds, and slow feedback loops frustrate developers and slow development processes. Tracking these operational metrics reveals infrastructure investments that improve daily developer productivity.

Tool adoption rates for productivity platforms and AI coding assistants show whether investments in specialized software actually change developer behavior. Low adoption despite available tools often indicates training gaps, poor integration, or misalignment with actual workflow needs.

Knowledge sharing frequency through documentation contributions, code review participation, and internal presentations reflects team dynamics and learning culture. Teams that actively share knowledge distribute expertise broadly and reduce single-point-of-failure risks.

These four categories work together as a balanced measurement system. Optimizing delivery speed without monitoring quality leads to unreliable software. Pushing productivity without tracking experience creates burnout and turnover. Comprehensive measurement across categories enables sustainable engineering performance improvement.

Evaluating Operational Efficiency

Operational efficiency is a cornerstone of high-performing engineering teams, directly impacting the success of the development process and the overall business. By leveraging key performance indicators (KPIs), engineering leaders can gain a clear, data-driven understanding of how well their teams are utilizing resources, delivering value, and maintaining quality throughout the software development lifecycle.

To evaluate operational efficiency, it’s essential to track engineering KPIs that reflect both productivity and quality. Metrics such as cycle time, deployment frequency, and lead time provide a real-time view of how quickly and reliably your team can move from idea to delivery. Monitoring story points completed helps gauge the team’s throughput and capacity, while code coverage and code review frequency offer insights into code quality and the rigor of your development process.

Resource allocation is another critical aspect of operational efficiency. By analyzing project revenue, project costs, and overall financial performance, engineering teams can ensure that their development process is not only effective but also cost-efficient. Tracking these financial KPIs enables informed decisions about where to invest time and resources, ensuring that the actual cost of development aligns with business goals and delivers a strong return on investment.

Customer satisfaction is equally important in evaluating operational efficiency. Metrics such as net promoter score (NPS), project completion rate, and direct customer feedback provide a window into how well your engineering team meets user needs and expectations. High project completion rates and positive NPS scores are strong indicators that your team consistently delivers reliable software in a timely manner, leading to satisfied customers and repeat business.

Code quality should never be overlooked when assessing operational efficiency. Regular code reviews, high code coverage, and a focus on reducing technical debt all contribute to a more maintainable and robust codebase. These practices not only improve the immediate quality of your software but also reduce long-term support costs and average downtime, further enhancing operational efficiency.

Ultimately, the right engineering KPIs empower teams to make data-driven decisions that optimize every stage of the development process. By continuously monitoring and acting on these key performance indicators, engineering leaders can identify bottlenecks, improve resource allocation, and drive continuous improvement. This holistic approach ensures that your engineering team delivers high-quality products efficiently, maximizes project revenue, and maintains strong customer satisfaction—all while keeping project costs under control.

KPI Implementation and Tracking Strategies

Moving from KPI selection to actionable measurement requires infrastructure, processes, and organizational commitment. Implementation success depends on automated data collection, meaningful benchmarks, and clear connections between metrics and improvement actions.

Automated Data Collection

Automated tracking becomes essential when engineering teams scale beyond a handful of developers. Manual metric collection introduces delays, inconsistencies, and measurement overhead that distract from actual development work.

  1. Connect development tools to centralized analytics platforms by integrating Git repositories, issue trackers like Jira, and CI/CD pipelines into unified dashboards. These connections enable automatic data collection without requiring developers to log activities manually.

Establishing Baselines

  1. Establish baseline measurements before implementing changes so you can measure improvement accurately. Baseline metrics reveal your starting position and enable realistic goal-setting based on actual performance rather than aspirational targets.

Real-Time Monitoring

  1. Configure automated data collection from SDLC tools to capture metrics in real-time. Engineering intelligence platforms can pull deployment events, pull request data, build results, and incident information automatically from your existing toolchain.

Alerting and Response

  1. Set up alerting systems for KPI threshold breaches and performance degradation. Proactive alerts enable rapid response when cycle time increases unexpectedly or change failure rates spike, preventing small problems from becoming major delivery issues.

KPI Benchmark Comparison

KPI Performance Benchmarks by Team Maturity Level

Understanding how your engineering team compares to industry benchmarks helps identify improvement priorities and set realistic targets. The following comparison shows performance characteristics across team maturity levels:

KPI Elite Teams High Performers Medium Performers Low Performers
Deployment Frequency Multiple per day Weekly to monthly Monthly to quarterly Less than quarterly
Lead Time for Changes Less than 1 hour 1 day to 1 week 1 week to 1 month 1–6 months
Change Failure Rate 0–5% 5–10% 10–15% 16–30%
Mean Time to Recovery Less than 1 hour Less than 1 day 1 day to 1 week More than 1 week
Cycle Time Less than 1 day 1–3 days 3–7 days More than 1 week

These benchmarks help engineering leaders identify current performance levels and prioritize improvements. Teams performing at medium levels in deployment frequency but low levels in change failure rate should focus on quality improvements before accelerating delivery speed. This contextual interpretation transforms raw benchmark comparison into actionable improvement strategies.

Common Challenges and Solutions

Engineering teams frequently encounter obstacles when implementing KPI tracking that undermine measurement value. Understanding these challenges enables proactive prevention rather than reactive correction.

Metric Gaming and Misalignment

When engineers optimize for measured numbers rather than underlying outcomes, metrics become meaningless. Story points completed may increase while actual cost of delivered features rises. Pull requests may shrink below useful sizes just to improve merge time metrics.

Solution: Focus on outcome-based KPIs rather than activity metrics to prevent gaming behaviors. Measure projects delivered to production with positive feedback rather than story points completed. Implement balanced scorecards combining speed, quality, and developer satisfaction so optimizing one dimension at another’s expense becomes visible. Review metrics holistically rather than celebrating individual KPI improvements in isolation.

Data Fragmentation Across Tools

Engineering teams typically use multiple tools—different repositories, project management platforms, CI/CD systems, and incident management tools. When each tool maintains its own data silo, comprehensive performance visibility becomes impossible without manual aggregation that introduces errors and delays.

Solution: Integrate disparate development tools through engineering intelligence platforms that pull data from multiple sources into unified dashboards. Establish a single source of truth for engineering metrics where conflicting data sources get reconciled rather than existing in parallel. Prioritize integration capability when selecting new tools to prevent further fragmentation.

Lack of Actionable Insights

Teams may track metrics religiously without those measurements driving actual behavior change. Dashboards display numbers that nobody reviews or acts upon. Trends indicate problems that persist because measurement doesn’t connect to improvement processes.

Solution: Connect KPI trends to specific process improvements and team coaching opportunities. When cycle time increases, investigate root causes and implement targeted interventions. Use root cause analysis to identify bottlenecks behind performance metric degradation rather than treating symptoms. Schedule regular metric review sessions where data translates into prioritized improvement initiatives.

Building a continuous improvement culture requires connecting measurement to action. Metrics that don’t influence decisions waste the engineering cost of collection and distract from measurements that could drive meaningful change.

Conclusion and Next Steps

Software development KPIs provide the visibility engineering teams need to improve systematically rather than relying on intuition or anecdote. Effective KPIs connect technical activities to business outcomes, enable informed decisions about resource allocation, and reveal improvement opportunities before they become critical problems. The right metrics track delivery speed, code quality, developer productivity, and team health together as an integrated system.

Immediate next steps:

  • Audit your current measurement capabilities to understand what data you already collect and where gaps exist
  • Select 3-5 priority KPIs aligned with your most pressing engineering challenges rather than attempting comprehensive measurement immediately
  • Establish baseline metrics by measuring current performance before implementing changes
  • Implement automated tracking infrastructure by connecting existing development tools to analytics platforms
  • Train team members on KPI interpretation so metrics become shared language for improvement discussions
  • Create feedback loops that connect metric reviews to prioritized improvement initiatives

For teams ready to deepen their measurement practices, related topics worth exploring include DORA metrics deep-dives for detailed benchmark analysis, developer experience optimization strategies for improving team health scores, and engineering team scaling approaches for maintaining performance as organizations grow.

Top Engineering Management Platform

Top Engineering Management Platform: Features, Benefits, and Insights

Introduction

An engineering management platform is a comprehensive software solution that aggregates data across the software development lifecycle (SDLC) to provide engineering leaders with real-time visibility into team performance, delivery metrics, and developer productivity.

Direct answer: Engineering management platforms consolidate software development lifecycle data from existing tools to provide real-time visibility, delivery forecasting, code quality analysis, and developer experience metrics—enabling engineering organizations to track progress and optimize workflows without disrupting how teams work.

Engineering management platforms act as a centralized "meta-layer" over existing tech stacks, transforming scattered data into actionable insights.

These platforms transform scattered project data from Git repositories, issue trackers, and CI/CD pipelines into actionable insights that drive informed decisions.

Here’s a brief overview: This guide summarizes the methodology and key concepts behind engineering management platforms, including the distinction between tech lead and engineering manager roles, the importance of resource management, and an introduction to essential tools that support data-driven engineering leadership.

This guide covers the core capabilities of engineering management platforms, including SDLC visibility, developer productivity tracking, and AI-powered analytics. It falls outside scope to address general project management software or traditional task management tools that lack engineering-specific metrics. The target audience includes engineering managers, VPs of Engineering, Directors, and tech leads at mid-market to enterprise software companies seeking data-driven approaches to manage projects and engineering teams effectively.

By the end of this guide, you will understand:

  • How engineering management platforms integrate with your existing toolchain to provide comprehensive insights
  • Core DORA metrics and delivery analytics that measure engineering team performance
  • AI-powered capabilities for automated code review and predictive forecasting
  • Evaluation criteria for selecting the right platform for your organization
  • Implementation strategies that ensure developer adoption and measurable ROI

With this introduction, let’s move into a deeper understanding of what engineering management platforms are and how they work.

Understanding Engineering Management Platforms

Engineering management platforms represent an evolution from informal planning approaches toward data-driven software engineering management. Unlike traditional project management tools focused on task tracking and project schedules, these platforms provide a multidimensional view of how engineering teams invest time, deliver value, and maintain code quality across complex projects.

They are specifically designed to help teams manage complex workflows, streamlining and organizing intricate processes that span multiple interconnected project stages, especially within Agile and software delivery teams.

For engineering leaders managing multiple projects and distributed teams, these platforms address a fundamental challenge: gaining visibility into development processes without creating additional overhead for team members.

They serve as central hubs that automatically aggregate project data, identify bottlenecks, and surface trends that would otherwise require manual tracking and status meetings. Modern platforms also support resource management, enabling project managers to allocate resources efficiently, prioritize tasks, and automate workflows to improve decision-making and team productivity.

Engineering management software has evolved from basic spreadsheets to comprehensive tools that offer extensive features like collaborative design and task automation.

Core Platform Components

The foundation of any engineering management platform rests on robust SDLC (Software Development Lifecycle) data aggregation. Platforms connect to Git repositories (GitHub, GitLab, Bitbucket), issue trackers like Jira, and CI/CD pipelines to create a unified data layer. This integration eliminates the fragmentation that occurs when engineering teams rely on different tools for code review, project tracking, and deployment monitoring.

Essential tools within these platforms also facilitate communication, task tracking, and employee performance reports, improving project efficiency and agility.

Intuitive dashboards transform this raw data into real-time visualizations that provide key metrics and actionable insights. Engineering managers can track project progress, monitor pull requests velocity, and identify where work gets blocked—all without interrupting developers for status updates.

These components matter because they enable efficient resource allocation decisions based on actual delivery patterns rather than estimates or assumptions.

AI-Powered Intelligence Layer

Modern engineering management platforms incorporate AI capabilities that extend beyond simple reporting. Automated code review features analyze pull requests for quality issues, potential bugs, and adherence to coding standards. This reduces the manual burden on senior engineers while maintaining code quality across the engineering organization.

Predictive delivery forecasting represents another critical AI capability. Historical data analysis enables accurate forecasting and better planning for future initiatives within EMPs. By analyzing historical data patterns—cycle times, review durations, deployment frequency—platforms can forecast when features will ship and identify risks before they cause project failure.

These capabilities also help prevent budget overruns by providing early warnings about potential financial risks, giving teams better visibility into project financials. This predictive layer builds on the core data aggregation foundation, turning retrospective metrics into forward-looking intelligence for strategic planning.

Developer and Engineering Teams Experience Monitoring

Developer productivity extends beyond lines of code or commits per day. Engineering management platforms increasingly include developer experience monitoring through satisfaction surveys, workflow friction analysis, and productivity pattern tracking. This addresses the reality that developer burnout and frustration directly impact code quality and delivery speed.

Platforms now measure the impact of AI coding tools like GitHub Copilot on team velocity. Understanding how these tools affect different parts of the engineering workflow helps engineering leaders make informed decisions about tooling investments and identify areas where additional resources would provide the greatest return.

This comprehensive view of developer experience connects directly to the specific features and capabilities that distinguish leading platforms from basic analytics tools. Additionally, having a responsive support team is crucial for addressing issues and supporting teams during platform rollout and ongoing use.

With this foundational understanding, we can now explore the essential features and capabilities that set these platforms apart.

Essential Features and Capabilities

Building on the foundational understanding of platform components, effective engineering management requires specific features that translate data into actionable insights. The right tools surface not just what happened, but why—and what engineering teams should do about it.

Software engineering managers and people managers play a crucial role in leveraging an engineering management platform. Software engineering managers guide development projects, ensure deadlines are met, and maintain quality, while people managers focus on enabling team members, supporting career growth, and facilitating decision-making.

Good leadership skills are essential for engineering managers to effectively guide their teams and projects.

DORA Metrics and Delivery Analytics

DORA (DevOps Research and Assessment) metrics are industry-standard measures of software delivery performance. Engineering management platforms track these four key metrics:

  • Deployment frequency: How often code reaches production
  • Lead time for changes: Time from commit to production deployment
  • Mean time to recovery: How quickly teams restore service after incidents
  • Change failure rate: Percentage of deployments causing production failures

Beyond DORA metrics, platforms provide cycle time analysis that breaks down where time is spent—coding, review, testing, deployment. Pull request metrics reveal review bottlenecks, aging PRs, and patterns that indicate process inefficiencies. Delivery forecasting based on historical patterns enables engineering managers to provide accurate project timelines without relying on developer estimates alone.

Code Quality and Review Automation

AI-powered code review capabilities analyze pull requests for potential issues before human reviewers engage. Quality scoring systems evaluate code against configurable standards, identifying technical debt accumulation and areas requiring attention.

This doesn’t replace peer review but augments it—flagging obvious issues so human reviewers, such as a tech lead, can focus on architecture and design considerations. While a tech lead provides technical guidance and project execution leadership, the engineering manager oversees broader team and strategic responsibilities.

Modern tools also include AI agents that can summarize pull requests and predict project delays based on historical data.

Technical debt identification and prioritization helps engineering teams make data-driven decisions about when to address accumulated shortcuts. Rather than vague concerns about “code health,” platforms quantify the impact of technical debt on velocity and risk, enabling better tradeoff discussions between feature development and maintenance work.

Integration with existing code review workflows ensures these capabilities enhance rather than disrupt how teams operate. The best platforms work within pull request interfaces developers already use, reducing the steep learning curve that undermines adoption of new tools.

Team Performance, Resource Allocation, and Optimization

Engineering productivity metrics reveal patterns across team members, projects, and time periods. Capacity planning becomes more accurate when based on actual throughput data rather than theoretical availability. This supports efficient use of engineering resources across complex engineering projects.

Workload distribution analysis identifies imbalances before they lead to burnout. When certain team members consistently carry disproportionate review loads or get pulled into too many contexts, platforms surface these patterns. Risk management extends beyond project risks to include team sustainability risks that affect long-term velocity.

Understanding these capabilities provides the foundation for evaluating which platform best fits your engineering organization’s specific needs.

With a clear view of essential features, the next step is to understand the pivotal role of the engineering manager in leveraging these platforms.

Role of the Engineering Manager

The engineering manager plays a pivotal role in software engineering management, acting as the bridge between technical execution and strategic business goals. Tasked with overseeing the planning, execution, and delivery of complex engineering projects, the engineering manager ensures that every initiative aligns with organizational objectives and industry standards.

Their responsibilities span resource allocation, task management, and risk management, requiring a deep understanding of both software engineering principles and project management methodologies.

A successful engineering manager leverages their expertise to assign responsibilities, balance workloads, and make informed decisions that drive project performance. They are adept at identifying critical tasks, mitigating risks, and adapting project plans to changing requirements.

By fostering a culture of continuous improvement, engineering managers help their teams optimize engineering workflows, enhance code quality, and deliver projects on time and within budget.

Ultimately, the engineering manager’s leadership is essential for guiding engineering teams through the complexities of modern software engineering, ensuring that projects not only meet technical requirements but also contribute to long-term business success.

With the role of the engineering manager established, let’s examine how effective communication underpins successful engineering teams.

Effective Communication in Engineering Teams

Effective communication is the cornerstone of high-performing engineering teams, especially when managing complex engineering projects. Engineering managers must create an environment where team members feel comfortable sharing ideas, raising concerns, and collaborating on solutions.

This involves more than just regular status updates—it requires establishing clear channels for feedback, encouraging open dialogue, and ensuring that everyone understands project goals and expectations.

By prioritizing effective communication, engineering managers can align team members around shared objectives, quickly resolve misunderstandings, and adapt to evolving project requirements.

Transparent communication also helps build trust within the team, making it easier to navigate challenges and deliver engineering projects successfully. Whether coordinating across departments or facilitating discussions within the team, engineering managers who champion open communication set the stage for project success and a positive team culture.

With communication strategies in place, the next step is selecting and implementing the right engineering management platform for your organization.

Platform Selection and Implementation

Selecting an engineering management platform requires balancing feature requirements against integration complexity, cost, and organizational readiness. The evaluation process should involve both engineering leadership and representatives from teams who will interact with the platform daily.

Evaluation Criteria and Selection Process

Platform evaluation begins with assessing integration capabilities with your existing toolchain. Consider these critical factors:

  • Native integrations: Does the platform connect directly to your Git providers, issue trackers, and CI/CD systems without extensive configuration?
  • API flexibility: Can you extend integrations to internal tools or data sources unique to your engineering workflows?
  • Data security and compliance: How does the platform handle sensitive code data, and does it meet your industry’s compliance requirements?
  • Scalability: Will the platform support your engineering organization as it grows from tens to hundreds of engineers?
  • ROI measurement: What metrics will you use to evaluate success, and does the platform provide data to calculate return on investment?

Understanding cash flow is also essential for effective financial management, as it helps track expenses such as salaries and cloud costs, and supports informed budgeting decisions.

Project management software enables engineers to build project plans that adhere to the budget, track time and expenses for the project, and monitor project performance to prevent cost overruns.

Initial setup complexity varies significantly across platforms. Some require extensive configuration and data modeling, while others provide value within days of connecting data sources. Consider your team’s capacity for implementation work against the platform’s time-to-value, and evaluate improvements using DORA metrics.

Platform Comparison Framework

Criterion Lightweight Analytics for DORA metrics Full-Featured EMP Enterprise Suite
SDLC Integration Git + 1–2 sources Comprehensive multi-tool coverage for developers, including pull requests Custom enterprise integrations
AI Features Basic reporting Code review + forecasting Advanced ML models
Developer Experience Metrics only Surveys + productivity Full DevEx platform
Security Standard encryption SOC 2 compliant Enterprise security controls
Pricing Model Per-contributor simple Tiered by features Custom enterprise pricing

When interpreting this comparison, consider where your organization sits today versus where you expect to be in 18-24 months. Starting with a lightweight solution may seem prudent, but migration costs can exceed the initial investment in a more comprehensive platform. Conversely, enterprise solutions often include capabilities that mid-size engineering teams won’t utilize for years.

The selection process naturally surfaces implementation challenges that teams should prepare to address.

With a platform selected, it’s important to anticipate and overcome common implementation challenges.

Top Engineering Management Platforms in 2026

The landscape of engineering management platforms has evolved significantly, with various solutions catering to different organizational needs. Among these, Typo stands out as a premier engineering management platform, especially in the AI era, offering unparalleled capabilities that empower engineering leaders to optimize team performance and project delivery.

Typo: Leading the AI-Powered Engineering Management Revolution

Typo is designed to provide comprehensive SDLC visibility combined with advanced AI-driven insights, making it the best choice for modern engineering organizations seeking to harness the power of artificial intelligence in their workflows. Its core proposition centers around delivering real-time data, automated code fixes, and deep developer insights that enhance productivity and code quality.

Key strengths of Typo include:

  • AI-Enhanced Workflow Automation: Typo integrates AI agents that automatically analyze pull requests, suggest code improvements, and predict potential project delays based on historical data patterns. This automation reduces manual review burdens and accelerates delivery cycles.
  • Comprehensive Metrics and Analytics: Beyond standard DORA metrics, Typo tracks technical debt, developer experience, and deployment frequency, providing a 360-degree view of engineering health. Its intuitive dashboards enable engineering managers to make data-driven decisions with confidence.
  • Seamless Integration: Typo connects effortlessly with existing tools such as GitHub, GitLab, Jira, and CI/CD pipelines, consolidating project data into a unified platform without disrupting established workflows.
  • Developer-Centric Design: Recognizing that developer satisfaction is critical to productivity, Typo includes features that monitor workflow friction and burnout risks, helping managers proactively support their teams.
  • Security and Compliance: Typo adheres to industry standards for data security, ensuring sensitive code and project information remain protected.

In the AI era, Typo's ability to combine advanced analytics with intelligent automation positions it as the definitive engineering management platform. Its focus on reducing toil and enhancing developer flow state translates into higher morale, lower turnover, and improved project outcomes.

Other Notable Platforms

While Typo leads with its AI-driven capabilities, other platforms also offer valuable features:

  • Axify: Known for its comprehensive engineering metrics and resource optimization, ideal for teams focused on performance tracking.
  • LinearB: Excels in workflow automation and developer productivity insights, helping teams streamline delivery.
  • Jellyfish: Aligns engineering efforts with business goals through detailed time tracking and resource allocation.
  • Plutora: Specializes in release management, keeping complex software delivery organized and on schedule.

Each platform brings unique strengths, but Typo’s emphasis on AI-powered insights and automation makes it the standout choice for engineering leaders aiming to thrive in the rapidly evolving technological landscape.

Common Implementation Challenges and Solutions

Even well-chosen platforms encounter adoption friction. Understanding common challenges before implementation enables proactive mitigation strategies rather than reactive problem-solving.

Data Integration and Tool Sprawl

Challenge: Engineering teams often use multiple overlapping tools, creating data silos and inconsistent metrics across different sources.

Solution: Choose platforms with native integrations and API flexibility for seamless data consolidation. Prioritize connecting the most critical data sources first—typically Git and your primary issue tracker—and expand integration scope incrementally. Value stream mapping exercises help identify which data flows matter most for decision-making.

Developer Adoption and Privacy Concerns

Challenge: Developers may resist platforms perceived as surveillance tools or productivity monitoring systems. This resistance undermines data quality and creates cultural friction.

Solution: Implement transparent communication about data usage and focus on developer-beneficial features first. Emphasize how the platform reduces meeting overhead, surfaces blockers faster, and supports better understanding of workload distribution. Involve developers in defining which metrics the platform tracks and how data gets shared. Assign responsibilities for platform ownership to respected engineers who can advocate for appropriate use.

Metric Overload and Analysis Paralysis

Challenge: Comprehensive platforms expose dozens of metrics, dashboards, and reports. Without focus, teams spend more time analyzing data than acting on insights.

Solution: Start with core DORA metrics and gradually expand based on specific team needs and business goals. Define 3-5 key metrics that align with your current strategic planning priorities. Create role-specific dashboards so engineering managers, product managers, and individual contributors each see relevant information without cognitive overload.

Addressing these challenges during planning significantly increases the likelihood of successful platform adoption and measurable impact.

With implementation challenges addressed, continuous improvement becomes the next focus for engineering management teams.

Continuous Improvement in Engineering Management

Continuous improvement is a fundamental principle of effective engineering management, driving teams to consistently enhance project performance and adapt to new challenges. Engineering managers play a key role in fostering a culture where learning and growth are prioritized.

This means regularly analyzing project data, identifying areas for improvement, and implementing changes that optimize engineering workflows and reduce technical debt.

Encouraging team members to participate in training, share knowledge, and provide feedback through retrospectives or surveys helps surface opportunities for process optimization and code quality enhancements.

By embracing continuous improvement, engineering managers ensure that their teams remain agile, competitive, and capable of delivering high-quality software in a rapidly changing environment.

This proactive approach not only improves current project outcomes but also builds a foundation for long-term success and innovation.

With a culture of continuous improvement in place, let’s summarize the key benefits of strong engineering management.

Benefits of Engineering Management

Adopting strong engineering management practices delivers significant benefits for both teams and organizations, including:

  • Improved project performance: Teams deliver projects on time, within budget, and to the highest quality standards.
  • Efficient resource allocation: Engineering managers help reduce the likelihood of project failure and ensure that teams can adapt to changing requirements.
  • Enhanced collaboration and communication: Reduces conflicts and increases job satisfaction among team members.
  • Better prioritization and workload management: Teams are better equipped to prioritize important tasks, manage workloads, and learn from past experiences.
  • Ongoing improvement and learning: Fosters a culture of ongoing improvement, supporting the long-term growth and resilience of engineering organizations.

Ultimately, investing in engineering management not only optimizes project outcomes but also supports the long-term growth and resilience of engineering organizations, making it a critical component of sustained business success.

With these benefits in mind, let’s conclude with actionable next steps for your engineering management journey.

Conclusion and Next Steps

Engineering management platforms transform how engineering leaders understand and optimize their organizations. By consolidating SDLC data, applying AI-powered analysis, and monitoring developer experience, these platforms enable data-driven decision making that improves delivery speed, code quality, and team satisfaction simultaneously.

The shift from intuition-based to metrics-driven engineering management represents continuous improvement in how software organizations operate. Teams that embrace this approach gain competitive advantages in velocity, quality, and talent retention.

Immediate next steps:

  1. Assess your current toolchain to identify visibility gaps and data fragmentation across engineering workflows.
  2. Define 3-5 priority metrics aligned with your strategic objectives for the next 6-12 months.
  3. Evaluate 2-3 platforms against your specific integration requirements and team size.
  4. Plan a pilot implementation with a willing team to validate value before broader rollout.

For teams already using engineering management platforms, related areas to explore include:

With these steps, your organization can begin or accelerate its journey toward more effective, data-driven engineering management.

Frequently Asked Questions

What is an engineering management platform?

An engineering management platform is software that aggregates data from across the software development lifecycle—Git repositories, issue trackers, CI/CD pipelines—to provide engineering leaders with visibility into team performance, delivery metrics, and developer productivity. These platforms transform raw project data into actionable insights for resource allocation, forecasting, and process optimization.

How do engineering management platforms integrate with existing tools?

Modern platforms provide native integrations with common engineering tools including GitHub, GitLab, Bitbucket, Jira, and major CI/CD systems. Most use OAuth-based authentication and read-only API access to aggregate data without requiring changes to existing engineering workflows. Enterprise platforms often include custom integration capabilities for internal tools.

What ROI can teams expect from implementing these platforms?

Organizations typically measure ROI through improved cycle times, reduced meeting overhead for status updates, faster identification of bottlenecks, and more accurate delivery forecasting. Teams commonly report 15-30% improvements in delivery velocity within 6 months, though results vary based on starting maturity level and how effectively teams act on platform insights.

How do platforms handle sensitive code data and security?

Reputable platforms implement SOC 2 compliance, encrypt data in transit and at rest, and provide granular access controls. Most analyze metadata about commits, pull requests, and deployments rather than accessing actual source code. Review security documentation carefully and confirm compliance with your industry’s specific requirements before selection.

What’s the difference between engineering management platforms and project management tools?

Project management tools like Jira or Asana focus on task tracking, project schedules, and workflow management. Engineering management platforms layer analytics, AI-powered insights, and developer experience monitoring on top of data from project management and other engineering tools. They answer “how effectively is our engineering organization performing?” rather than “what tasks are in progress?”

View All

DevEx

View All
productivity metrics

Top Productivity Metrics to Enhance Team Performance and Efficiency

Introduction

Productivity metrics quantify how efficiently teams transform inputs like time and labor into valuable outputs and business results. Measuring these metrics helps identify improvement areas, align employee performance with organizational goals, and boost profitability. This guide focuses on practical frameworks and tools for meaningful productivity measurement that drives process improvements and business success across various teams.

Direct answer: Productivity metrics are quantifiable measures that assess how effectively teams complete work and deliver value, combining input metrics (time spent, resources invested) with output metrics (projects completed, features delivered) and outcome metrics (customer satisfaction, revenue generated).

By the end of this guide, you will:

  • Understand the core types of productivity metrics and how each metric measures different aspects of performance, and how these metrics can help increase productivity
  • Select relevant key performance indicators that align with your business goals
  • Avoid vanity metrics that track activity without reflecting actual value creation
  • Implement automated measurement systems using your existing SDLC tools
  • Connect productivity levels to meaningful business outcomes like revenue per employee and customer satisfaction

Understanding Productivity Metrics

Productivity metrics are measures that quantify how employee activities contribute to the company's goals and their individual performance.

Productivity metrics are systematic measurements that assess the efficiency, effectiveness, and impact of work processes across individual employees and teams. Understanding the contribution of each team member is essential, as individual performance directly affects overall productivity. In modern software development and engineering environments, these workforce productivity metrics provide objective insights that drive resource optimization, identify trends in team performance, and support data-driven decisions about capacity and priorities. Monitoring non business activities, such as time spent on non-work-related tasks, is also important to identify inefficiencies and optimize productivity.

Attendance and punctuality are crucial for maintaining consistent output in a workforce. High absenteeism rates can lead to increased overtime costs and decreased productivity.

Core Components of Productivity Measurement

A productivity metric is a measurement that expresses part or all of the company's output in terms of an input.

The foundational formula for labor productivity—outputs divided by inputs—adapts flexibly across contexts. Inputs include productive hours, costs incurred, and effort invested, while outputs encompass features shipped, support ticket resolutions, or customer inquiries handled within a same time period. Measuring the time spent to perform productive work is essential for understanding team efficiency, as it helps quantify how much effort is directed toward meaningful output.

This input-output framework connects directly to continuous improvement in engineering workflows. When you measure how efficiently your team transforms development time into working features, you create baseline data for identifying bottlenecks and tracking the impact of process changes. Tracking employee utilization alongside output quality reveals whether your team operates at a healthy workload or faces burnout risk from unreasonable benchmarks. Average Daily Productivity is used to understand how many hours a day a team can perform productive work.

Productivity vs Performance vs Activity Metrics

Not all measurements qualify as genuine productivity metrics. Activity metrics like lines of code written or how many hours spent in meetings track motion rather than progress. Performance metrics focus on individual performance against specific targets. Productivity metrics, by contrast, measure value creation—the actual work environment outcomes that matter to customers and the business.

Worker productivity measurement should reflect the planned to done ratio and quality of deliverables, not merely employee activities logged. A developer who ships three high-impact features with zero defects demonstrates greater productivity than one who commits twice as much code requiring extensive rework. Understanding this distinction prevents the gaming and misalignment that occurs when teams meet unreasonable benchmarks for activity while actual business success suffers.

This foundational understanding of what productivity metrics truly measure prepares us to examine the specific categories of metrics most relevant to engineering and knowledge work teams.

Essential Types of Employee Productivity Metrics

Building on our definition of productivity as value creation rather than activity volume, engineering teams typically organize their key metrics into four complementary categories. Each category illuminates different aspects of team productivity, and effective measurement requires representation from multiple types.

Velocity and Flow Metrics

Cycle time measures the average time from when work begins on a task until completion—this metric tracks how efficiently your team moves items through the development process. Lead time extends this measurement to include queue time, capturing the full duration from task creation to delivery.

Deployment frequency indicates how often your team ships code to production, serving as a key indicator of delivery capability. In Agile environments, velocity tracks story points or assigned tasks completed per sprint, revealing team’s ability to maintain consistent throughput. Stable or increasing velocity typically signals mature processes, while erratic patterns may indicate context switching issues or unclear requirements affecting average daily productivity.

Quality and Reliability Metrics

Change failure rate measures the percentage of deployments causing production incidents, directly reflecting code quality and testing effectiveness. Mean time to recovery (MTTR) tracks how quickly teams restore service after failures—this metric reflects operational maturity and incident response capability.

These quality metrics connect directly to customer satisfaction and long-term business outcomes. A team with high deployment frequency but equally high failure rates creates more problems than value. Balancing speed metrics with quality metrics prevents the short-term thinking that sacrifices reliability for velocity, ultimately leading to decreased productivity as teams spend more time on firefighting than feature development.

Efficiency and Employee Utilization Metrics

Utilization rate calculates the percentage of available time spent on productive work versus meetings, administrative tasks, or unproductive interruption periods. Research suggests that a healthy workload occurs when teams maintain 80-85% utilization—enough buffer for employee development, collaboration, and responding to unplanned needs. Evaluating your team's ability to allocate time between focused work and collaboration is crucial for optimizing productivity and ensuring that each role contributes effectively.

Code review time and pull request throughput reveal bottlenecks in your delivery pipeline. If code sits in review queues for days, your cycle time suffers regardless of how quickly developers write code. Monitoring these efficiency metrics helps improve productivity by highlighting where work stalls between productive hrs of focused development. Tracking overtime allows you to keep those costs down and helps you bill for projects more accurately.

Impact and Business Value Metrics

Revenue per employee provides an organization-wide view of workforce productivity metrics, while feature adoption rates show whether shipped functionality actually delivers customer value. Customer satisfaction scores—gathered through surveys or support ticket analysis—connect development work to the desired outcome of happy, retained users.

These impact metrics prevent teams from optimizing for internal measures that don’t translate to business success. A team might show excellent velocity and low defect rates while building features nobody uses. Incorporating customer-facing outcome metrics ensures productivity measurement stays connected to actual organizational goals.

Key takeaways: Effective productivity measurement combines velocity metrics (how fast), quality metrics (how well), efficiency metrics (how sustainably), and impact metrics (to what end). No single category provides a complete picture of team’s weekly habits or long-term effectiveness.

With these metric categories established, we can now examine how to select and implement the right combination for your specific context.

Measuring and Implementing Productivity Metrics

Understanding metric types provides the foundation; implementation determines whether measurement actually drives improvement. The goal is creating sustainable systems that assess productivity without overwhelming teams or distorting behavior through surveillance-like monitoring.

Step-by-Step Implementation Process

Begin with a systematic approach that connects measurement directly to what you’re trying to achieve:

  1. Identify business objectives and align metrics accordingly. Start by clarifying your goals—are you trying to improve efficiency, increase delivery speed, or boost customer satisfaction? Your metrics should directly support answering whether you’re achieving these outcomes. A sales team focused on sales growth needs different metrics than an engineering team focused on reliability.
  2. Select 3-5 key metrics from different categories. Choosing from multiple categories prevents tunnel vision and gaming. Combine a velocity metric (cycle time), a quality metric (change failure rate), an efficiency metric (utilization rate), and an impact metric (customer satisfaction). This balanced scorecard approach reveals tradeoffs and prevents optimizing one dimension at the expense of others.
  3. Establish baseline measurements using existing tool data. Before setting targets, understand your current productivity levels. Pull historical data from your Git repository, project management tools, and incident tracking systems. This baseline reveals what’s normal for your team and informs realistic improvement goals rather than arbitrary benchmarks that may cause employees to work overtime hours unsustainably.
  4. Set up automated data collection from SDLC tools. Manual tracking creates overhead and inconsistency. Integrate measurement platforms with Git, Jira, CI/CD pipelines, and support systems to automatically capture metrics. This reduces time spent on measurement itself and provides real-time visibility into employee performance trends.
  5. Create dashboards and regular review processes. Metrics only improve productivity when teams actually review and act on them. Establish weekly or bi-weekly cadences for examining trends, celebrating improvements, and identifying areas needing attention. Avoid using metrics punitively in performance reviews—focus on team-level patterns that inform process improvements.

Key Performance Indicators Selection Framework Comparison

Comparing KPI Selection Frameworks

Different frameworks offer structured approaches to productivity measurement. Selecting the right one depends on your team’s maturity and primary goals:

Criterion DORA Metrics SPACE Framework DevEx Framework
Primary Focus Delivery performance Holistic developer experience Developer satisfaction and flow
Core Metrics 4 key metrics: deployment frequency, lead time, change failure rate, MTTR 25+ metrics across satisfaction, performance, activity, communication, efficiency Developer satisfaction, perceived productivity, flow state
Best For Teams optimizing the delivery pipeline Organizations seeking a balanced view of employee well-being and productivity Teams prioritizing engagement and reducing friction
Data Sources CI/CD systems, incident management Surveys, tool analytics, collaboration data Surveys, calendar analysis, tool telemetry
Implementation Effort Moderate—requires CI/CD instrumentation High—requires multiple data sources and survey infrastructure Moderate—emphasizes qualitative alongside quantitative

DORA metrics, widely cited in industry reports including analysis referenced in Harvard Business Review discussions of software delivery, provide straightforward essential metrics for teams focused on deployment performance. SPACE and DevEx frameworks expand beyond pure output to incorporate employee satisfaction and sustainability, helping ensure that boosting productivity doesn’t come at the cost of burnout.

Choose based on your current challenges: if deployments are slow and error-prone, start with DORA. If engaged employees are leaving despite good delivery metrics, SPACE or DevEx surface issues that pure throughput metrics miss.

With your measurement system established, anticipating and addressing common pitfalls becomes essential for sustained success.

Employee Development and Growth

Investing in employee development boosts productivity and drives long-term success. Companies prioritizing training see higher revenue growth and improved employee performance, according to Harvard Business Review.

Using key metrics like revenue per employee helps identify skill gaps and measure training effectiveness, ensuring resources are well allocated for maximum impact.

Employee development also fosters engagement and motivation, leading to innovation, ownership, and better retention. Integrating development into your productivity strategy is essential for sustainable growth and competitive advantage.

Planned to Done Ratio and Its Impact

The planned to done ratio measures the percentage of assigned tasks completed within a given time period, providing clear insights into team productivity and work habits. A high ratio reflects effective time management, minimal distractions, and focused effort, leading to increased employee satisfaction and better outcomes.

Tracking this metric helps identify obstacles like unproductive interruptions or unclear priorities. Analyzing trends enables leaders to implement targeted improvements such as refining task planning or reducing unnecessary meetings.

Regular monitoring empowers teams to optimize workflows, complete tasks efficiently, and foster a productive, satisfying work environment aligned with organizational goals.

Monitoring and Reporting on Productivity

Regular Reviews and Feedback

Consistent monitoring and transparent reporting are essential for maintaining high productivity levels and achieving business success. By systematically tracking key metrics such as employee utilization, quality metrics, and customer satisfaction, organizations gain a comprehensive understanding of their workforce’s performance and can quickly identify areas for improvement.

Regular performance reviews and feedback sessions play a crucial role in this process. They provide employees with clear insights into their strengths and areas for growth, set expectations, and encourage ongoing development.

Leveraging Data Analytics

Leveraging data analytics tools further enhances this approach by offering real-time visibility into productivity levels. These tools enable leaders to make informed decisions that drive business outcomes and improve efficiency.

Prioritizing monitoring and reporting ensures that productivity initiatives remain aligned with organizational goals. It also helps businesses adapt to changing conditions, optimize resource allocation, and achieve greater productivity across teams. By embedding these practices into the company culture, organizations can continuously refine their strategies, support employee growth, and ultimately realize sustained business success.

Common Challenges and Solutions

Even well-designed measurement programs encounter obstacles that can undermine their effectiveness or create unintended consequences. Monitoring the team's weekly habits is crucial for identifying patterns of productivity and engagement, which allows for timely adjustments and improved strategies. Recognizing these patterns early helps maintain measurement integrity.

Gaming the Metrics

When individual employees are evaluated primarily on specific metrics, behavior shifts to optimize those numbers rather than underlying performance. Developers might split pull requests artificially to inflate completed items, or teams might avoid ambitious features that would increase cycle time.

Solution: Use balanced scorecards combining quantitative metrics with qualitative assessment. Include team retrospective feedback, peer input, and outcome metrics like customer service agent satisfaction alongside velocity measures. When metrics are used for learning rather than punishment, gaming incentives diminish. Explicitly discuss what each metric tracks and its limitations during team meetings.

Data Silos and Tool Integration

Engineering teams often use multiple disconnected tools—Git for code, Jira for tickets, PagerDuty for incidents, separate systems for support ticket tracking. Manually aggregating data across these systems consumes time management bandwidth and introduces inconsistency.

Solution: Implement platforms that consolidate data automatically from multiple SDLC tools. Modern developer analytics platforms connect to common toolchains to provide unified views of the delivery process. When evaluating solutions, prioritize those that capture context switching patterns and collaboration metrics alongside pure throughput—the default threshold for useful integration is covering at least 80% of your team’s daily workflow tools.

Overwhelming Teams with Too Many Metrics

The temptation to measure everything creates dashboard fatigue. When teams face dozens of metrics, attention fragments and none receive adequate focus. Analysis paralysis prevents the targeted improvement efforts that drive meaningful productivity gains.

Solution: Start with 3-5 core metrics aligned to your most pressing business objectives. Resist adding new metrics until the existing ones have driven at least one cycle of improvement. Each metric should have a clear owner responsible for monitoring and proposing actions. Expand gradually based on team feedback and demonstrated maturity in using existing measures, never overwhelming individual performance expectations.

These common challenges are solvable with intentional design. Sustainable measurement practices balance rigor with practicality, creating systems teams actually use rather than resent.

Conclusion and Next Steps

Effective productivity metrics combine quantitative data from your development tools with qualitative insights about team experience. The goal isn’t measuring everything possible—it’s measuring what matters for improving workplace productivity while maintaining employee well being and engagement.

The most successful measurement programs treat metrics as starting points for conversation rather than final verdicts. When cycle time increases, the question becomes “why?” rather than “who’s at fault?” This learning orientation prevents the surveillance culture that destroys trust while still providing the visibility needed to identify trends and improve efficiency.

Immediate next steps:

  • Audit your current metrics—what are you tracking, and does each metric connect to actual organizational goals?
  • Select 3-5 key performance indicators representing different categories (velocity, quality, efficiency, impact)
  • Set up automated data collection from your existing tools to establish baselines without manual overhead
  • Establish a bi-weekly review cadence where the team examines trends and identifies one improvement focus

For teams with mature measurement practices, advanced topics like AI-powered predictive analytics and real-time diagnostic dashboards can surface issues before they impact delivery. These capabilities build on solid fundamentals—without the baseline practices, sophisticated tools simply provide faster access to unreliable data.

Space Metrics

Mastering Space Metrics: A Guide to Enhancing Developer Productivity

Introduction

SPACE metrics are a multi-dimensional measurement framework that evaluates developer productivity through developer satisfaction surveys, performance outcomes, developer activity tracking, communication and collaboration metrics, and workflow efficiency—providing engineering leaders with actionable insights across the entire development process.

Space metrics provide a holistic view of developer productivity by measuring software development teams across five interconnected dimensions: Satisfaction and Well-being, Performance, Activity, Communication and Collaboration, and Efficiency and Flow. This comprehensive space framework moves beyond traditional metrics to capture what actually drives sustainable engineering excellence. In addition to tracking metrics at the individual, team, and organizational levels, space metrics can also be measured at the engineering systems level, providing a more comprehensive evaluation of developer efficiency and productivity.

This guide covers everything from foundational space framework concepts to advanced implementation strategies for engineering teams ranging from 10 to 500+ developers. Whether you’re an engineering leader seeking to improve developer productivity, a VP of Engineering building data-driven culture, or a development manager looking to optimize team performance, you’ll find actionable insights that go far beyond counting lines of code or commit frequency. The space framework offers a research-backed approach that acknowledges the complete picture of how software developers actually work and thrive.

High levels of developer satisfaction contribute to employee motivation and creativity, leading to better overall productivity. Unhappy developers tend to become less productive before they leave their jobs.

Key outcomes you’ll gain from this guide:

  • Learn to implement SPACE metrics in your organization with a phased rollout approach
  • Avoid common measurement pitfalls that undermine team productivity and developer well being
  • Integrate space framework tracking with existing tools like Jira, GitHub, and your software delivery pipeline
  • Understand how to measure developer productivity without creating perverse incentives
  • Build a culture that encourages continuous improvement as a core value, sustainably improving team performance

Understanding and implementing space metrics is essential for building high-performing, resilient software teams in today's fast-paced development environments.

Understanding Space Metrics

The SPACE framework measures developer productivity across five key dimensions: Satisfaction and well-being, Performance, Activity, Communication and collaboration, and Efficiency and flow. The SPACE framework is a research-backed method for measuring software engineering team effectiveness across these five key dimensions. The five dimensions of the SPACE framework are designed to help teams understand the factors influencing their productivity and use better strategies to improve it. SPACE metrics encourage a balanced approach to measuring productivity, considering both technical output and human factors. SPACE metrics provide a holistic view of developer productivity by considering both technical output and human factors.

What is the SPACE Framework?

The SPACE framework is a comprehensive, research-backed approach to measuring developer productivity. It was developed by researchers at GitHub, Microsoft, and the University of Victoria to address the shortcomings of traditional productivity metrics. The framework evaluates software development teams across five key dimensions:

  • Satisfaction and Well-being: Measures developer happiness, psychological safety, and work-life balance.
  • Performance: Focuses on business outcomes, feature delivery, and system reliability.
  • Activity: Tracks the volume and patterns of development work, such as pull requests and code reviews.
  • Communication and Collaboration: Assesses the effectiveness of information flow and teamwork.
  • Efficiency and Flow: Captures how smoothly work moves from idea to production, including cycle time and deployment frequency.

Why Traditional Metrics Fall Short

Traditional productivity metrics like lines of code, commit count, and hours logged create fundamental problems for software development teams. They’re easily gamed, fail to capture code quality, and often reward behaviors that harm long-term team productivity. For a better understanding of measuring developer productivity effectively, it is helpful to consider both quantitative and qualitative factors.

Velocity-only measurements prove particularly problematic. Teams that optimize solely for story points frequently sacrifice high quality code, skip knowledge sharing, and accumulate technical debt that eventually slows the entire development process.

The Role of Qualitative Data

The SPACE framework addresses these limitations by incorporating both quantitative system data and qualitative insights gained from developer satisfaction surveys. This dual approach captures both what’s happening and why it matters, providing a more complete picture of team health and productivity.

For modern software development teams using AI coding tools, distributed workflows, and complex collaboration tools, space metrics have become essential. They provide the relevant metrics needed to understand how development tools, team meetings, and work life balance interact to influence developer productivity.

Core Principles of Space Metrics

Balanced Measurement Across Levels

The space framework operates on three foundational principles that distinguish it from traditional metrics approaches.

First, balanced measurement across individual, team, and organizational levels ensures that improving one area doesn’t inadvertently harm another. A developer achieving high output through unsustainable hours will show warning signs in satisfaction metrics before burning out.

Combining Quantitative and Qualitative Data

Second, the framework mandates combining quantitative data collection (deployment frequency, cycle time, pull requests merged) with qualitative insights (developer satisfaction surveys, psychological safety assessments). This dual approach captures both what’s happening and why it matters.

Focus on Business Outcomes

Third, the framework focuses on business outcomes and value delivery rather than just activity metrics. High commit frequency means nothing if those commits don’t contribute to customer satisfaction or business objectives.

Space Metrics vs Traditional Productivity Measures

The space framework explicitly addresses the limitations of traditional metrics by incorporating developer well being, communication and collaboration quality, and flow metrics alongside performance metrics. This complete picture reveals whether productivity gains are sustainable or whether teams are heading toward burnout.

The transition from traditional metrics to space framework measurement represents a shift from asking “how much did we produce?” to asking “how effectively and sustainably are we delivering value?”

The Five SPACE Dimensions Explained

Each dimension of the space framework reveals different aspects of team performance and developer experience. Successful engineering teams measure across at least three dimensions simultaneously—using fewer creates blind spots that undermine the holistic view the framework provides.

Satisfaction and Well-being (S)

Developer satisfaction directly correlates with sustainable productivity. This dimension captures employee satisfaction through multiple measurement approaches: quarterly developer experience surveys, work life balance assessments, psychological safety ratings, and burnout risk indicators.

Specific measurement examples include eNPS (employee Net Promoter Score), retention rates, job satisfaction ratings, and developer happiness indices. These metrics reveal whether your development teams can maintain their current pace or are heading toward unsustainable stress levels.

Research shows a clear correlation: when developer satisfaction increases from 6/10 to 8/10, productivity typically improves by 20%. This happens because satisfied software developers engage more deeply with problems, collaborate more effectively, and maintain the focus needed to produce high quality code.

Performance (P)

Performance metrics focus on business outcomes rather than just activity volume. Key metrics include feature delivery success rate, customer satisfaction scores, defect escape rate, and system reliability indicators.

Technical performance indicators within this dimension include change failure rate, mean time to recovery (MTTR), and code quality scores from static analysis. These performance metrics connect directly to software delivery performance and business objectives.

Importantly, this dimension distinguishes between individual contributor performance and team-level outcomes. The framework emphasizes team performance because software development is inherently collaborative—individual heroics often mask systemic problems.

Activity (A)

Activity metrics track the volume and patterns of development work: pull requests opened and merged, code review participation, release cadence, and documentation contributions.

This dimension also captures collaboration activities like knowledge sharing sessions, cross-team coordination, and onboarding effectiveness. These activities often go unmeasured but significantly influence developer productivity across the organization.

Critical warning: Activity metrics should never be used for individual performance evaluation. Using pull request counts to rank software developers creates perverse incentives that harm code quality and team collaboration. Activity metrics reveal team-level patterns—they identify bottlenecks and workflow issues, not individual performance problems.

Communication and Collaboration (C)

Communication and collaboration metrics measure how effectively information flows through development teams. Key indicators include code review response times, team meetings efficiency ratings, and cross-functional project success rates.

Network analysis metrics within this dimension identify knowledge silos, measure team connectivity, and assess onboarding effectiveness. These collaboration metrics reveal whether new tools or process changes are actually improving how software development teams work together.

The focus here is quality of interactions rather than quantity. Excessive team meetings that interrupt flow and complete work patterns indicate problems, even if “collaboration” appears high by simple counting measures.

Efficiency and Flow (E)

Efficiency and flow metrics capture how smoothly work moves from idea to production. Core measurements include cycle time from commit to deployment, deployment frequency, and software delivery pipeline efficiency.

Developer experience factors in this dimension include build success rates, test execution time, and environment setup speed. Long build times or flaky tests create constant interruptions that prevent developers from maintaining flow and complete work patterns.

Flow state indicators—focus time blocks, interruption patterns, context-switching frequency—reveal whether software developers have the minimal interruptions needed for deep work. High activity with low flow efficiency signals that productivity tools and processes need attention.

Code Quality and Code Reviews

Code quality and code reviews are foundational to high-performing software development teams and are central to measuring and improving developer productivity within the SPACE framework. High code quality not only ensures reliable, maintainable software but also directly influences developer satisfaction, team performance, and the overall efficiency of the development process.

The SPACE framework recognizes that code quality is not just a technical concern—it’s a key driver of developer well being, collaboration, and business outcomes. By tracking key metrics related to code reviews and code quality, engineering leaders gain actionable insights into how their teams are working, where bottlenecks exist, and how to foster a culture of continuous improvement.

Step-by-Step SPACE Metrics Implementation Guide

Implementing space metrics typically requires 3-6 months for full rollout, with significant investment in leadership alignment and cultural change. Engineering leaders should expect to dedicate 15-20% of a senior team member’s time during the initial implementation phases.

The process requires more than just new tools—it requires educating team members about why tracking metrics matters and how the data will be used to support rather than evaluate them.

Phase 1: Assessment and Planning

  1. Audit existing development tools (GitHub, GitLab, Jira, Azure DevOps) and identify current metric collection capabilities—most teams have more data available than they realize.
  2. Survey engineering leaders and team leads to understand productivity pain points and which SPACE dimensions feel most opaque.
  3. Select a pilot team of 8-12 developers for initial implementation—choose a team with strong trust and openness to experimentation.
  4. Map current tools to SPACE dimensions to identify which metrics you can begin tracking space metrics for immediately versus those requiring new tools.

Phase 2: Tool Integration and Baseline Collection

  1. Implement automated data collection from version control, issue tracking, and CI/CD pipelines—automate data collection wherever possible to avoid manual overhead.
  2. Deploy initial developer satisfaction surveys using 5-7 carefully designed questions on a monthly cadence.
  3. Establish baseline measurements across 3-4 selected SPACE dimensions before implementing any changes.
  4. Create initial dashboards using engineering intelligence platforms that consolidate system data for analysis.

Phase 3: Analysis and Optimization

  1. Analyze trends and metric correlations to identify bottlenecks and improvement opportunities.
  2. Implement targeted interventions based on data insights—small, focused changes you can measure.
  3. Refine measurement approaches based on team feedback about what’s useful versus noise.
  4. Scale implementation to additional development teams once the pilot demonstrates value.

Measurement Tool Selection

Selecting the right tools determines whether tracking space metrics becomes sustainable or burdensome.

Criteria Engineering Intelligence Platforms Point Solutions Custom Dashboards
Automation High—automates data collection across the SDLC Medium—requires multiple integrations Low—significant maintenance effort
Integration Broad support for existing tools Narrow focus areas Flexible but labor-intensive
Cost Higher upfront, lower ongoing cost Lower entry cost, higher total cost over time Internal resources required
Time to Value 2–4 weeks 1–2 weeks per tool 2–3 months

For most engineering teams, platforms that consolidate software development lifecycle data provide the fastest path to comprehensive space framework measurement. These platforms can analyze trends across multiple dimensions while connecting to your existing project management and collaboration tools.

Common Challenges and Solutions

Developer Survey Fatigue and Low Response Rates

Survey-based data collection often fails when teams feel over-surveyed or see no value from participation.

Start with passive metrics from existing tools before introducing any surveys—this builds trust that the data actually drives improvements. Keep initial surveys to 3-5 questions with a clear value proposition explaining how insights gained will help the team.

Share survey insights back to teams within two weeks of collection. When developers see their feedback leading to concrete changes, response rates increase significantly. Rotate survey focus areas quarterly to maintain engagement and prevent question fatigue.

Management Misuse of Metrics for Individual Performance

The most common failure mode for space metrics occurs when managers use team-level data to evaluate individual software developers—destroying the psychological safety the framework requires.

Establish clear policies prohibiting individual evaluation using SPACE metrics from day one. Educate team members and leadership on why team-level insights focus is essential for honest self-reporting. Create aggregated reporting that prevents individual developer identification, and implement metric access controls limiting who can see individual-level system data.

Conflicting Signals Across SPACE Dimensions

When different dimensions tell different stories—high activity but low satisfaction, strong performance but poor flow metrics—teams often become confused about what to prioritize.

Treat metric conflicts as valuable insights rather than measurement failures. High activity combined with low developer satisfaction typically signals potential burnout. Strong performance metrics alongside poor efficiency and flow often indicates unsustainable heroics masking process problems.

Use correlation analysis to identify bottlenecks and root causes. Focus on trend analysis over point-in-time snapshots, and implement regular team retrospectives to discuss metric insights and improvement actions.

Slow Progress Despite Consistent Measurement

Some teams measure diligently for months without seeing meaningful improvements in developer productivity.

First, verify you’re measuring leading indicators (process metrics) rather than only lagging indicators (outcome metrics). Leading indicators enable faster course correction.

Ensure improvement initiatives target root causes identified through metric analysis rather than symptoms. Account for external factors—organizational changes, technology migrations, market pressures—that may mask improvement. Celebrate incremental wins and maintain a continuous improvement perspective; sustainable change takes quarters, not weeks.

Conclusion and Next Steps

Space metrics provide engineering leaders with comprehensive insights into software developer performance that traditional output metrics simply cannot capture. By measuring across satisfaction and well being, performance, activity, communication and collaboration, and efficiency and flow, you gain the complete picture needed to improve developer productivity sustainably.

The space framework offers something traditional metrics never could: a balanced view that treats developers as whole people whose job satisfaction and work life balance directly impact their ability to produce high quality code. This holistic approach aligns with how software development actually works—as a collaborative, creative endeavor that suffers when reduced to simple output counting.

To begin implementing space metrics in your organization:

  1. Select a pilot team and identify 3 SPACE dimensions most relevant to your current challenges.
  2. Audit current tools to understand what data collection you can automate immediately.
  3. Establish baseline measurements over 2-3 sprint cycles before implementing any improvement initiatives.
  4. Schedule monthly metric review sessions with development teams to maintain continuous improvement momentum.
  5. Consider engineering intelligence platforms for automated SPACE metric collection and analysis.

Related topics worth exploring: dora metrics integration with the space framework DORA metrics essentially function as examples of Performance and Efficiency dimensions, AI-powered code review impact measurement, and developer experience optimization strategies.

d x

Maximizing d x: Essential Strategies for Enhanced Developer Experience

Introduction

Developer experience (DX) refers to how developers feel about the tools and platforms they use to build, test, and deliver software. Developer Experience (DX or DevEx) refers to the complete set of interactions developers have with tools, processes, workflows, and systems throughout the software development lifecycle. When engineering leaders invest in good DX, they directly impact code quality, deployment frequency, and team retention—making it a critical factor in software delivery success. Developer experience is important because it directly influences software development efficiency, drives innovation, and contributes to overall business success by enabling better productivity, faster time to market, and a competitive advantage.

Who Should Read This Guide

This guide covers measurement frameworks, improvement strategies, and practical implementation approaches for engineering teams seeking to optimize how developers work. The target audience includes engineering leaders, VPs, directors, and platform teams responsible for developer productivity initiatives and development process optimization.

DX encompasses every touchpoint in a developer’s journey—from onboarding process efficiency and development environment setup to code review cycles and deployment pipelines. The developer's journey includes onboarding, environment setup, daily workflows, and collaboration, each of which impacts developer productivity, satisfaction, and overall experience. Organizations with good developer experience see faster lead time for changes, higher quality code, and developers who feel empowered rather than frustrated.

By the end of this guide, you will gain:

  • A clear understanding of core DX components and why developer experience is important
  • Practical frameworks to measure developer experience using DORA metrics and productivity indicators
  • Actionable strategies to improve developer productivity across your organization
  • Methods to quantify DX ROI and align improvements with business goals
  • An implementation roadmap for engineering intelligence platforms

For example, streamlining the onboarding process by automating environment setup can reduce new developer time-to-productivity from weeks to just a few days, significantly improving overall DX.

Understanding and improving developer experience is essential for engineering leaders who want to drive productivity, retain top talent, and deliver high quality software at speed.

Understanding Developer Experience Fundamentals

Developer experience defines how effectively developers can focus on writing high quality code rather than fighting tools and manual processes. It encompasses the work environment, toolchain quality, documentation access, and collaboration workflows that either accelerate or impede software development.

The relevance to engineering velocity is direct: when development teams encounter friction—whether from slow builds, unclear documentation, or fragmented systems—productivity drops and frustration rises. Good DX helps organizations ship new features faster while maintaining code quality and team satisfaction.

Work Environment and Toolchain

Development environment setup and toolchain integration form the foundation of the developer’s journey. This includes IDE configuration, package managers, local testing capabilities, and access to shared resources. When these elements work seamlessly, developers can begin contributing value within days rather than weeks during the onboarding process.

Code Review and Collaboration

Code review processes and collaboration workflows determine how efficiently knowledge transfers across teams. Effective code review systems provide developers with timely feedback, maintain quality standards, and avoid becoming bottlenecks that slow deployment frequency.

Deployment Pipelines and Release Management

Deployment pipelines and release management represent the final critical component. Self service deployment capabilities, automated testing, and reliable CI/CD systems directly impact how quickly code moves from development to production. These elements connect to broader engineering productivity goals by reducing the average time between commit and deployment.

With these fundamentals in mind, let's explore how to measure and assess developer experience using proven frameworks.

Essential DX Metrics and Measurement Frameworks

Translating DX concepts into quantifiable data requires structured measurement frameworks. Engineering leaders need both system-level metrics capturing workflow efficiency and developer-focused indicators revealing satisfaction and pain points. Together, these provide a holistic view of the developer experience.

DORA Metrics for DX Assessment

DORA metrics, developed by leading researchers studying high-performing engineering organizations, offer a validated framework for assessing software delivery performance. Deployment frequency measures how often teams successfully release to production—higher frequency typically correlates with smaller, less risky changes and faster feedback loops.

Lead time for changes captures the duration from code commit to production deployment. This metric directly reflects how effectively your development process supports rapid iteration. Organizations with good DX typically achieve lead times measured in hours or days rather than weeks.

Mean time to recovery (MTTR) and change failure rate impact developer confidence significantly. When developers trust that issues can be quickly resolved and that deployments rarely cause incidents, they’re more willing to ship frequently. Integration with engineering intelligence platforms enables automated tracking of these metrics across your entire SDLC.

Developer Productivity Metrics

Code review cycle time reveals collaboration efficiency within development teams. Tracking the average time from pull request creation to merge highlights whether reviews create bottlenecks or flow smoothly. Extended cycle times often indicate insufficient reviewer capacity or unclear review standards.

Context switching frequency and focus time measurement address cognitive load. Developers work most effectively during uninterrupted blocks; frequent interruptions from meetings, unclear requirements, or tool issues fragment attention and reduce output quality.

AI coding tool adoption rates have emerged as a key metric for modern engineering organizations. Tracking how effectively teams leverage AI tools for code generation, testing, and documentation provides insight into whether your platform supports cutting-edge productivity gains.

Developer Satisfaction Indicators

Developer experience surveys and Net Promoter Score (NPS) for internal tools capture qualitative sentiment that metrics alone miss. These instruments identify friction points that may not appear in system data—unclear documentation, frustrating approval processes, or technologies that developers find difficult to use.

Retention rates serve as a lagging indicator of DX quality. Companies with poor developer experience see higher attrition as engineers seek environments where they can do their best work. Benchmarking against industry standards helps contextualize your organization’s performance.

These satisfaction indicators connect directly to implementation strategies, as they identify specific areas requiring improvement investment.

With a clear understanding of which metrics matter, the next step is to implement effective measurement and improvement programs.

Implementing DX Measurement and Improvement Programs

Moving from measurement frameworks to practical implementation requires systematic assessment, appropriate tooling, and organizational commitment. Engineering leaders must balance comprehensive data collection with actionable insights that drive real improvements.

DX Assessment Process

Conducting a thorough DX assessment helps development teams identify friction points and establish baselines before implementing changes. The following sequential process provides a structured approach:

  1. Baseline Current Workflows
    Baseline current developer workflows and pain points through surveys, interviews, and observation of how developers work across different teams and projects.
  2. Implement Measurement Tools
    Implement measurement tools and data collection systems that capture DORA metrics, code review analytics, and productivity indicators without adding friction to existing workflows.
  3. Establish Benchmark Metrics
    Establish benchmark metrics and improvement targets by comparing current performance against industry standards and setting realistic, time-bound goals aligned with business goals.
  4. Create Feedback Loops
    Create feedback loops with development teams ensuring developers feel heard and can contribute insights that quantitative data might miss.
  5. Monitor Progress and Iterate
    Monitor progress and iterate on improvements using dashboards that provide a complete view of DX metrics and highlight areas requiring attention.

With a structured assessment process in place, the next consideration is selecting the right platform to support your DX initiatives.

DX Platform Comparison

Engineering leaders must choose appropriate tools to measure developer experience and drive improvements. Different approaches offer distinct tradeoffs:

Criterion Engineering Analytics Platforms Survey-Based Solutions Custom Internal Dashboards
Data Sources Comprehensive SDLC integration (Git, CI/CD, issue tracking) Developer self-reports and periodic surveys Limited to manually configured sources
Metric Coverage DORA metrics, productivity analytics, code review data Satisfaction, sentiment, qualitative feedback Varies based on development investment
AI Integration AI-powered insights, anomaly detection, trend analysis, and real-time monitoring of AI coding tool adoption and impact Basic analysis capabilities Requires custom development
Implementation Speed Weeks to production-ready Days to launch surveys Months for meaningful coverage
Ongoing Maintenance Vendor-managed Survey design updates Significant internal expertise required
The Evolving Role of AI in DX Platforms
Since the start of 2026, AI coding tools have rapidly evolved from mere code generation assistants to integral components of the software development lifecycle. Modern engineering analytics platforms like Typo AI now incorporate advanced AI-driven insights that track not only adoption rates of AI coding tools but also their impact on key productivity metrics such as lead time, deployment frequency, and code quality. These platforms leverage anomaly detection to identify risks introduced by AI-generated code and provide trend analysis to guide engineering leaders in optimizing AI tool usage. This real-time monitoring capability enables organizations to understand how AI coding tools affect developer workflows, reduce onboarding times, and accelerate feature delivery. Furthermore, by correlating AI tool usage with developer satisfaction surveys and performance data, teams can fine-tune their AI adoption strategies to maximize benefits while mitigating potential pitfalls like over-reliance or quality degradation. As AI coding continues to mature, engineering intelligence platforms are essential for providing a comprehensive, data-driven view of its evolving role in developer experience and software development success. Organizations seeking engineering intelligence should evaluate their existing technology ecosystem, team expertise, and measurement priorities. Platforms offering integrated SDLC data access typically provide faster time-to-value for engineering leaders needing immediate visibility into developer productivity. The right approach depends on your organization’s maturity, existing tools, and specific improvement priorities. With the right tools and processes in place, engineering leaders play a pivotal role in driving DX success.

Role of Engineering Leaders in DX

Engineering leaders are the driving force behind a successful Developer Experience (DX) strategy. Their vision and decisions shape the environment in which developers work, directly influencing developer productivity and the overall quality of software development. By proactively identifying friction points in the development process—such as inefficient workflows, outdated tools, or unclear documentation—engineering leaders can remove obstacles that hinder productivity and slow down the delivery of high quality code.

A key responsibility for engineering leaders is to provide developers with the right tools and technologies that streamline the development process. This includes investing in modern development environments, robust package managers, and integrated systems that reduce manual processes. By doing so, they enable developers to focus on what matters most: writing and delivering high quality code.

Engineering leaders also play a crucial role in fostering a culture of continuous improvement. By encouraging feedback, supporting experimentation, and prioritizing initiatives that improve developer experience, they help create an environment where developers feel empowered and motivated. This not only leads to increased developer productivity but also contributes to the long-term success of software projects and the organization as a whole.

Ultimately, effective engineering leaders recognize that good developer experience is not just about tools—it’s about creating a supportive, efficient, and engaging environment where developers can thrive and deliver their best work.

With strong leadership, organizations can leverage engineering intelligence to further enhance DX in the AI era.

Engineering Intelligence for DX in the AI Era

In the AI era, engineering intelligence is more critical than ever for optimizing Developer Experience (DX) and driving increased developer productivity. Advanced AI-powered analytics platforms collect and analyze data from every stage of the software development lifecycle, providing organizations with a comprehensive, real-time view of how development teams operate, where AI tools are adopted, and which areas offer the greatest opportunities for improvement.

Modern engineering intelligence platforms integrate deeply with AI coding tools, continuous integration systems, and collaboration software, aggregating metrics such as deployment frequency, lead time, AI tool adoption rates, and code review cycle times. These platforms leverage AI-driven anomaly detection and trend analysis to measure developer experience with unprecedented precision, identify friction points introduced or alleviated by AI, and implement targeted solutions that enhance developer productivity and satisfaction.

With AI-augmented engineering intelligence, teams move beyond anecdotal feedback and gut feelings. Instead, they rely on actionable, AI-generated insights to optimize workflows, automate repetitive tasks, and ensure developers have the resources and AI assistance they need to succeed. Continuous monitoring powered by AI enables organizations to track the impact of AI tools and process changes, making informed decisions that accelerate software delivery and improve developer happiness.

By embracing AI-driven engineering intelligence, organizations empower their development teams to work more efficiently, deliver higher quality software faster, and maintain a competitive edge in an increasingly AI-augmented software landscape.

As organizations grow, establishing a dedicated developer experience team becomes essential for sustained improvement.

Developer Experience Team: Structure and Best Practices

A dedicated Developer Experience (DX) team is essential for organizations committed to creating a positive and productive work environment for their developers. The DX team acts as the bridge between developers and the broader engineering organization, ensuring that every aspect of the development process supports productivity and satisfaction. A developer experience team ensures the reusability of tools and continuous improvement of developer tools.

An effective DX team brings together expertise from engineering, design, and product management. This cross-functional approach enables the team to address a wide range of challenges, from improving tool usability to streamlining onboarding and documentation. Regularly measuring developer satisfaction through surveys and feedback sessions allows the team to identify friction points and prioritize improvements that have the greatest impact.

Best practices for a DX team include promoting self-service solutions, automating repetitive tasks, and maintaining a robust knowledge base that developers can easily access. By focusing on automation and self-service, the team reduces manual processes and empowers developers to resolve issues independently, further boosting productivity.

Collaboration is at the heart of a successful DX team. By working closely with development teams, platform teams, and other stakeholders, the DX team ensures that solutions are aligned with real-world needs and that developers feel supported throughout their journey. This proactive, data-driven approach helps create an environment where developers can do their best work and drive the organization’s success.

By addressing common challenges, DX teams can help organizations avoid pitfalls and accelerate improvement.

Common DX Challenges and Solutions

Even with strong measurement foundations, development teams encounter recurring challenges when implementing DX improvements. Addressing these obstacles proactively accelerates success and helps organizations avoid common pitfalls.

Tool Fragmentation and Context Switching

When developers must navigate dozens of disconnected systems—issue trackers, documentation repositories, communication platforms, monitoring tools—context switching erodes productivity. Each transition requires mental effort that detracts from core development work.

Solution: Platform teams should prioritize integrated development environments that consolidate key workflows. This includes unified search across knowledge base systems, single-sign-on access to all development tools, and notifications centralized in one location. The goal is creating an environment where developers can access everything they need without constantly switching contexts.

Inconsistent Code Review Processes

Inconsistent review standards lead to unpredictable cycle times and developer frustration. When some reviews take hours and others take days, teams cannot reliably plan their work or maintain deployment frequency targets.

Solution: Implement AI-powered code review automation that handles routine checks—style compliance, security scanning, test coverage verification—freeing human reviewers to focus on architectural decisions and logic review. Establish clear SLAs for review turnaround and track performance against these targets. Process standardization combined with automation typically reduces cycle times by 40-60% in interesting cases where organizations commit to improvement.

Limited Visibility into Engineering Performance

Many organizations lack the data infrastructure to understand how development processes actually perform. Without visibility, engineering leaders cannot identify bottlenecks, justify investment in improvements, or demonstrate progress to stakeholders.

Solution: Consolidate SDLC data from disparate systems into a unified engineering intelligence platform. Real-time dashboards showing key metrics—deployment frequency, lead time, review cycle times—enable data-driven decision-making. Integration with existing engineering tools ensures data collection happens automatically, without requiring developers to change their workflows or report activities manually.

By proactively addressing these challenges, organizations can create a more seamless and productive developer experience.

Leading Researchers Insights on Developer Experience

Insights from leading researchers underscore the critical role of Developer Experience (DX) in achieving high levels of developer productivity and software quality. Research consistently shows that organizations with a strong focus on DX see measurable improvements in deployment frequency, lead time, and overall software development outcomes.

Researchers advocate for the use of specific metrics—such as deployment frequency, lead time, and code churn—to measure developer experience accurately. By tracking these metrics, organizations can identify bottlenecks in the development process and implement targeted improvements that enhance both productivity and code quality.

A holistic view of DX is essential. Leading experts recommend considering every stage of the developer’s journey, from the onboarding process and access to a comprehensive knowledge base, to the usability of software products and the efficiency of collaboration tools. This end-to-end perspective ensures that developers have a consistently positive experience, which in turn drives better business outcomes and market success.

By embracing these research-backed strategies, organizations can create a developer experience that not only attracts and retains top talent but also delivers high quality software at speed, positioning themselves for long-term success in a competitive market.

With these insights, organizations are well-equipped to take actionable next steps toward improving developer experience.

Conclusion and Next Steps

Developer experience directly impacts engineering velocity, code quality, and team satisfaction. Organizations that systematically measure developer experience and invest in improvements gain competitive advantages through increased developer productivity, faster time-to-market for new features, and stronger retention of engineering talent.

The connection between good developer experience and business outcomes is clear: developers who can focus on creating value rather than fighting tools deliver better software faster.

To begin improving DX at your organization:

  1. Assess current DX measurement capabilities by inventorying existing metrics and identifying gaps in visibility
  2. Identify key metrics aligned with your specific business goals—whether that’s deployment frequency, lead time reduction, or developer satisfaction improvement
  3. Implement an engineering analytics platform that provides data-driven insights across your complete development process
  4. Establish a developer experience team or assign clear ownership for DX initiatives within your platform teams

Related topics worth exploring include DORA metrics implementation strategies, measuring AI coding tool impact on developer productivity, and designing effective developer experience surveys that surface actionable insights.

Additional Resources

  • DORA State of DevOps reports provide annual benchmarking data across thousands of engineering organizations, helping you contextualize your performance against industry standards
  • Engineering metrics calculation frameworks offer standardized definitions for productivity measures, ensuring consistent measurement across teams
  • Developer experience assessment templates provide survey instruments and interview guides for gathering qualitative feedback from development teams
Platform Engineering Examples

Top Platform Engineering Examples to Enhance Your Development Strategy

Introduction

Platform engineering examples demonstrate how organizations build internal developer platforms that transform software delivery through self-service capabilities and standardized workflows. Building internal developer platforms is a strategic discipline for streamlining software development, deployment, and operations. These implementations range from open-source developer portals to enterprise-scale deployment systems, each addressing the fundamental challenge of reducing cognitive load while accelerating development velocity.

Platform engineering builds on the collaboration between development and operations teams, leveraging DevOps principles to overcome siloed workflows and improve efficiency in software delivery. This content covers enterprise-scale platform engineering examples, open-source implementations, and industry-specific use cases that have proven successful at organizations like Spotify, Netflix, and Uber. We focus on platforms that go beyond basic DevOps automation to provide comprehensive self-service tools and developer experience improvements. Engineering leaders, platform teams, and DevOps professionals evaluating platform engineering strategies will find practical patterns and measurable outcomes to inform their own implementations.

The rise of platform engineering is a response to the confusion and friction created by the DevOps movement. However, the lack of a clear model for implementing platform engineering can make it difficult for organizations to define their approach.

Direct answer: Platform engineering examples include Spotify’s Backstage developer portal for building developer portals and service catalogs, Netflix’s Spinnaker multi-cloud deployment platform, Uber’s Michelangelo ML platform, and Airbnb’s Kubernetes-based infrastructure platform—each demonstrating how platform engineering teams create unified interfaces that empower developers to provision resources and deploy applications independently.

By exploring these implementations, you will gain:

  • Understanding of proven platform patterns from top-performing engineering organizations
  • Implementation approaches for infrastructure provisioning, deployment pipelines, and developer self-service
  • Measurable benefits including developer productivity gains and infrastructure cost reduction
  • Lessons learned and solutions to common platform engineering challenges

Understanding Platform Engineering Fundamentals

An internal developer platform represents a unified toolchain that abstracts underlying infrastructure complexity and enables developer self-service across the software development lifecycle. These platforms are designed to provide developers with access to tools, automation, and self-service capabilities, streamlining workflows and improving efficiency. Platform engineering teams develop and maintain internal developer platforms (IDPs) that allow developers to work independently.

This approach directly addresses modern software delivery challenges where development teams face increasing complexity from microservices, cloud infrastructure, and compliance requirements. By reducing cognitive load, platform engineering enables developers to code, build, test, and release software without help from other departments. Platform engineering also creates feedback loops with developers who use the platform, allowing teams to identify new challenges and update the platform accordingly. This enables developers to focus on writing code and solving business problems rather than navigating complex infrastructure.

Benefits of Platform Engineering

Platform engineering delivers significant benefits to organizations aiming to accelerate software development and improve engineering performance. By introducing self-service capabilities, platform engineering empowers development teams to independently handle infrastructure provisioning, deployment, and environment management. This autonomy reduces reliance on operations teams, streamlining workflows and minimizing bottlenecks that can slow down the software development lifecycle.

Developer Autonomy and Self-Service

A key advantage is the reduction of cognitive load for developers. With a well-designed internal developer platform, developers can focus on writing code and solving business problems, rather than navigating complex infrastructure or manual tasks. This focus leads to measurable gains in developer productivity and a more satisfying developer experience.

Reducing Cognitive Load

Platform engineering also plays a crucial role in reducing technical debt and improving infrastructure management. Standardized workflows and automation tools ensure that best practices are consistently applied, making it easier to maintain and evolve systems over time. As a result, organizations benefit from faster release cycles, improved software quality, and more efficient use of resources. Ultimately, platform engineering enables teams to deliver software faster, more reliably, and with greater confidence.

Standardization and Automation

Standardization and automation are at the core of platform engineering. By implementing automated workflows and standardized processes, organizations can ensure consistency, reduce errors, and accelerate the software delivery lifecycle. Automation tools and standardized templates help teams avoid reinventing the wheel, allowing them to focus on innovation and value creation.

Role of the Platform Engineer

The platform engineer is at the heart of building and maintaining the internal developer platform that powers modern software development. Their primary mission is to create a self-service model that enables developers to provision infrastructure, deploy applications, and monitor performance without unnecessary friction. By designing intuitive interfaces and automating complex processes, platform engineers empower developers to focus on writing code and delivering value, rather than managing infrastructure.

Platform engineers work closely with development teams to understand their needs and ensure the platform aligns with real-world workflows. They also collaborate with operations, security, and other teams to guarantee that the platform is secure, scalable, and compliant with organizational standards. This cross-functional approach ensures that the internal developer platform supports the entire development process, from initial code to production deployment.

By enabling self-service and reducing manual dependencies, platform engineers drive improvements in developer productivity and help organizations achieve faster, more reliable software delivery. Their work is essential to building a culture where developers are empowered to innovate and deliver at scale.

Core Components of Platform Engineering Examples

Developer portals and service catalogs form the centralized interface where developers interact with platform capabilities. Backstage is a popular framework for building self-service portals that form the basis of your IDP. These components provide a unified interface for discovering services, accessing documentation, and initiating self-service workflows. A well-designed service catalog allows engineering teams to browse available cloud resources, deployment pipelines, and internal tools without specialized knowledge of underlying systems. Better visibility into resources allows organizations to manage cloud spend and eliminate underutilized environments.

These platform components work together to create what platform engineering teams call “golden paths”—pre-approved, standardized workflows that guide and enable developers through common tasks while enforcing security policies and best practices automatically.

Self-Service Capabilities and Automation

Self-service capabilities encompass infrastructure provisioning, CI/CD pipelines, and environment management that developers can access without waiting for operations teams. When implemented correctly, these self-service platforms—often the result of building internal developer platforms—reduce bottlenecks by allowing developers to provision cloud resources, create deployment pipelines, and manage their own cloud account configurations independently.

Humanitec is a popular SaaS solution for building internal developer platforms at an enterprise scale.

The relationship between self-service access and developer productivity is direct: organizations with mature self-service models report significantly higher deployment frequency and faster time-to-market. This automation also reduces manual tasks that consume operations teams’ time, enabling them to focus on platform improvements rather than ticket resolution. Platform engineering helps organizations scale up with automation by automating testing, delivery, and other key functions.

Understanding these core concepts prepares us to examine how leading organizations have implemented these patterns at scale.

Infrastructure Management in Platform Engineering

Effective infrastructure management is a cornerstone of successful platform engineering. Platform engineering teams are responsible for architecting, provisioning, and maintaining the underlying infrastructure that supports the internal developer platform. This includes managing cloud resources such as compute, storage, and networking, as well as ensuring that the infrastructure is secure, resilient, and scalable to meet the needs of engineering teams.

To streamline infrastructure provisioning and configuration management, platform engineers leverage IaC tools like Terraform, which enable consistent, repeatable, and auditable infrastructure changes. These tools help automate the deployment and management of cloud resources, reducing manual intervention and minimizing the risk of errors.

Ongoing monitoring and maintenance are also critical to infrastructure management. Platform engineering teams implement robust monitoring solutions to track infrastructure health, quickly identify issues, and ensure high availability for developers. By maintaining a reliable and efficient infrastructure foundation, platform engineering teams enable development teams to focus on building and shipping software, confident that the underlying systems are robust and well-managed.

Cloud Services Integration Strategies

Integrating cloud services is a vital aspect of platform engineering, enabling organizations to harness the scalability and flexibility of modern cloud providers. Platform engineering teams design strategies to seamlessly incorporate services from AWS, Azure, Google Cloud, and others into the internal developer platform, providing a unified interface for developers to access and manage cloud resources.

A key focus is on delivering self-service access to cloud resources, allowing engineering teams to provision and manage their own environments without waiting on manual approvals. Service catalogs and multi-cluster management capabilities are often built into the platform, giving developers a centralized view of available cloud services and simplifying the process of deploying applications across multiple environments.

By integrating cloud services into the internal developer platform, organizations can improve developer productivity, reduce operational overhead, and optimize costs. Platform engineering teams ensure that these integrations are secure, compliant, and aligned with organizational policies, enabling developers to innovate quickly while maintaining control over cloud infrastructure.

DevOps Automation in Platform Engineering

DevOps automation is a foundational element of platform engineering, enabling organizations to streamline the software development lifecycle and deliver software with greater speed and reliability. Platform engineering teams implement automation tools such as Jenkins, GitLab CI/CD, and Argo CD to automate key processes, including continuous integration, deployment pipelines, and application performance monitoring.

By automating repetitive and error-prone tasks, platform engineers free developers to focus on writing code and building features, rather than managing infrastructure or deployment logistics. Automation also reduces the risk of human error, ensures consistency across environments, and accelerates the path from code commit to production release.

A well-automated internal developer platform supports the entire development process, from code integration to deployment and monitoring, providing engineering teams with the tools they need to deliver high-quality software efficiently. Through DevOps automation, platform engineering teams drive improvements in developer productivity, reduce costs, and enable organizations to respond rapidly to changing business needs.

Enterprise Platform Engineering Examples

Moving from foundational concepts to real-world implementations reveals how platform engineering principles translate into production systems serving thousands of developers daily. By 2026, it is predicted that 80% of large software engineering organizations will have established dedicated platform teams.

Patterns observed in enterprise platform engineering examples include self-service portals, automated infrastructure provisioning, and robust monitoring. Managing technical debt is a significant challenge in platform engineering, requiring ongoing attention to maintain system health and agility.

As organizations adopt and evolve their platform patterns, continuous learning becomes essential. Teams must adapt their platforms over time to keep pace with changing technology, improve developer experience, and ensure resilience.

Spotify’s Backstage: Open-Source Developer Portal

Spotify developed Backstage as an open source platform for building developer portals that now serves as the foundation for internal developer platforms across the industry. The platform provides a service catalog, documentation management, and an extensible plugin ecosystem that enables over 1,000 developers at Spotify to discover and use internal tools through a single interface.

Backstage exemplifies the product mindset in platform engineering—it treats the developer experience as a first-class concern, providing a unified interface where developers can find services, read documentation, and provision resources without context-switching between multiple tools. The plugin architecture demonstrates how effective platform engineering balances standardization with extensibility.

Netflix’s Spinnaker: Multi-Cloud Deployment Platform

Netflix developed Spinnaker as an open-source, multi-cloud continuous delivery platform supporting deployments across AWS, GCP, and Azure with automated canary deployments and rollback capabilities. This devops automation platform handles the complexity of multi-cluster management and enables development teams to release software with confidence through automated testing and gradual rollouts.

Spacelift orchestrates IaC tools, including Terraform, OpenTofu, and Ansible, to deliver secure, cost-effective, and scalable infrastructure fast.

Spinnaker demonstrates key features of enterprise platform engineering: it abstracts cloud services complexity while providing the control plane needed for safe, repeatable deployments and is designed to provide developers with streamlined deployment workflows. The platform’s canary analysis automatically compares new deployments against production baselines, reducing the risk of problematic releases reaching users.

Airbnb’s Infrastructure Platform

Airbnb built a Kubernetes-based platform with standardized workflows and developer self-service capabilities serving over 2,000 engineers. The platform provides infrastructure provisioning, deployment pipelines, and environment management through self-service interfaces that reduce dependency on specialized infrastructure teams.

Key patterns emerging from these enterprise examples include: treating platforms as products with continuous feedback loops, providing self-service capabilities that reduce cognitive load, building on open-source foundations while customizing for organizational needs, and measuring platform success through developer productivity metrics.

These enterprise implementations demonstrate patterns applicable across industries, while specialized domains require additional platform considerations.

Specialized Platform Engineering Implementations

Building on enterprise platform patterns, domain-specific platforms address unique requirements for machine learning workflows, financial services compliance, and performance measurement. By 2026, AI Infrastructure is anticipated to manage AI/ML models, including GPU orchestration and model versioning. Additionally, AI-Native Agentic Infrastructure will include AI agents that autonomously manage deployments and resource allocation. These specialized platforms must embrace continuous learning to adapt to evolving AI/ML requirements and ensure ongoing improvement in productivity, resilience, and developer experience.

Machine Learning Platform Examples

Machine learning platforms extend core platform engineering concepts to support data scientists and ML engineers with specialized workflows for model training, deployment, and monitoring. Successful ML platform engineering requires close collaboration between development and operations teams to streamline ML workflows and reduce friction in software delivery.

Uber’s Michelangelo provides an end-to-end ML platform handling feature engineering, model training, deployment, and production monitoring. The platform enables data scientists to train and deploy models without deep infrastructure expertise, demonstrating how self-service platforms accelerate specialized workflows.

Airbnb’s Bighead focuses on feature engineering and model serving, providing standardized pipelines that ensure consistency between training and production environments. The platform exemplifies how platform engineering reduces cognitive load for specialized teams.

LinkedIn’s Pro-ML delivers production ML capabilities with automated pipelines that handle model validation, deployment, and monitoring at scale. The platform demonstrates infrastructure management patterns adapted for ML workloads.

Pinterest’s ML Platform integrates experimentation and A/B testing capabilities directly into the ML workflow, showing how platform engineering tools can combine multiple capabilities into cohesive developer experiences.

A mature platform enhances the effectiveness of AI in organizations, while the absence of such platforms can lead to dysfunction.

Financial Services Platform Examples

Financial services platforms prioritize security policies, regulatory compliance, and audit capabilities alongside developer productivity.

Goldman Sachs’ Marcus platform demonstrates a regulatory compliance and security-first approach to platform engineering, embedding compliance checks directly into deployment pipelines and infrastructure provisioning workflows.

JPMorgan’s Athena combines risk management and trading capabilities with real-time processing requirements, showing how platform engineering handles performance-critical workloads while maintaining developer self-service.

Capital One’s cloud platform integrates DevSecOps capabilities with automated security scanning throughout the software development lifecycle, demonstrating how platform teams embed security into developer workflows without creating friction.

Platform Engineering Measurement and Analytics

Metric Category Example Implementation Business Impact
Developer Velocity DORA metrics integrated into Spotify’s platform telemetry Achieved 40% improvement in deployment frequency through automated pipeline optimizations and feedback loops
Platform Adoption Granular self-service usage analytics via Netflix’s telemetry and logging infrastructure Attained 85% developer adoption rate by monitoring feature utilization and iterative UX improvements
Cost Optimization Real-time resource utilization dashboards leveraging Airbnb’s cloud cost management APIs Delivered 30% infrastructure cost reduction through dynamic environment lifecycle management and rightsizing
Application Performance Distributed tracing and error rate monitoring across multi-service platforms using OpenTelemetry Reduced mean time to recovery (MTTR) by enabling rapid fault isolation and automated rollback mechanisms

Selecting appropriate metrics depends on organizational priorities: early-stage platform teams should focus on adoption rates, while mature platforms benefit from measuring developer velocity improvements and infrastructure health. Measuring how platforms enable developers—by providing high-quality tools and reducing repetitive tasks—not only improves developer satisfaction but is also critical for talent retention. These measurements connect directly to demonstrating platform engineering ROI to leadership.

Understanding these implementation patterns prepares teams to address common challenges that arise during platform engineering initiatives.

Common Challenges and Solutions

Platform engineering implementations across organizations reveal consistent challenges with proven solutions. One major challenge is keeping up with evolving technologies, which requires platform engineers to stay updated and adapt quickly.

To address these challenges, organizations often implement solutions such as automated compliance checks, which lead to improved operational reliability and proactive security. Additionally, fostering a culture of continuous learning is essential, as it enables platform engineers to engage in ongoing education and adaptation, ensuring they remain effective in the face of rapid technological change.

Keeping Up with Evolving Technologies

One major challenge is keeping up with evolving technologies, which requires platform engineers to stay updated and adapt quickly. To address this, organizations often implement solutions such as automated compliance checks, which lead to improved operational reliability and proactive security. Additionally, fostering a culture of continuous learning is essential, as it enables platform engineers to engage in ongoing education and adaptation, ensuring they remain effective in the face of rapid technological change.

Developer Adoption and Change Management

Development teams often resist adopting new platforms, particularly when existing workflows feel familiar. Successful organizations like Spotify implement gradual migration strategies that demonstrate immediate value, provide comprehensive documentation, and gather continuous feedback. Starting with pilot teams and expanding based on proven success builds organizational confidence in the platform approach.

Platform Complexity and Cognitive Load

Platforms can inadvertently increase complexity if they expose too many options or require extensive configuration. Design golden paths that handle 80% of use cases simply while providing escape hatches for teams with specialized needs. Regularly assess developer experience metrics and simplify interfaces based on usage patterns. Netflix’s approach of providing sensible defaults with optional customization exemplifies this balance.

Scalability and Performance

As platform adoption grows, infrastructure changes must accommodate increasing demand without degrading developer experience. Build modular architectures from the start, implement proper observability for infrastructure health monitoring, and plan for horizontal scaling. Netflix and Uber demonstrate how treating scalability as a continuous concern rather than an afterthought prevents future growth from becoming a crisis.

These solutions inform practical next steps for organizations beginning or maturing their platform engineering journey.

Best Practices for Platform Engineering

Platform engineering is most effective when guided by a set of proven best practices that help organizations maximize developer productivity and streamline the software development process. Platform engineering teams that prioritize these practices are better equipped to build internal developer platforms that deliver real value to engineering teams and the business as a whole. Here are essential best practices for successful platform engineering:

Adopt a Product Mindset

Treat the internal developer platform as a product with developers as your primary customers. This involves continuous user research, soliciting feedback, iterative improvements, and clear roadmaps to ensure the platform evolves in alignment with developer needs and business goals.

Prioritize Developer Experience and Reduce Cognitive Load

Design platform components and workflows that minimize complexity and cognitive load for developers. Provide intuitive self-service access, sensible defaults, and escape hatches for edge cases to balance standardization with flexibility.

Build Incrementally with Golden Paths

Create standardized, automated "golden paths" that cover the majority of use cases, enabling developers to complete common tasks easily and reliably. Allow for exceptions and customization to accommodate specialized workflows without compromising platform stability.

Foster Cross-Functional Collaboration

Engage development, operations, security, and compliance teams early and continuously. Collaboration ensures the platform meets diverse requirements and integrates seamlessly with existing tools and processes.

Automate Infrastructure Provisioning and Deployment

Leverage infrastructure as code (IaC) tools and CI/CD pipelines to automate repetitive tasks, enforce security policies, and accelerate software delivery. Automation reduces manual errors and frees teams to focus on innovation.

Measure and Monitor Platform Adoption and Developer Productivity

Establish clear metrics such as deployment frequency, lead time, and self-service usage rates. Use these insights to validate platform effectiveness, identify friction points, and guide continuous improvement efforts.

Manage Technical Debt and Ensure Scalability

Regularly address technical debt to maintain platform health and performance. Design modular, scalable architectures that can grow with organizational needs, supporting multi-cluster management and evolving cloud infrastructure.

Embrace Continuous Learning and Adaptation

Stay current with emerging technologies, tools, and agile methodologies. Encourage platform teams to engage in ongoing education and adopt DevOps principles to enhance platform capabilities and developer satisfaction.

By following these best practices, platform engineering teams can create robust, user-centric internal developer platforms that empower development teams, improve software delivery, and support future growth.

Conclusion and Next Steps

Successful platform engineering examples share common patterns: developer-centric design that reduces cognitive load, gradual adoption strategies that demonstrate value before requiring migration, and continuous measurement of developer productivity and platform adoption. Organizations like Spotify, Netflix, Airbnb, and Uber have proven that investment in internal developer platforms delivers measurable improvements in deployment frequency, developer satisfaction, and infrastructure cost efficiency.

To begin applying these patterns:

  1. Assess current developer pain points through surveys and workflow analysis to identify high-impact platform opportunities
  2. Identify platform engineering patterns from these examples that address your organization’s specific challenges
  3. Start with pilot implementations using essential tools like Backstage for developer portals or Kubernetes for container orchestration
  4. Establish metrics for developer velocity and platform adoption before launch to demonstrate value

Related topics worth exploring include platform team organization models for structuring platform engineering teams, tool selection frameworks for evaluating top platform engineering tools, and ROI measurement approaches for justifying continued platform investment to leadership.

Measuring Engineering Productivity

The Essential Guide to Measuring Engineering Productivity Effectively

Introduction

Measuring engineering productivity accurately determines whether your software development teams deliver value efficiently or burn resources without meaningful output. Measuring developer productivity is inherently difficult due to the complex and collaborative nature of software development. Engineering productivity measurement has evolved from counting lines of code to sophisticated frameworks that capture delivery speed, code quality, team collaboration, and developer experience across the entire development process.

Traditional metrics often fail to capture the true productivity of engineering teams, leading to misconceptions about their performance. Modern approaches, such as DORA and SPACE, emphasize the importance of capturing nuanced, holistic perspectives—often through surveys and human feedback—highlighting the complexities and the need for a comprehensive approach. The SPACE framework includes five dimensions: satisfaction and well-being, performance, activity, communication and collaboration, and efficiency and flow metrics.

This guide covers measurement frameworks, key metrics, implementation strategies, and common pitfalls specifically for engineering teams building software products. The target audience includes engineering leaders, VPs of Engineering, and development managers who need data-driven insights to optimize their engineering organization. Effective measurement matters because it drives faster time-to-market, identifies bottlenecks in your software development process, improves resource allocation, and supports sustainable team's performance. Improved cycle times and delivery speed can also lead to better customer satisfaction by enabling faster delivery of features and higher service quality.

A mixed-methods approach—combining both qualitative and quantitative metrics—can provide a fuller understanding of developer productivity.

Direct answer: Engineering productivity is assessed through a broad combination of metrics and qualitative insights. Core quantitative metrics include DORA metrics—deployment frequency, lead time for changes, mean time to recovery, and change failure rate—that measure key aspects of software delivery performance. Alongside these, development flow indicators such as cycle time, pull request efficiency, and code review metrics provide detailed visibility into the development process. Additionally, measuring engineering productivity incorporates qualitative data gathered from developer experience surveys, team collaboration assessments, and satisfaction and well-being metrics. This comprehensive approach captures both the technical outputs and human factors influencing productivity, enabling engineering leaders to gain meaningful insights into their teams' performance, identify bottlenecks, optimize workflows, and improve overall engineering effectiveness.

After reading this guide, you will:

  • Understand the major measurement frameworks used by high-performing engineering teams
  • Know how to select the right engineering productivity metrics for your team’s maturity level
  • Have a step-by-step implementation plan for tracking progress systematically
  • Recognize common measurement mistakes and how to avoid them
  • Build a continuous improvement process driven by actionable insights

Understanding Engineering Productivity Measurement

Engineering productivity measurement quantifies how effectively your development teams convert time and resources into customer-impacting software outcomes. This goes beyond simple output counting to assess the entire system of software delivery, from code commits to production deployment to incident recovery. Understanding a team's capacity to complete work within a sprint or project cycle is crucial, as it directly relates to measuring throughput and forecasting future performance. To do this well, it’s important to identify metrics that capture both qualitative and system aspects, especially in complex areas like technical debt where human judgment is often required.

Additionally, the link between inputs and outputs in software development is considerably less clear compared to other business functions, which makes measurement particularly challenging.

What is Engineering Productivity

Engineering productivity represents the delivery of high-quality software efficiently while maintaining team health and sustainability. This definition intentionally combines multiple dimensions: delivery speed, software quality, and developer experience.

An important aspect of team productivity is measuring the rate at which new developers contribute, as well as their effective onboarding and integration into the team.

Productivity differs from velocity and raw output in important ways. Velocity measures work completed per sprint (often in story points), but high velocity with poor code quality creates technical debt that slows future work. Raw output metrics like lines of code or number of commits can be gamed and fail to capture actual value delivered. Engineering productivity instead focuses on outcomes that matter to the business and sustainability factors that matter to the team.

When considering qualitative metrics, it's important to note that the social sciences field itself lacks authoritative definitions for qualitative measurement, leading to ambiguity and variability in how such metrics are interpreted.

Why Measuring Engineering Productivity Matters

For the business, measuring productivity enables faster time-to-market by identifying bottlenecks in the development process, better resource allocation through objective measurements of team capacity, and improved strategic planning based on historical data rather than guesswork. Analyzing the review process, such as code reviews and weekly PR reviews, can highlight bottlenecks and improve workflow efficiency.

For the engineering team, measurement reveals friction in team workflows, supports developer productivity improvements, and enables data-driven decision making about process changes. Understanding the developer workflow and integrating feedback mechanisms at key stages—such as through transactional surveys—ensures real-time feedback is gathered from developers at critical touchpoints. Many engineering leaders use measurement data to advocate for investments in developer tools, infrastructure, or headcount.

Understanding why measurement matters leads naturally to the question of what to measure—the specific engineering productivity metrics that provide meaningful insights.

Understanding Engineering Organizations

Engineering organizations are dynamic and multifaceted, requiring thoughtful management to achieve high levels of productivity and efficiency. Measuring engineering productivity metrics is essential for understanding how effectively teams deliver value and where improvements can be made. These metrics go beyond simple output—they encompass development speed, code quality, team collaboration, and the efficient use of resources.

By systematically tracking software engineering productivity, engineering leaders gain visibility into the strengths and weaknesses of their engineering processes. This enables them to make informed decisions that drive continuous improvement, enhance software quality, and foster better team collaboration. High-performing engineering organizations prioritize the measurement of productivity metrics to ensure that their development efforts align with business goals and deliver maximum impact. Ultimately, a data-driven approach to measuring software engineering productivity empowers organizations to optimize workflows, reduce waste, and accelerate business growth.

Role of the Engineering Leader

The engineering leader plays a pivotal role in shaping the productivity and efficiency of the engineering team. Their responsibilities extend beyond technical oversight—they must ensure that productivity metrics are aligned with broader business objectives and that the team is set up for sustainable success. Effective engineering leaders cultivate a culture of continuous improvement, encouraging regular review of productivity metrics and open discussions about opportunities for enhancement.

Leveraging project management tools, code repositories, and analytics platforms, engineering leaders can track engineering productivity, monitor code quality, and identify areas where technical debt may be accumulating. By focusing on these key areas, leaders can allocate resources more effectively, support their teams in overcoming obstacles, and drive improvements in engineering efficiency. Prioritizing code quality and proactively managing technical debt ensures that the engineering team can deliver high-quality software while maintaining the agility needed to meet evolving business needs.

Key Engineering Productivity Metrics

Building on the measurement foundations above, selecting the right metrics requires understanding several complementary categories. No single metric captures engineering productivity completely; instead, different metrics address distinct aspects of delivery practices and team performance.

DORA Metrics

The DORA metrics emerged from DevOps Research and Assessment studies analyzing thousands of development teams. These four key metrics assess software delivery performance:

Deployment frequency measures how often your team releases code to production. Higher frequency indicates faster iteration cycles and reduced batch sizes, which lower risk and accelerate feedback loops.

Lead time for changes measures the time from code commit to production deployment. This captures your entire delivery pipeline efficiency, including code reviews, automated testing, and release process steps.

Mean time to recovery (MTTR) measures how quickly your team can restore service after a production failure. Low MTTR indicates operational maturity and effective incident response.

Change failure rate measures the percentage of deployments that cause incidents requiring remediation. This reflects code quality, testing effectiveness, and the reliability of your deployment practices.

DORA metrics connect directly to business outcomes—teams with elite performance across these metrics deploy faster, recover quicker, and ship more reliably than lower performers.

Development Flow Metrics

Beyond DORA, development flow metrics reveal how work moves through your engineering processes:

Cycle time measures elapsed time from work starting to reaching production. Breaking this into coding time, pickup time, review time, and deploy time helps pinpoint exactly where delays occur.

Pull request metrics include time to first review, review iterations, merge frequency, and PR size. Large, long-lived pull requests often indicate process problems and increase integration risk.

Code review efficiency tracks how quickly reviews happen and how many iterations are needed. Slow code reviews create developer waiting time and context-switching costs.

These flow metrics help identify development pipeline bottlenecks that slow overall delivery without necessarily appearing in DORA metrics.

Code Quality and Technical Metrics

Quality metrics connect to long-term engineering productivity sustainability:

Code complexity measures like cyclomatic complexity identify code that becomes increasingly difficult to maintain. High complexity correlates with higher defect rates and slower modification.

Defect rates track bugs found in production versus caught earlier. Bug fixes consume engineering capacity that could otherwise build new features.

Technical debt indicators include aged dependencies, deprecated APIs, and low test coverage areas. Unmanaged technical debt gradually degrades team velocity.

Automated testing coverage measures what percentage of code has automated test verification. Higher coverage generally enables faster, safer deployments.

With these metric categories understood, the next step involves practical implementation—setting up systems to actually track engineering productivity in your organization.

Implementing Engineering Productivity Measurement

Moving from metric understanding to measurement reality requires systematic implementation. The following approach applies to engineering organizations of various sizes, though larger teams typically need more automation.

Step-by-Step Measurement Implementation

This systematic approach works for teams beginning measurement programs or expanding existing capabilities:

  1. Assess current toolchain and data sources: Inventory your version control systems, CI/CD pipelines, project management tools, and issue tracking systems. Most engineering productivity metrics derive from data already generated by these systems.
  2. Define measurement objectives aligned with business objectives: Clarify what questions you need to answer. Are you identifying bottlenecks? Justifying headcount? Improving deployment reliability? Different goals require different metrics. It is important to identify metrics that align with business objectives, including both qualitative and system metrics, especially in complex areas like technical debt where human judgment is essential.
  3. Select appropriate metrics based on team maturity: Newer teams should start with 3-5 core metrics rather than attempting comprehensive measurement immediately. DORA metrics provide a solid starting point for most software engineering teams.
  4. Set up data collection and automation: Manual tracking creates unsustainable overhead. Automate data extraction from your development tools—Git, CI/CD systems, and project management tools—through APIs or integrated platforms.
  5. Establish baselines and benchmarking processes: Before setting targets, understand your current state. Baseline data for 4-6 weeks provides the foundation for meaningful improvement tracking.
  6. Create dashboards and reporting mechanisms: Visibility drives behavior. Build dashboards that surface key performance indicators to team leads and individual contributors, not just executives.
  7. Implement regular review and improvement cycles: Metrics without action are vanity metrics. Establish recurring reviews where teams discuss measurements and identify improvement actions.

Regular performance evaluation and feedback help individuals identify areas for improvement and support their professional growth.

Measurement Platform Comparison

Different approaches to measuring software engineering productivity offer distinct trade-offs:

Approach Data Sources Implementation Effort Insights Provided
Manual Tracking Git, Jira, Spreadsheets High Basic metrics, limited automation
Open Source Tools GitHub API, GitLab CI/CD Medium Custom dashboards, technical setup required
Engineering Intelligence Platforms SDLC tools integration Low Comprehensive insights, automated analysis

Manual tracking works for small teams starting out but becomes unsustainable as teams grow. Logs data extraction and spreadsheet maintenance consume engineering time better spent elsewhere.

Open source tools provide flexibility and low cost but require ongoing maintenance and integration work. Teams need engineers comfortable building and maintaining custom solutions.

Engineering intelligence tools automate data collection and analysis across multiple development platforms, providing comprehensive dashboards that deliver actionable insights to improve engineering productivity.

Optimizing Engineering Processes

Optimizing engineering processes is fundamental to improving both productivity and efficiency within software development teams. This involves streamlining workflows, ensuring effective resource allocation, and fostering a culture where learning and improvement are ongoing priorities. By closely tracking key metrics such as deployment frequency, lead time, and code quality, engineering teams can pinpoint bottlenecks and identify areas where the development process can be refined.

In addition to quantitative metrics, gathering qualitative data—such as feedback from developer surveys—provides valuable context and deeper insights into developer productivity. Combining these data sources allows engineering organizations to form a comprehensive understanding of their strengths and challenges, enabling targeted improvements that enhance the overall development process. Regular code reviews, robust version control systems, and effective issue tracking systems are essential tools for identifying process inefficiencies and ensuring that engineering practices remain aligned with business objectives. By continuously optimizing engineering processes, teams can deliver higher-quality software, respond more quickly to changing requirements, and drive sustained business success.

Typo: An Engineering Intelligence Platform

Typo is an engineering intelligence (SEI) tool designed to provide comprehensive insights into your engineering team's productivity and workflow. By integrating seamlessly with integrated development environments, project management tools, version control systems, and communication platforms, Typo consolidates data across your software development process.

Typo enables engineering leaders to track key engineering productivity metrics such as deployment frequency, lead time, code review efficiency, and issue resolution rates. It helps identify bottlenecks in the development process, monitor code quality, and assess team collaboration, all within a unified dashboard.

With Typo, organizations can move beyond fragmented data silos to gain a holistic, real-time view of engineering performance. This allows for data-driven decision-making to improve engineering efficiency, optimize resource allocation, and align engineering efforts with business objectives without the need for custom development or manual data aggregation.

typo AI dora metrics

Best Practices for Measurement

Measuring engineering productivity effectively requires a thoughtful, structured approach that goes beyond simply collecting data. Engineering leaders should focus on best practices that ensure measurement efforts translate into meaningful improvements for both the team and the business.

Start by identifying and tracking key engineering productivity metrics that align with your team’s goals and maturity. Metrics such as deployment frequency, lead time, and code quality offer valuable insights into the software development process and help pinpoint areas where engineering efficiency can be improved. Regularly reviewing these productivity metrics enables teams to spot trends, identify bottlenecks, and make informed decisions about workflow optimization.

It’s essential to balance quantitative data—like cycle time, bug rates, and throughput—with qualitative data gathered from developer surveys, feedback sessions, and retrospectives. Qualitative insights provide context that numbers alone can’t capture, revealing the human factors that influence developer productivity, such as team morale, communication, and satisfaction with the development process.

Leverage project management tools and dashboards to automate data collection and reporting. This not only reduces manual overhead but also ensures that key metrics are consistently tracked and easily accessible. Integrating these tools with your version control systems and CI/CD pipelines allows for real-time monitoring of engineering productivity metrics, making it easier to respond quickly to emerging issues.

Finally, foster a culture of continuous improvement by regularly sharing measurement results with the team, encouraging open discussion, and collaboratively setting goals for future progress. By combining robust quantitative analysis with qualitative feedback, engineering leaders can drive sustained improvements in productivity, team health, and software quality.

Driving Business Success

Engineering productivity is a critical driver of business success, especially in today’s fast-paced software engineering landscape. By systematically measuring software engineering productivity and tracking progress against key performance indicators, engineering leaders can ensure that their teams are not only delivering high-quality software but also contributing directly to broader business objectives.

Aligning engineering productivity efforts with business goals starts with selecting the right metrics. While quantitative indicators like lines of code, code commits, and code reviews provide a snapshot of output and workflow efficiency, it’s equally important to consider qualitative metrics such as team collaboration, communication, and the ability to tackle complex tasks. Many engineering leaders recognize that a balanced approach—combining both quantitative and qualitative metrics—yields the most actionable insights into team performance.

Tracking these metrics over time allows teams to establish baselines, identify bottlenecks, and implement targeted initiatives to improve productivity. For example, monitoring technical debt and code quality helps prevent future slowdowns, while regular code reviews and the use of integrated development environments and version control systems streamline the development process and reduce friction.

Resource allocation is another area where measuring software engineering productivity pays dividends. By understanding where time and effort are being spent, leaders can optimize team capacity, focus on high-impact projects, and ensure that the right resources are available to address critical issues. This leads to more efficient workflows, faster delivery of features, and ultimately, higher customer satisfaction.

Issue tracking systems and automated dashboards further support these efforts by providing real-time visibility into team progress and highlighting areas for improvement. By leveraging these tools and maintaining a focus on both business objectives and team well-being, engineering organizations can drive continuous improvement, deliver better software, and achieve sustained business growth.

Common Challenges and Solutions

Even well-designed measurement programs encounter obstacles. Understanding typical challenges helps you prepare and respond effectively.

Metric Gaming and Unintended Consequences

When individual metrics become performance targets, engineers may optimize for the metric rather than the underlying goal. Counting lines of code encourages verbose implementations; emphasizing commit frequency encourages trivial commits.

Solution: Implement metric portfolios rather than single KPIs. Track quantitative metrics alongside qualitative metrics and survey data. Focus measurement discussions on team-level patterns rather than individual developer performance, which reduces gaming incentives while still providing meaningful insights.

Data Silos and Incomplete Visibility

Engineering work spans multiple systems—code reviews happen in GitHub, task tracking in Jira, communication in Slack. Analyzing each system separately misses the connections between them.

Solution: Integrate multiple data sources through engineering intelligence platforms that combine quantitative data from code commits, issue tracking systems, and communication tools. Establish data governance processes that maintain quality across sources.

Developer Resistance to Measurement

Engineers who feel surveilled rather than supported will resist measurement initiatives and may even leave such a team. Poorly implemented metrics programs damage trust and team collaboration.

Solution: Emphasize that measurement serves team improvement, not individual surveillance. Involve developers in identifying metrics that matter to them—time spent actively working on complex tasks versus stuck in meetings, for example. Ensure complete transparency in how data is collected and used.

Analysis Paralysis from Too Many Metrics

Tracking every possible metric creates dashboard overload without improving productivity. Teams drown in data without gaining actionable insights.

Solution: Start with 3-5 core metrics aligned with your primary improvement goals. Expand gradually based on insights gained and questions that arise. Focus on metrics that directly inform decisions rather than interesting-but-unused data points.

Lack of Actionable Insights

Numbers without interpretation don’t drive improvement. A cycle time chart means nothing without understanding what causes observed patterns.

Solution: Combine quantitative data with qualitative data from retrospectives and 1:1 conversations. When metrics show problems, investigate root causes through developer feedback. Track whether interventions actually improve measurements over time.

Overcoming these challenges positions your measurement program to deliver lasting value rather than becoming another abandoned initiative.

Conclusion and Next Steps

Effective engineering productivity measurement requires balanced metrics covering delivery speed, code quality, and developer experience. Single metrics inevitably create blind spots; portfolios of complementary measures provide actionable insights while reducing gaming risks. Implementation matters as much as metric selection—automated data collection, clear baselines, and regular improvement cycles distinguish successful programs from measurement theater.

Immediate next steps:

  1. Assess your current measurement gaps—what do you track today, and what questions can’t you answer?
  2. Select an initial metric set, starting with DORA metrics if you don’t already measure them
  3. Evaluate measurement tools based on your integration needs and engineering capacity
  4. Establish baseline data collection for your chosen metrics over 4-6 weeks

Related topics worth exploring: Developer experience optimization addresses the qualitative factors that quantitative metrics miss. AI coding assistant impact measurement is becoming increasingly relevant as teams adopt GitHub Copilot and similar tools. Software delivery forecasting uses historical data to predict future team capacity and delivery timelines.

Additional Resources

  • DORA State of DevOps reports provide industry benchmarking data for comparing your engineering performance
  • SPACE framework documentation from GitHub, University of Victoria, and Microsoft Research offers deeper theoretical grounding for multidimensional measurement
  • Integration guides for connecting popular version control systems, CI/CD platforms, and project management tools to measurement dashboards

developer productivity tools

Developer Productivity Tools Guide in 2026

Introduction

Developer productivity tools help software engineers streamline workflows, automate repetitive tasks, and focus more time on actual coding. With the rapid evolution of artificial intelligence, AI-powered tools have become central to this landscape, transforming how software development teams navigate increasingly complex codebases, tight deadlines, and the demand for high-quality code delivery. These AI-powered developer productivity tools are a game changer for software development efficiency, enabling teams to achieve more with less effort.

This guide covers the major categories of developer productivity tools—from AI-enhanced code editors and intelligent assistants to project management platforms and collaboration tools—and explores how AI is reshaping the entire software development lifecycle (SDLC). Whether you’re new to development or among experienced developers looking to optimize your workflow, you’ll find practical guidance for selecting and implementing the right tools for your needs. Understanding these tools matters because even small efficiency gains compound across the entire SDLC, translating into faster releases, fewer bugs, and reduced cognitive load.

Direct answer: A developer productivity tool is any software application designed to reduce manual work, improve code quality, and accelerate how developers work through automation, intelligent assistance, and workflow optimization—an evolution that in 2026 is increasingly driven by AI capabilities. These tools benefit a wide range of users, from individual developers to entire teams, by providing features tailored to different user needs and enhancing productivity at every level. For example, an AI-powered code completion tool can automatically suggest code snippets, helping developers write code faster and with fewer errors. Many developer productivity tools also support or integrate with open source projects, fostering community collaboration and enabling developers to contribute to and benefit from shared resources.

Measuring developer productivity is a hot topic right now, making it crucial to understand the latest approaches and tools available. The hardest part of measuring developer productivity is getting the company and engineering to buy into it.

By the end of this guide, you’ll understand:

  • How AI-powered tools are revolutionizing coding, code review, testing, and deployment
  • Which productivity tools align with your team’s workflow and tech stack in a future-forward environment
  • Practical implementation strategies that boost developer productivity using AI
  • Common adoption pitfalls and how to avoid them
  • Measurement approaches using DORA metrics and other frameworks enhanced by AI insights

Understanding Developer Productivity Tools in the Age of AI

Developer productivity tools are software applications that eliminate friction in the development process and amplify what developer productivity can accomplish. Rather than simply adding more features, effective tools reduce the time, effort, and mental energy required to turn ideas into working, reliable software. Platforms offering additional features—such as enhanced integrations and customization—can further improve developer experience and productivity. Many of these tools allow developers to seamlessly connect to code repositories, servers, or databases, optimizing workflows and enabling more efficient collaboration. In 2026, AI is no longer an optional add-on but a core driver of these improvements.

Modern development challenges make these tools essential. Tool sprawl forces developers to context-switch between dozens of applications daily. Developers lose between six and 15 hours per week navigating multiple tools. Complex codebases demand intelligent navigation and search. Manual, time-consuming processes like code reviews, testing, and deployment consume hours that could go toward creating new features. Poor developer experience can lead to increased cognitive load, reducing the time available for coding. AI-powered productivity tools directly address these pain points by streamlining workflows, automating manual tasks, and helping save time across the entire software development lifecycle.

Core Productivity Principles Enhanced by AI

Three principles underpin how AI-powered productivity tools create value:

Automation removes repetitive tasks from developer workflows. AI accelerates this by not only running unit tests and formatting code but generating code snippets, writing boilerplate, and even creating unit tests automatically. This saves time and reduces human error.

Workflow optimization connects separate activities and tools into seamless integration points. AI helps by automatically connecting various tools and services, linking pull requests to tasks, suggesting next steps, and intelligently prioritizing work based on historical data and team patterns. This workflow optimization also enables team members to collaborate more efficiently by sharing updates, files, and progress within a unified environment.

Cognitive load reduction keeps developers in flow states longer. AI-powered assistants provide context-aware suggestions, summarize codebases, and answer technical questions on demand, minimizing interruptions and enabling developers to focus on complex problem-solving. Integrating tools into a unified platform can help reduce the cognitive load on developers.

How AI Transforms the Software Development Lifecycle

AI tools are influencing every stage of the SDLC:

  • Coding: AI-powered code editors and assistants like GitHub Copilot and Tabnine provide real-time code completions, generate entire functions from natural language prompts, and adapt suggestions based on the entire codebase context.
  • Code Review: AI accelerates review cycles by automatically analyzing pull requests, detecting bugs, security vulnerabilities, and code smells, and providing actionable feedback, reducing manual effort and improving code quality.
  • Testing: AI generates unit tests and integration tests, predicts flaky tests, and prioritizes test execution to optimize coverage and speed.
  • Deployment and Monitoring: AI-driven automation manages CI/CD pipelines, predicts deployment risks, and assists in incident detection and resolution.

This AI integration is shaping developer productivity in 2026 by enabling faster, higher-quality software delivery with less manual overhead.

Tool Categories and AI-Driven Functions

Developer productivity tools span several interconnected categories enhanced by AI:

Code development tools include AI-augmented code editors and IDEs like Visual Studio Code and IntelliJ IDEA, which now offer intelligent code completion, bug detection, refactoring suggestions, and even automated documentation generation. Cursor is a specialized AI tool based on VS Code that offers advanced AI features including multi-file edits and agent mode. Many modern tools offer advanced features such as sophisticated code analysis, security scans, and enhanced integrations, often available in premium tiers.

Cloud-based development platforms such as Replit and Lovable provide fully integrated online coding environments that combine code editing, execution, collaboration, and AI assistance in a seamless web interface. These platforms enable developers to code from anywhere with an internet connection, support multiple programming languages, and often include AI-powered features like code generation, debugging help, and real-time collaboration, making them ideal for remote teams and rapid prototyping.

AI-powered assistants such as GitHub Copilot, Tabnine, and emerging AI coding companions generate code snippets, detect bugs, and provide context-aware suggestions based on the entire codebase and user behavior.

Project management platforms like Jira and Linear increasingly incorporate AI to predict sprint outcomes, prioritize backlogs, and automate routine updates, linking development work more closely to business goals.

Collaboration tools leverage AI to summarize discussions, highlight action items, and facilitate asynchronous communication, especially important for distributed teams.

Build and automation tools such as Gradle and GitHub Actions integrate AI to optimize build times, automatically fix build failures, and intelligently manage deployment pipelines.

Developer portals and analytics platforms use AI to analyze large volumes of telemetry and code data, providing deep insights into developer productivity, bottlenecks, and quality metrics. These tools support a wide range of programming languages and frameworks, catering to diverse developer needs.

These categories work together, with AI-powered integrations reducing friction and boosting efficiency across the entire SDLC. Popular developer productivity tools include IDEs like VS Code and JetBrains IDEs, version control systems like GitHub and GitLab, project tracking tools like Jira and Trello, and communication platforms like Slack and Teams. Many of these tools also support or integrate with open source projects, fostering community engagement and collaboration within the developer ecosystem.

How Developers Work in 2026

In 2026, developers operate in a highly collaborative and AI-augmented environment, leveraging a suite of advanced tools to maximize productivity throughout the entire software development lifecycle. AI tools like GitHub Copilot are now standard, assisting developers by generating code snippets, automating repetitive tasks, and suggesting improvements to code structure. This allows software development teams to focus on solving complex problems and delivering high quality code, rather than getting bogged down by routine work.

Collaboration is at the heart of modern development. Platforms such as Visual Studio Code, with its extensive ecosystem of plugins and seamless integrations, empower teams to work together efficiently, regardless of location. Developers routinely share code, review pull requests, and coordinate tasks in real time, ensuring that everyone stays aligned and productive.

Experienced developers recognize the importance of continuous improvement, regularly updating their skills to keep pace with new programming languages, frameworks, and emerging technologies. This commitment to learning is supported by a wealth of further reading resources, online courses, and community-driven documentation. The focus on writing clean, maintainable, and well-documented code remains paramount, as it ensures long-term project success and easier onboarding for new team members.

By embracing these practices and tools, developers in 2026 are able to boost developer productivity, streamline the development process, and deliver innovative solutions faster than ever before.

Essential Developer Productivity Tool Categories in 2026

Building on foundational concepts, let’s examine how AI-enhanced tools in each category boost productivity in practice. In addition to primary solutions like Slack, Jira, and GitHub, using other tools alongside them creates a comprehensive productivity suite. Effective communication within teams can enhance developer productivity. For example, a developer might use Slack for instant messaging, Jira for task tracking, and GitHub for version control, seamlessly integrating these tools to streamline their workflow.

In 2026, developer productivity tools have evolved to become autonomous agents capable of multi-file editing, independent debugging, and automatic test generation.

AI-Augmented Code Development and Editing Tools

Modern IDEs and code editors form the foundation of developer productivity. Visual Studio Code continues to dominate, now deeply integrated with AI assistants that provide real-time, context-aware code completions across dozens of programming languages. Visual Studio Code also offers a vast extension marketplace and is highly customizable, making it suitable for general use. IntelliJ IDEA and JetBrains tools offer advanced AI-powered refactoring and error detection that analyze code structure and suggest improvements. JetBrains IDEs provide deep language understanding and powerful refactoring capabilities but can be resource-intensive.

AI accelerates the coding process by generating repetitive code patterns, suggesting alternative implementations, and even explaining complex code snippets. Both experienced programmers and newer developers can benefit from these developer productivity tools to improve development speed, code quality, and team collaboration. This consolidation of coding activities into a single, AI-enhanced environment minimizes context switching and empowers developers to focus on higher-value tasks.

Cloud-Based Development Platforms with AI Assistance

Cloud-based platforms like Replit and Lovable provide accessible, browser-based development environments that integrate AI-powered coding assistance, debugging tools, and real-time collaboration features. These platforms eliminate the need for local setup and support seamless teamwork across locations. Their AI capabilities help generate code snippets, suggest fixes, and accelerate the coding process while enabling developers to share projects instantly. This category is especially valuable for remote teams, educators, and developers who require flexibility and fast prototyping.

AI-Powered Coding Assistants and Review Tools

AI tools represent the most significant recent advancement in developer productivity. GitHub Copilot, trained on billions of lines of code, offers context-aware suggestions that go beyond traditional autocomplete. It generates entire functions from comments, completes boilerplate patterns, and suggests implementations based on surrounding code.

Similar tools like Tabnine and Codeium provide comparable capabilities with different model architectures and deployment options. Many of these AI coding assistants offer a free plan with basic features, making them accessible to a wide range of users. Some organizations prefer self-hosted AI assistants for security or compliance reasons.

AI-powered code review tools analyze pull requests automatically, detecting bugs, security vulnerabilities, and code quality issues. They provide actionable feedback that accelerates review cycles and improves overall code quality, making code review a continuous, AI-supported process rather than a bottleneck. GitHub and GitLab are the industry standard for code hosting, providing integrated DevOps features such as CI/CD and security. GitLab offers more built-in DevOps capabilities compared to GitHub.

AI-Enhanced Project Management and Collaboration Tools

Effective project management directly impacts team productivity by providing visibility, reducing coordination overhead, and connecting everyday tasks to larger goals.

In 2026, AI-enhanced platforms like Jira and Linear incorporate predictive analytics to forecast sprint delivery, identify potential blockers, and automate routine updates. Jira is a project management tool that helps developers track sprints, document guidelines, and integrate with other platforms like GitHub and Slack. Google Calendar and similar tools integrate AI to optimize scheduling and reduce cognitive load.

Collaboration tools leverage AI to summarize conversations, extract decisions, and highlight action items, making asynchronous communication more effective for distributed teams. Slack is a widely used communication tool that facilitates team collaboration through messaging, file sharing, and integration with other tools. Communication tools like Slack facilitate quick interactions and file sharing among team members. It's important for teams to share their favorite tools for communication and productivity, fostering a culture of knowledge sharing. Seamless ability to share files within collaboration platforms further improves efficiency and keeps teams connected regardless of their location.

AI-Driven Build, Test, and Deployment Tools

Build automation directly affects how productive developers feel daily. These tools are especially valuable for DevOps engineers who manage build and deployment pipelines. AI optimizes build times by identifying and caching only necessary components. CI/CD platforms like GitHub Actions use AI to predict deployment risks, automatically fix build failures, and optimize test execution order. Jenkins and GitLab CI/CD are highly customizable automation tools but can be complex to set up and use. Dagger is a platform for building programmable CI/CD pipelines that are language-agnostic and locally reproducible.

AI-generated tests improve coverage and reduce flaky tests, enabling faster feedback cycles and higher confidence in releases. This continuous improvement powered by AI reduces manual work and enforces consistent quality gates across all changes.

AI-Powered Developer Portals and Analytics

As organizations scale, coordinating across many services and teams becomes challenging. Developer portals and engineering analytics platforms such as Typo, GetDX, and Jellyfish use AI to centralize documentation, automate workflows, and provide predictive insights. These tools help software development teams identify bottlenecks, improve developer productivity, and support continuous improvement efforts by analyzing data from version control, CI/CD systems, and project management platforms.

Code Analysis and Debugging in Modern Development

Modern software development relies heavily on robust code analysis and debugging practices to ensure code quality and reliability. Tools like IntelliJ IDEA have become indispensable, offering advanced features such as real-time code inspections, intelligent debugging, and performance profiling. These capabilities help developers quickly identify issues, optimize code, and maintain high standards across the entire codebase.

Version control systems, particularly Git, play a crucial role in enabling seamless integration and collaboration among team members. By tracking changes and facilitating code reviews, these tools ensure that every contribution is thoroughly vetted before being merged. Code reviews are now an integral part of the development workflow, allowing teams to catch errors early, share knowledge, and uphold coding standards.

Automated testing, including unit tests and integration tests, further strengthens the development process by catching bugs and regressions before they reach production. By integrating these tools and practices, developers can reduce the time spent on debugging and maintenance, ultimately delivering more reliable and maintainable software.

Time Management for Developers

Effective time management is a cornerstone of developer productivity, directly influencing the success of software development projects and the delivery of high quality code. As software developers navigate the demands of the entire software development lifecycle—from initial planning and coding to testing and deployment—managing time efficiently becomes essential for meeting deadlines, reducing stress, and maintaining overall productivity.

Common Time Management Challenges

Modern software development presents unique time management challenges. Developers often juggle multiple projects, shifting priorities, and frequent interruptions, all of which can fragment focus and slow progress. Without clear strategies for organizing tasks and allocating time, even experienced developers can struggle to keep up with the pace of development and risk missing critical milestones.

Strategies and Tools for Effective Time Management

Concentration and Focus: Maximizing Deep Work

Achieving deep work is essential for developers tackling complex coding tasks and striving for high quality code. Productivity tools and time management techniques, such as the Pomodoro Technique, have become popular strategies for maintaining focus. By working in focused 25-minute intervals followed by short breaks, developers can boost productivity, minimize distractions, and sustain mental energy throughout the day.

Using the Pomodoro Technique

The Pomodoro Technique is a time management method that breaks work into intervals, typically 25 minutes long, separated by short breaks. Apps like Be Focused help developers manage their time using this technique, enhancing focus, productivity, and preventing burnout.

Scheduling Deep Work Sessions

Scheduling dedicated blocks of time for deep work using tools like Google Calendar helps developers protect their most productive hours and reduce interruptions. Creating a quiet, comfortable workspace—free from unnecessary noise and distractions—further supports concentration and reduces cognitive load.

Regular breaks and physical activity are also important for maintaining long-term productivity and preventing burnout. By prioritizing deep work and leveraging the right tools and techniques, developers can consistently deliver high quality code and achieve their development goals more efficiently.

Virtual Coworking and Remote Work Tools

The rise of remote work has made virtual coworking and collaboration tools essential for developers and software development teams.

Communication Platforms

Platforms like Slack and Microsoft Teams provide real-time communication, video conferencing, and file sharing, enabling teams to stay connected and collaborate seamlessly from anywhere in the world. For development teams, using the best CI/CD tools is equally important to automate software delivery and enhance productivity.

Time Tracking Tools

Time tracking tools such as Clockify and Toggl help developers monitor their work hours, manage tasks, and gain insights into their productivity patterns. These tools support better time management and help teams allocate resources effectively.

Hybrid Collaboration Spaces

For those seeking a blend of remote and in-person collaboration, virtual coworking spaces offered by providers like WeWork and Industrious create opportunities for networking and teamwork in shared physical environments. By leveraging these tools and platforms, developers can maintain productivity, foster collaboration, and stay engaged with their teams, regardless of where they work.

Wireframing and Design Tools for Developers

Wireframing and design tools are vital for developers aiming to create intuitive, visually appealing user interfaces.

Collaborative Design Platforms

Tools like Figma and Sketch empower developers to design, prototype, and test interfaces collaboratively, streamlining the transition from concept to implementation. These platforms support real-time collaboration with designers and stakeholders, ensuring that feedback is incorporated early and often.

Advanced Prototyping Tools

Advanced tools such as Adobe XD and InVision offer interactive prototyping and comprehensive design systems, enabling developers to create responsive and accessible interfaces that meet user needs. Integrating these design tools with version control systems and other collaboration platforms ensures that design changes are tracked, reviewed, and implemented efficiently, reducing errors and inconsistencies throughout the development process.

By adopting these wireframing and design tools, developers can enhance the quality of their projects, accelerate development timelines, and deliver user experiences that stand out in a competitive landscape.

Developer Productivity Tools and Categories in 2026

Category Description Major Tools and Examples
AI-Augmented Code Development and Editing Tools AI-enhanced code editors and IDEs that provide intelligent code completion, error detection, and refactoring to boost developer productivity. Visual Studio Code, IntelliJ IDEA, JetBrains IDEs, Cursor, Tabnine, GitHub Copilot, Codeium
Cloud-Based Development Platforms with AI Assistance Browser-based coding environments with AI-powered assistance, collaboration, and execution. Replit, Lovable
AI-Powered Coding Assistants and Review Tools AI tools that generate code snippets, automate code reviews, and detect bugs and vulnerabilities. GitHub Copilot, Tabnine, Codeium, DeepCode AI (Snyk), Greptile, Sourcegraph Cody
AI-Enhanced Project Management and Collaboration Tools Platforms that integrate AI to optimize task tracking, sprint planning, and team communication. Jira, Linear, Google Calendar, Slack, Microsoft Teams, Pumble, Plaky
Build, Test, and Deployment Automation Tools Tools that automate CI/CD pipelines, optimize builds, and generate tests using AI. GitHub Actions, Jenkins, GitLab CI/CD, Dagger, Harness
Developer Portals and Analytics Platforms Centralized platforms using AI to analyze productivity, bottlenecks, and provide insights. Typo, GetDX, Jellyfish, Port, Swarmia
Time Management and Focus Tools Tools and techniques to manage work intervals and improve concentration. Clockify, Be Focused (Pomodoro), AI code review tools, Focusmate
Communication and Collaboration Platforms Real-time messaging, file sharing, and integration with development tools. Slack, Microsoft Teams, Pumble
Task and Project Management Tools Tools to organize, assign, and track development tasks and projects. Jira, Linear, Plaky, ClickUp
Wireframing and Design Tools Collaborative platforms for UI/UX design and prototyping. Figma, Sketch, Adobe XD, InVision
Code Snippet Management Tools Tools to store, share, and document reusable code snippets. Pieces for Developers
Terminal and Command Line Tools Enhanced terminals with AI assistance and productivity features. Warp

This table provides a comprehensive overview of the major categories of developer productivity tools in 2026, along with prominent examples in each category. Leveraging these tools effectively can significantly boost developer productivity, improve code quality, and streamline the entire software development lifecycle.

Implementing AI-Powered Developer Productivity Tools

Understanding tool categories is necessary but insufficient. Successful implementation requires deliberate selection, thoughtful rollout, and ongoing optimization—particularly with AI tools that introduce new workflows and capabilities.

Tool Selection Process for AI Tools

Before adding new AI-powered tools, assess whether they address genuine problems rather than theoretical improvements. Teams that skip this step often accumulate redundant tools that increase rather than decrease cognitive load.

  1. Audit current workflow bottlenecks: Identify where AI can automate repetitive coding tasks, streamline code reviews, or improve testing efficiency.
  2. Evaluate compatibility with existing stack: Prioritize AI tools with APIs and native integrations for your version control, CI/CD, and project management platforms.
  3. Consider team context: Teams with many experienced developers may want advanced AI features for code quality, while newer developers may benefit from AI as a learning assistant.
  4. Pilot before committing: Test AI tools with a representative group before organization-wide deployment. Measure actual productivity impact rather than relying on demos or marketing claims.

Measuring AI Impact on Developer Productivity

Without measurement, it’s impossible to know whether AI tools actually improve productivity or merely feel different.

Establish baseline metrics before implementation. DORA metrics—deployment frequency, lead time for changes, change failure rate, mean time to recovery—provide standardized measurements. Supplement with team-level satisfaction surveys and qualitative feedback. Compare before and after data to validate AI tool investments.

Conclusion and Next Steps

AI-powered developer productivity tools are reshaping software development in 2026 by automating repetitive tasks, enhancing code quality, and optimizing workflows across the entire software development lifecycle. The most effective tools reduce cognitive load, automate repetitive tasks, and create seamless integration between previously disconnected activities.

However, tools alone don’t fix broken processes—they amplify whatever practices are already in place. The future of developer productivity lies in combining AI capabilities with continuous improvement and thoughtful implementation.

Take these immediate actions to improve your team’s productivity in 2026:

  • Audit your current toolset to identify overlaps, gaps, and underutilized AI capabilities
  • Identify your top three workflow bottlenecks where AI can add value
  • Select one AI-powered tool category to pilot based on potential impact
  • Establish baseline metrics using DORA or similar frameworks enhanced with AI insights
  • Implement time tracking to measure work hours and project progress, supporting better decision-making and resource allocation. Be aware that time tracking can be unpopular, but it can be successful if it addresses issues like undercharging and undue pressure on engineering.
  • Measure productivity changes after implementation to validate the investment

Related topics worth exploring:

  • Developer experience platforms for creating internal golden paths and self-service workflows enhanced by AI
  • Software engineering metrics beyond DORA for comprehensive team insights driven by AI analytics
  • Team collaboration strategies that maximize AI tool effectiveness through process improvements

Additional Resources

For further reading on implementing AI-powered developer productivity tools effectively:

  • DORA metrics framework: Research-backed measurements for software delivery performance that help teams track improvement over time
  • SPACE framework: Microsoft Research’s multidimensional approach to productivity measurement incorporating satisfaction, performance, activity, collaboration, and efficiency
  • Tool integration patterns: API documentation and guides for connecting AI tools across the development workflow
  • ROI calculation approaches: Templates for quantifying AI productivity tool investments and demonstrating value to stakeholders
  • Pomodoro Technique apps: The Pomodoro Technique is a time management method that breaks work into intervals, typically 25 minutes long, separated by short breaks. Apps like Be Focused help developers manage their time using this technique, enhancing focus, productivity, and preventing burnout.

The landscape of developer productivity tools continues evolving rapidly, particularly with advances in artificial intelligence and platform engineering. Organizations that systematically evaluate, adopt, and optimize these AI-powered tools gain compounding advantages in development speed and software quality by 2026.

Frequently Asked Questions (FAQs)

What is a developer productivity tool?

A developer productivity tool is any software application designed to streamline workflows, automate repetitive tasks, improve code quality, and accelerate the coding process. These tools help software developers and teams work more efficiently across the entire software development lifecycle by providing intelligent assistance, automation, and seamless integrations.

How do AI-powered developer productivity tools boost productivity?

AI-powered tools enhance productivity by generating code snippets, automating code reviews, detecting bugs and vulnerabilities, suggesting improvements to code structure, and optimizing workflows. They reduce cognitive load by providing context-aware suggestions and enabling developers to focus on complex problem-solving rather than manual, repetitive tasks.

Which are some popular developer productivity tools in 2026?

Popular tools include AI-augmented code editors like Visual Studio Code and IntelliJ IDEA, AI coding assistants such as GitHub Copilot and Tabnine, project management platforms like Jira and Linear, communication tools like Slack and Microsoft Teams, and cloud-based development platforms like Replit. Many of these tools offer free plans and advanced features to support various development needs.

How can I measure developer productivity effectively?

Measuring developer productivity can be done using frameworks like DORA metrics, which track deployment frequency, lead time for changes, change failure rate, and mean time to recovery. Supplementing these with team-level satisfaction surveys, qualitative feedback, and AI-driven analytics provides a comprehensive view of productivity improvements.

What role does developer experience play in productivity?

Developer experience significantly impacts productivity by influencing how easily developers can use tools and complete tasks. Poor developer experience increases cognitive load and reduces coding time, while a positive experience enhances focus, collaboration, and overall efficiency. Streamlining tools and reducing tool sprawl are key to improving developer experience.

Are there free developer productivity tools available?

Yes, many developer productivity tools offer free plans with essential features. Tools like GitHub Copilot, Tabnine, Visual Studio Code, and Clockify provide free tiers that are suitable for individual developers or small teams. These free plans allow users to experience AI-powered assistance and productivity enhancements without upfront costs.

How do I choose the right developer productivity tools for my team?

Selecting the right tools involves auditing your current workflows, identifying bottlenecks, and evaluating compatibility with your existing tech stack. Consider your team’s experience level and specific needs, pilot tools with representative users, and measure their impact on productivity before full adoption.

Can developer productivity tools help with remote collaboration?

Absolutely. Many tools integrate communication, project management, and code collaboration features that support distributed teams. Platforms like Slack, Microsoft Teams, and cloud-based IDEs enable real-time messaging, file sharing, and synchronized coding sessions, helping teams stay connected and productive regardless of location.

How do AI tools assist in code reviews?

AI tools analyze pull requests automatically, detecting bugs, code smells, security vulnerabilities, and style inconsistencies. They provide actionable feedback and suggestions, speeding up review cycles and improving code quality. This automation reduces manual effort and helps maintain high standards across the codebase.

What is the Pomodoro Technique, and how does it help developers?

The Pomodoro Technique is a time management method that breaks work into focused intervals (usually 25 minutes) separated by short breaks. Using Pomodoro timer apps helps developers maintain concentration, prevent burnout, and optimize productivity during coding sessions.

developer productivity

The Complete Guide to Developer Productivity

Introduction

Developer productivity is a critical focus for engineering teams in 2026. This guide is designed for engineering leaders, managers, and developers who want to understand, measure, and improve how their teams deliver software. In today’s rapidly evolving technology landscape, developer productivity matters more than ever—it directly impacts business outcomes, team satisfaction, and an organization’s ability to compete.

Developer productivity depends on tools, culture, workflow, and individual skills. It is not just about how much code gets written, but also about how effectively teams build software and the quality of what they deliver. As software development becomes more complex and AI tools reshape workflows, understanding and optimizing developer productivity is essential for organizations seeking to deliver value quickly and reliably.

This guide sets expectations for a comprehensive, actionable framework that covers measurement strategies, the impact of AI, and practical steps for building a data-driven culture. Whether you’re a CTO, engineering manager, or hands-on developer, you’ll find insights and best practices to help your team thrive in 2026.

TLDR

Developer productivity is a critical focus for engineering teams in 2026. Measuring what matters—speed, effectiveness, quality, and impact—across the entire software delivery process is essential. Software development metrics provide a structured approach to defining, measuring, and analyzing key performance indicators in software engineering. Traditional metrics like lines of code have given way to sophisticated frameworks combining DORA and SPACE metrics and developer experience measurement. The Core 4 framework consolidates DORA, SPACE, and developer experience metrics into four dimensions: speed, effectiveness, quality, and impact. AI coding tools have fundamentally changed how software development teams work, creating new measurement challenges around PR volume, code quality variance, and rework loops. Measuring developer productivity is difficult because the link between inputs and outputs is considerably less clear in software development than in other functions. DORA metrics are widely recognized as a standard for measuring software development outcomes and are used by many organizations to assess their engineering performance. Engineering leaders must balance quantitative metrics with qualitative insights, focus on team and system-level measurement rather than individual surveillance, and connect engineering progress to business outcomes. Organizations that rigorously track developer productivity gain a critical competitive advantage by identifying bottlenecks, eliminating waste, and making smarter investment decisions. This guide provides the complete framework for measuring developer productivity, avoiding common pitfalls, and building a data-driven culture that improves both delivery performance and developer experience.

Understanding Developer Productivity

Software developer metrics are measures designed to evaluate the performance, productivity, and quality of work software developers produce.

Productivity vs Output

Developer productivity measures how effectively a development team converts effort into valuable software that meets business objectives. It encompasses the entire software development process—from initial code committed to production deployment and customer impact. Productivity differs fundamentally from output. Writing more lines of code or closing more tickets does not equal productivity when that work fails to deliver business value.

Team Dynamics

The connection between individual performance and team outcomes matters deeply. Software engineering is inherently collaborative. A developer’s contribution depends on code review quality, deployment pipelines, architecture decisions, and team dynamics that no individual controls. Software developer productivity frameworks, such as DORA and SPACE, are used to evaluate the development team’s performance by providing quantitative data points like code output, defect rates, and process efficiency. This reality shapes how engineering managers must approach measurement: as a tool for understanding complex systems rather than ranking individuals. The role of metrics is to give leaders clarity on the questions that matter most regarding team performance.

Business Enablement

Developer productivity serves as a business enabler. Organizations that optimize their software delivery process ship features faster, maintain higher code quality, and retain talented engineers. Software developer productivity is a key factor in organizational success. The goal is never surveillance—it is creating conditions where building software becomes faster, more reliable, and more satisfying.

What Is Developer Productivity in 2026?

Output, Outcomes, and Impact

Developer productivity has evolved beyond simple output measurement. In 2026, a complete definition includes:

  • Output, Outcomes, and Impact: Modern productivity measurement distinguishes between activity (commits, pull requests, deployments), outcomes (features delivered, bugs fixed, reliability maintained), and impact (customer satisfaction, revenue contribution, competitive advantage). Activity without outcomes is noise; outcomes without impact waste engineering effort. Measuring outcomes, rather than just activity or output, is crucial for aligning engineering work with business value and accountability. Different metrics measure various aspects of productivity, such as speed, quality, and impact, and should be selected thoughtfully to avoid misaligned incentives.

Developer Experience as Core Component

  • Developer Experience: Developer sentiment, cognitive load, and workflow friction directly affect sustainable productivity. Teams with poor developer experience may show short-term velocity before burning out or leaving. Measuring productivity without measuring experience produces an incomplete and misleading picture.

Collaboration and System Resilience

  • Collaboration and System Resilience: How well teams share knowledge, coordinate across dependencies, and recover from failures matters as much as individual coding speed. Modern software development depends on complex systems where team performance emerges from interaction patterns, not just aggregated individual metrics.

Team and System-Level Focus

  • Team and System-Level Focus: The shift from individual metrics to team and system measurement reflects how software actually gets built. Deployment frequency, cycle time, and failed deployment recovery time describe system capabilities that multiple people influence. Organizations measure software developer productivity using frameworks like DORA and SPACE, which prioritize outcomes and impact over raw activity. Using these metrics to evaluate individuals creates distorted incentives and ignores the collaborative nature of software delivery. When considering activity metrics, relying solely on story points completed can be misleading and should be supplemented with other measures that capture value creation and effectiveness.

Key Benefits of Measuring Developer Productivity

Identify Bottlenecks and Friction Points

  • Identify Bottlenecks and Friction Points: Quantitative data from development workflows reveals where work stalls. Long PR review times, deployment pipeline failures, and excessive context switching become visible. Engineering teams can address root causes rather than symptoms.

Enable Data-Driven Decisions

  • Enable Data-Driven Decisions: Resource allocation, tooling investments, and process changes benefit from objective measurements. Measurement helps organizations gain valuable insights into their development processes, allowing engineering leadership to justify budget requests with concrete evidence of how improvements affect delivery speed and quality metrics.

Demonstrate Engineering ROI

  • Demonstrate Engineering ROI: Business stakeholders often struggle to understand engineering progress. Productivity metrics tied to business outcomes—faster feature development, reduced incidents, improved reliability—translate engineering work into language executives understand.

Improve Developer Retention

  • Improve Developer Retention: Developer experience measurement identifies what makes work frustrating or satisfying. Organizations that act on these valuable insights from measurement create environments where talented engineers want to stay, reducing hiring costs and preserving institutional knowledge.

Support Strategic Planning

  • Support Strategic Planning: Accurate cycle time and throughput data enables realistic forecasting. Most teams struggle with estimation; productivity measurement provides the quantitative foundation for credible commitments to business partners.

Why Developer Productivity Measurement Matters More in 2026

AI Coding Tools

  • AI Coding Tools Proliferation: Large language models and AI assistants have fundamentally changed software development. PR volume has increased. Review complexity has grown. Code quality variance from AI-generated suggestions creates new rework patterns. Traditional metrics cannot distinguish between human and AI contributions or measure whether AI tools actually improve outcomes.

Remote Work

  • Remote and Hybrid Work: Distributed software development teams lack the informal visibility that co-located work provided. Engineering managers cannot observe productivity through physical presence. Measurement becomes essential for understanding how development teams actually perform. Defining standard working practices helps ensure consistent measurement and performance across distributed teams, enabling organizations to benchmark and improve effectiveness regardless of location.

Efficiency Pressure

  • Efficiency Pressure and Business Alignment: Economic conditions have intensified scrutiny on engineering spending. Business performance depends on demonstrating that engineering investment delivers value. Productivity measurement provides the evidence that justifies engineering headcount and tooling costs.

Competitive Advantage

  • Competitive Advantage: Organizations with faster, higher-quality software deployments outperform competitors. Continuous improvement in deployment processes, code quality, and delivery speed creates compounding advantage. Measurement enables the feedback loops that drive improvement.

Talent Market Dynamics

  • Talent Market Dynamics: Skilled developers remain scarce. Organizations that optimize developer experience through measurement-driven improvement attract and retain talent that competitors struggle to find.

Essential Criteria for Effective Productivity Measurement

Successful measurement programs share common characteristics:

  • Balance Quantitative and Qualitative: System metrics from Git, CI/CD, and project management tools provide objective measurements of flow and delivery. Quantitative measures offer the numerical foundation for assessing specific aspects of engineering processes, such as code review times and onboarding metrics. Developer surveys and interviews reveal friction, satisfaction, and collaboration quality that quantitative data misses. Neither alone produces an accurate picture.
  • Drive Improvement, Not Gaming: Metrics become targets; targets get gamed. Effective measurement programs focus on understanding and improvement rather than evaluation and ranking. When developers trust that metrics serve their interests, they engage honestly with measurement.
  • Connect to Business Outcomes: Metrics without business context become vanity metrics. Deployment frequency matters because it enables faster customer feedback. Lead time matters because it affects market responsiveness. Every metric should trace back to why it matters for business value.
  • Account for Context: Different teams, codebases, and business domains have different productivity profiles. A platform team’s metrics differ from a feature team’s. Measurement must accommodate this diversity rather than forcing false standardization.
  • Maintain Transparency and Trust: Developers must understand what gets measured, why, and how data will be used. Surprise metrics or hidden dashboards destroy trust. Transparent measurement builds the psychological safety that enables improvement.

Common Pitfalls: How Productivity Measurement Goes Wrong

Measurement programs fail in predictable ways:

  • Vanity Metrics: Lines of code, commit counts, and raw PR numbers measure activity rather than value. Stack Overflow’s editorial describes measuring developers by lines of code as “measuring a power plant by how much waste they produce.” More code often means more complexity and maintenance burden, not more business value.
  • Individual Surveillance: Using team-level metrics like deployment frequency to evaluate individuals creates fear and competition rather than collaboration. Developers stop helping colleagues, hide problems, and optimize for appearing productive rather than being productive. The unintended consequences undermine the very productivity being measured.
  • Speed-Only Focus: Pressure to improve cycle time and deployment frequency without corresponding quality metrics encourages cutting corners. Technical debt accumulates. Failure rate increases. Short-term velocity gains reverse as rework consumes future capacity.
  • Context Blindness: Applying identical metrics and benchmarks across different team types ignores legitimate differences. A team maintaining critical infrastructure has different productivity patterns than a team building new features. One-size-fits-all measurement produces misleading comparisons.
  • Measurement Without Action: Collecting metrics without acting on insights creates survey fatigue and cynicism. Developers lose faith in measurement when nothing changes despite clear evidence of problems. Measurement only adds value when it drives continuous improvement.

The Four Pillars Framework for Developer Productivity

A comprehensive approach to measuring developer productivity spans four interconnected dimensions: speed, effectiveness, quality, and impact. To truly understand and improve productivity, organizations must consider the entire system rather than relying on isolated metrics. These pillars balance each other—speed without quality creates rework; quality without speed delays value delivery.

Companies like Dropbox, Booking.com, and Adyen have adopted variations of this framework, adapting it to their organizational contexts. The pillars provide structure while allowing flexibility in specific metrics and measurement approaches.

Speed and DORA Metrics

Speed metrics capture how quickly work moves through the development process:

  • Deployment Frequency: How often code reaches production. High-performing teams deploy multiple times per day. Low performers deploy monthly or less. Deployment frequency reflects pipeline automation, test confidence, and organizational trust in the delivery process.
  • Lead Time: The time from code committed to code running in production. Elite teams achieve lead times under an hour. Lead time includes coding, code review, testing, and deployment. Shorter lead times indicate tighter feedback loops and faster value delivery.
  • Cycle Time: The time from work starting (often PR opened) to work deployed. Cycle time spans the entire PR lifecycle. It reveals where work stalls—in review queues, awaiting CI results, or blocked on dependencies.
  • Batch Size and Merge Rate: Smaller batches move faster and carry less risk. Pull requests that languish indicate review bottlenecks or excessive scope. Tracking batch size and merge rate surfaces workflow friction.

DORA metrics—deployment frequency, lead time for changes, change failure rate, and mean time to restore—provide the foundation for speed measurement with extensive empirical validation.

Effectiveness Metrics

Effectiveness metrics assess whether developers can do their best work:

  • Developer Experience: Survey-based measurement of satisfaction, perceived productivity, and workflow friction. Developer sentiment often correlates with objective performance. Low experience scores predict retention problems and productivity decline.
  • Onboarding Time: How quickly new developers become productive. Long onboarding indicates documentation gaps, architectural complexity, or poor organizational enablement.
  • Tool Satisfaction: Whether development tools help or hinder productivity. Slow builds, flaky tests, and confusing internal systems create friction that accumulates into major productivity drains.
  • Cognitive Load and Context Switching: How much mental overhead developers carry. High work-in-progress and frequent interruptions reduce flow efficiency. Measuring context switching reveals hidden productivity costs.
  • Collaboration Quality: How effectively team members share information and coordinate. Poor collaboration produces duplicated effort, integration problems, and delivery delays.

Quality Metrics

Quality metrics ensure speed does not sacrifice reliability:

  • Change Failure Rate: The percentage of deployments causing production failures. Elite teams maintain failure rates of 0-15%. High failure rates indicate weak testing, poor review processes, or architectural fragility.
  • Failed Deployment Recovery Time: How quickly teams restore service after incidents. Mean time to restore under an hour characterizes high performers. Fast recovery reflects good observability, runbook quality, and team capability.
  • Defect Rates and Escape Rate: Bugs found in production versus testing. High escape rates suggest inadequate test coverage or review effectiveness. Bug fixes consuming significant capacity indicate upstream quality problems.
  • Technical Debt Assessment: Accumulated code quality issues affecting future development speed. Technical debt slows feature development, increases defect rates, and frustrates developers. Tracking debt levels informs investment decisions.
  • Code Review Effectiveness: Whether reviews catch problems and improve code without becoming bottlenecks. Review quality matters more than review speed, but both affect productivity.

Impact Metrics

Impact metrics connect engineering work to business outcomes:

  • Feature Adoption: Whether shipped features actually get used. Features that customers ignore represent wasted engineering effort regardless of how efficiently they were built.
  • Customer Satisfaction Impact: How engineering work affects customer experience. Reliability improvements, performance gains, and new capabilities should trace to customer satisfaction changes.
  • Revenue Attribution: Where possible, connecting engineering work to revenue impact. This measurement is challenging but valuable for demonstrating engineering ROI.
  • Innovation Metrics: Investment in exploratory work and experimental project success rates. Organizations that measure only delivery velocity may underinvest in future capabilities.
  • Strategic Goal Alignment: Whether engineering effort aligns with business objectives. Productivity on the wrong priorities delivers negative value.

AI-Era Developer Productivity: New Challenges and Opportunities

AI coding tools have transformed software development, creating new measurement challenges:

  • Increased PR Volume and Review Complexity: AI assistants accelerate code generation, producing more pull requests requiring review. Review quality may decline under volume pressure. Traditional throughput metrics may show improvement while actual productivity stagnates or declines.
  • Quality Variance: AI-generated code varies in quality. Model hallucinations, subtle bugs, and non-idiomatic patterns create rework. Measuring code quality becomes more critical when distinguishing between AI-origin and human-origin code.
  • New Rework Patterns: AI suggestions that initially seem helpful may require correction later. Rework percentage from AI-origin code represents a new category of technical debt. Traditional metrics miss this dynamic.
  • AI Tool Effectiveness Measurement: Organizations investing in AI coding tools need to measure ROI. Do these tools actually improve developer productivity, or do they shift work from coding to review and debugging? Measuring AI tool impact without disrupting workflows requires new approaches.
  • Skill Evolution: Developer roles shift when AI handles routine coding. Prompt engineering, AI output validation, and architecture skills grow in importance. Productivity definitions must evolve to match changing work patterns.

Quantitative vs Qualitative Measurement Approaches

Effective productivity measurement combines both approaches:

  • Quantitative Metrics: System-derived data—commits, PRs, deployments, cycle times—provides objective measurements at scale. Quantitative data reveals patterns, trends, and anomalies. It enables benchmarking and tracking improvement over time.
  • Qualitative Metrics: Developer surveys, interviews, and focus groups reveal what numbers cannot. Why are cycle times increasing? What tools frustrate developers? Where do handoffs break down? Qualitative data explains the “why” behind quantitative trends.
  • Complementary Use: Neither approach alone produces a holistic view. Quantitative data without qualitative context leads to misinterpretation. Qualitative insights without quantitative validation may reflect vocal minorities rather than systemic issues. Combining both produces a more accurate picture of development team’s performance. Contribution analysis, which evaluates individual and team input to the development backlog, can help identify trends and optimize team capacity by measuring and understanding how work is distributed and where improvements can be made.
  • When to Use Each: Start with quantitative data to identify patterns and anomalies. Use qualitative investigation to understand causes. Return to quantitative measurement to verify that interventions work. This cycle of measurement, investigation, and validation drives continuous improvement.

Implementation Strategy: Building Your Measurement Program

Building an effective measurement program requires structured implementation. Follow these steps:

  1. Start with Pilot Teams: Begin with one or two willing teams rather than organization-wide rollout. Pilot teams help refine metrics, identify integration challenges, and build internal expertise before broader deployment.
  2. Align Stakeholders: Engineering leadership, team leads, and developers must understand and support measurement goals. Address concerns about surveillance explicitly. Demonstrate that measurement serves team improvement, not individual evaluation.
  3. Define Success Milestones: Establish what success looks like at each stage. Initial wins might include identifying a specific bottleneck and reducing cycle time for one team. Later milestones might involve organization-wide benchmarking and demonstrated business impact.
  4. Timeline Expectations: Expect 2-4 weeks for pilot setup and initial data collection. Team expansion typically takes 1-2 months. Full organizational rollout requires 3-6 months. Significant cultural change around measurement takes longer.
  5. Integration Requirements: Connect measurement tools to existing development toolchain—Git repositories, CI/CD systems, issue trackers. Data quality depends on integration completeness. Plan for permission requirements, API access, and data mapping across systems.

Developer Productivity Dashboards and Reporting

Dashboards transform raw data into actionable insights:

  • Design for Action: Dashboards should answer specific questions and suggest responses. “What should I do differently?” matters more than “what happened?” Include context and trend information rather than isolated numbers.
  • Role-Specific Views: Individual developers need personal workflow insights—their PR review times, code review contributions, focus time. Engineering managers need team velocity, bottleneck identification, and sprint health. Executives need strategic metrics tied to business performance and investment decisions.
  • Real-Time and Historical: Combine real-time monitoring for operational awareness with historical trend analysis for strategic planning. Week-over-week and month-over-month comparisons reveal improvement or decline.
  • Automated Alerts and Insights: Configure alerts for anomalies—unusual cycle time increases, deployment failures, review queue backlogs. Automated insights reduce manual analysis while ensuring problems surface quickly.

Measuring Team vs Individual Productivity

Team-level measurement produces better outcomes than individual tracking:

  • System-Level Focus: Most meaningful productivity metrics—deployment frequency, lead time, change failure rate—describe team and system capabilities. Using them to evaluate individuals ignores how software actually gets built.
  • Collaboration Measurement: Track how effectively teams share knowledge, coordinate across dependencies, and help each other. High-performing teams have high collaboration density. Measuring individual output without collaboration context misses what makes teams effective.
  • Supporting Individual Growth: Developers benefit from feedback on their contribution patterns—code review involvement, PR size habits, documentation contributions. Frame this information as self-improvement data rather than performance evaluation.
  • Avoiding Surveillance: Individual-level activity monitoring (keystrokes, screen time, detailed hour-by-hour tracking) destroys trust and drives talent away. Focus measurement on team performance and use one-on-ones for individual development conversations.

Industry Benchmarks and Comparative Analysis

Benchmarks provide context for interpreting metrics:

  • DORA Performance Levels: Elite performers deploy on-demand (multiple times daily), maintain lead times under one hour, recover from failures in under one hour, and keep change failure rates at 0-15%. High performers deploy weekly to daily with lead times under one week. Most teams fall into medium or low categories initially.
  • Industry Context: Benchmark applicability varies by industry, company size, and product type. A regulated financial services company has different constraints than a consumer mobile app. Use benchmarks as directional guides rather than absolute standards.
  • Competitive Positioning: Organizations significantly below industry benchmarks in delivery capability face competitive disadvantage. Productivity excellence—shipping faster with higher quality—creates sustainable advantage that compounds over time.

ROI and Business Impact of Developer Productivity Programs

Productivity improvement delivers measurable business value:

  • Time-to-Market Acceleration: Reduced cycle time and higher deployment frequency enable faster feature development. Reaching market before competitors creates first-mover advantage.
  • Quality Cost Reduction: Lower failure rates and faster recovery reduce incident costs—customer support, engineering time, reputation damage. Preventing defects costs less than fixing them.
  • Retention Value: Improved developer experience reduces turnover. Replacing a developer costs 50-150% of annual salary when including recruiting, onboarding, and productivity ramp-up. Retention improvements produce significant savings.
  • Revenue Connection: Faster delivery of revenue-generating features accelerates business growth. More reliable software reduces churn. These connections, while sometimes difficult to quantify precisely, represent real business impact.

Advanced Productivity Metrics for Modern Development

Beyond foundational metrics, advanced measurement addresses emerging challenges:

  • AI Code Quality Assessment: Track rework percentage specifically for AI-generated code. Compare defect rates between AI-assisted and manually written code. Measure whether AI tools actually improve or merely shift productivity.
  • Flow State Duration: Measure time spent in uninterrupted focused work. Leading indicators of productivity decline often appear in reduced deep work time before they show up in output metrics.
  • Cross-Team Collaboration: Track dependency resolution time, handoff efficiency, and integration friction. Many delivery delays stem from cross-team coordination rather than individual team performance.
  • Knowledge Transfer: Measure documentation quality, mentoring impact, and institutional knowledge distribution. Teams where knowledge concentrates in few individuals face key-person risk and onboarding challenges.
  • Innovation Investment: Track percentage of time allocated to experimental work and success rate of exploratory projects. Balancing delivery pressure with innovation investment affects long-term productivity.

Building a Data-Driven Developer Experience Culture

Measurement succeeds within supportive culture:

  • Transparency: Share metrics openly. Explain what gets measured, why, and how data informs decisions. Hidden dashboards and surprise evaluations destroy trust.
  • Developer Participation: Involve developers in metric design and interpretation. They understand workflow friction better than managers or executives. Their input improves both metric selection and buy-in.
  • Continuous Improvement Mindset: Position measurement as learning rather than judgment. Teams should feel empowered to experiment, fail, and improve. Fostering a culture that values quality is essential for improving developer productivity and software outcomes. Blame-oriented metric use kills psychological safety.
  • Action Orientation: Measurement without action breeds cynicism. When metrics reveal problems, respond with resources, process changes, or tooling improvements. Demonstrate that measurement leads to better working conditions.

Tools and Platforms for Developer Productivity Measurement

Various solutions address productivity measurement needs:

  • Integration Scope: Effective platforms aggregate data from Git repositories, CI/CD systems, issue trackers, and communication tools. Look for comprehensive connectors that minimize manual data collection.
  • Analysis Capabilities: Basic tools provide dashboards and trend visualization. Advanced platforms offer anomaly detection, predictive analytics, and automated insights. Evaluate whether analytical sophistication matches organizational needs.
  • Build vs Buy: Custom measurement solutions offer flexibility but require ongoing maintenance. Commercial platforms provide faster time-to-value but may not fit specific workflows. Consider hybrid approaches that combine platform capabilities with custom analytics.
  • Enterprise Requirements: Large organizations need security certifications, access controls, and scalability. Evaluate compliance capabilities against regulatory requirements. Data privacy and governance matter increasingly as measurement programs mature.

How Typo Measures Developer Productivity

Typo offers a comprehensive platform that combines quantitative and qualitative data to measure developer productivity effectively. By integrating with existing development tools such as version control systems, CI/CD pipelines, and project management software, Typo collects system metrics like deployment frequency, lead time, and change failure rate. Beyond these, Typo emphasizes developer experience through continuous surveys and feedback loops, capturing insights on workflow friction, cognitive load, and team collaboration. This blend of data enables engineering leaders to gain a holistic view of their teams' performance, identify bottlenecks, and make data-driven decisions to improve productivity.

Typo’s engineering intelligence goes further by providing actionable recommendations, benchmarking against industry standards, and highlighting areas for continuous improvement, fostering a culture of transparency and trust. What users particularly appreciate about Typo is its ability to seamlessly combine objective system metrics with rich developer experience insights, enabling organizations to not only measure but also meaningfully improve developer productivity while aligning software development efforts with business goals. This holistic approach ensures that engineering progress translates into meaningful business outcomes.

Future of Developer Productivity: Trends and Predictions

Several trends will shape productivity measurement:

  • AI-Powered Insights: Measurement platforms will increasingly use AI to surface insights, predict problems, and recommend interventions. Analysis that currently requires human interpretation will become automated.
  • Autonomous Development: Agentic AI workflows will handle more development tasks independently. Productivity measurement must evolve to evaluate AI agent performance alongside human contributions.
  • Role Evolution: Developer roles will shift toward architecture, oversight, and judgment as AI handles routine coding. Productivity definitions must accommodate these changing responsibilities.
  • Extreme Programming Revival: Practices emphasizing rapid feedback, pair programming, and continuous integration gain relevance in AI-augmented environments. Measurement approaches from extreme programming may resurface in new forms.
  • Holistic Experience Measurement: Developer experience will increasingly integrate with productivity measurement. Organizations will recognize that sustainable productivity requires attending to developer well-being, not just output optimization.

Frequently Asked Questions

What metrics should engineering leaders prioritize when starting productivity measurement?
Start with DORA metrics—deployment frequency, lead time, change failure rate, and mean time to restore. These provide validated, outcome-focused measures of delivery capability. Add developer experience surveys to capture the human dimension. Avoid individual activity metrics initially; they create surveillance concerns without clear improvement value.

How do you avoid creating a culture of surveillance with developer productivity metrics?
Focus measurement on team and system levels rather than individual tracking. Be transparent about what gets measured and why. Involve developers in metric design. Use measurement for improvement rather than evaluation. Never tie individual compensation or performance reviews directly to productivity metrics.

What is the typical timeline for seeing improvements after implementing productivity measurement?
Initial visibility and quick wins emerge within weeks—identifying obvious bottlenecks, fixing specific workflow problems. Meaningful productivity gains typically appear in 2-3 months. Broader cultural change and sustained improvement take 6-12 months. Set realistic expectations and celebrate incremental progress.

How should teams adapt productivity measurement for AI-assisted development workflows?
Add metrics specifically for AI tool impact—rework rates for AI-generated code, review time changes, quality variance. Measure whether AI tools actually improve outcomes or merely shift work. Track AI adoption patterns and developer satisfaction with AI assistance. Expect measurement approaches to evolve as AI capabilities change.

What role should developers play in designing and interpreting productivity metrics?
Developers should participate actively in metric selection, helping identify what measurements reflect genuine productivity versus gaming opportunities. Include developers in interpreting results—they understand context that data alone cannot reveal. Create feedback loops where developers can flag when metrics miss important nuances or create perverse incentives.

Are Lines of Code Misleading Dev Performance?

LOC (Lines of Code) has long been a go-to proxy to measure developer productivity. 

Although easy to quantify, do more lines of code actually reflect the output?

In reality, LOC tells you nothing about the new features added, the effort spent, or the work quality. 

In this post, we discuss how measuring LOC can mislead productivity and explore better alternatives. 

Why LOC Is an Incomplete (and Sometimes Misleading) Metric

Measuring dev productivity by counting lines of code may seem straightforward, but this simplistic calculation can heavily impact code quality. For example, some lines of code such as comments and other non-executables lack context and should not be considered actual “code”.

Suppose LOC is your main performance metric. Developers may hesitate to improve existing code as it could reduce their line count, causing poor code quality. 

Additionally, you can neglect to factor in major contributors, such as time spent on design, reviewing the code, debugging, and mentorship. 

🚫 Example of Inflated LOC:

# A verbose approach
def add(a, b):
    result = a + b
    return result

# A more efficient alternative
def add(a, b): return a + b

Cyclomatic Complexity vs. LOC: A Deeper Correlation Analysis

Cyclomatic Complexity (CC) 

Cyclomatic complexity measures a piece of code’s complexity based on the number of independent paths within the code. Although more complex, these code logic paths are better at predicting maintainability than LOC.

A high LOC with a low CC indicates that the code is easy to test due to fewer branches and more linearity but may be redundant. Meanwhile, a low LOC with a high CC means the program is compact but harder to test and comprehend. 

Aiming for the perfect balance between these metrics is best for code maintainability. 

Python implementation using radon

Example Python script using the radon library to compute CC across a repository:

from radon.complexity import cc_visit
from radon.metrics import mi_visit
from radon.raw import analyze
import os

def analyze_python_file(file_path):
    with open(file_path, 'r') as f:
        source_code = f.read()
    print("Cyclomatic Complexity:", cc_visit(source_code))
    print("Maintainability Index:", mi_visit(source_code))
    print("Raw Metrics:", analyze(source_code))

analyze_python_file('sample.py')


Python libraries like Pandas, Seaborn, and Matplotlib can be used to further visualize the correlation between your LOC and CC.

source

Statistical take

Despite LOC’s limitations, it can still be a rough starting point for assessments, such as comparing projects within the same programming language or using similar coding practices. 

Some major drawbacks of LOC is its misleading nature, as it factors in code length and ignores direct performance contributors like code readability, logical flow, and maintainability.

Git-Based Contribution Analysis: What the Commits Say

LOC fails to measure the how, what, and why behind code contributions. For example, how design changes were made, what functional impact the updates made, and why were they done.

That’s where Git-based contribution analysis helps.

Use Git metadata to track 

  • Commit frequency and impact: Git metadata helps track the history of changes in a repo and provides context behind each commit. For example, a typical Git commit metadata has the total number of commits done, the author’s name behind each change, the date, and a commit message describing the change made. 
  • File churn (frequent rewrites): File or Code churn is another popular Git metric that tells you the percentage of code rewritten, deleted, or modified shortly after being committed. 
  • Ownership and review dynamics: Git metadata clarifies ownership, i.e., commit history and the person responsible for each change. You can also track who reviews what.

Python-based Git analysis tools 

PyDriller and GitPython are Python frameworks and libraries that interact with Git repositories and help developers quickly extract data about commits, diffs, modified files, and source code. 

Sample script to analyze per-dev contribution patterns over 30/60/90-day periods

from git import Repo
repo = Repo("/path/to/repo")

for commit in repo.iter_commits('main', max_count=5):
    print(f"Commit: {commit.hexsha}")
    print(f"Author: {commit.author.name}")
    print(f"Date: {commit.committed_datetime}")
    print(f"Message: {commit.message}")

Use case: Identifying consistent contributors vs. “code dumpers.”

Metrics to track and identify consistent and actual contributors:

  • A stable commit frequency 
  • Defect density 
  • Code review participation
  • Deployment frequency 

Metrics to track and identify code dumpers:

  • Code complexity and LOC
  • Code churn
  • High number of single commits
  • Code duplication

The Statistical Validity of Code-Based Performance Metrics 

A sole focus on output quantity as a performance measure leads to developers compromising work quality, especially in a collaborative, non-linear setup. For instance, crucial non-code tasks like reviewing, debugging, or knowledge transfer may go unnoticed.

Statistical fallacies in performance measurement:

  • Simpson’s Paradox in Team Metrics - This anomaly appears when a pattern is observed in several data groups but disappears or reverses when the groups are combined.
  • Survivorship bias from commit data - Survivorship bias using commit data occurs when performance metrics are based only on committed code in a repo while ignoring reverted, deleted, or rejected code. This leads to incorrect estimation of developer productivity.

Variance analysis across teams and projects

Variance analysis identifies and analyzes deviations happening across teams and projects. For example, one team may show stable weekly commit patterns while another may have sudden spikes indicating code dumps.

import pandas as pd
import matplotlib.pyplot as plt

# Mock commit data
df = pd.DataFrame({
    'team': ['A', 'A', 'B', 'B'],
    'week': ['W1', 'W2', 'W1', 'W2'],
    'commits': [50, 55, 20, 80]
})

df.pivot(index='week', columns='team', values='commits').plot(kind='bar')
plt.title("Commit Variance Between Teams")
plt.ylabel("Commits")
plt.show()

Normalize metrics by role 

Using generic metrics like the commit volume, LOC, deployment speed, etc., to indicate performance across roles is an incorrect measure. 

For example, developers focus more on code contributions while architects are into design reviews and mentoring. Therefore, normalization is a must to evaluate role-wise efforts effectively.

Better Alternatives: Quality and Impact-Oriented Metrics 

Three more impactful performance metrics that weigh in code quality and not just quantity are:

1. Defect Density 

Defect density measures the total number of defects per line of code, ideally measured against KLOC (a thousand lines of code) over time. 

It’s the perfect metric to track code stability instead of volume as a performance indicator. A lower defect density indicates greater stability and code quality.

To calculate, run a Python script using Git commit logs and big tracker labels like JIRA ticket tags or commit messages.

# Defects per 1,000 lines of code
def defect_density(defects, kloc):
    return defects / kloc

Used with commit references + issue labels.

2. Change Failure Rate

The change failure rate is a DORA metric that tells you the percentage of deployments that require a rollback or hotfix in production.  

To measure, combine Git and CI/CD pipeline logs to pull the total number of failed changes. 

grep "deployment failed" jenkins.log | wc -l

3. Time to Restore Service / Lead Time for Changes

This measures the average time to respond to a failure and how fast changes are deployed safely into production. It shows how quickly a team can adapt and deliver fixes.

How to Implement These Metrics in Your Engineering Workflow 

Three ways you can implement the above metrics in real time:

1. Integrating GitHub/GitLab with Python dashboards

Integrating your custom Python dashboard with GitHub or GitLab enables interactive data visualizations for metric tracking. For example, you could pull real-time data on commits, lead time, and deployment rate and display them visually on your Python dashboard. 

2. Using tools like Prometheus + Grafana for live metric tracking

If you want to forget the manual work, try tools like Prometheus - a monitoring system to analyze data and metrics across sources with Grafana - a data visualization tool to display your monitored data on customized dashboards. 

3. CI/CD pipelines as data sources 

CI/CD pipelines are valuable data sources to implement these metrics due to a variety of logs and events captured across each pipeline. For example, Jenkins logs to measure lead time for changes or GitHub Actions artifacts to oversee failure rates, slow-running jobs, etc.

Caution: Numbers alone don’t give you the full picture. Metrics must be paired with context and qualitative insights for a more comprehensive understanding. For example, pair metrics with team retros to better understand your team’s stance and behavioral shifts.

Creating a Holistic Developer Performance Model

1. Combine code quality + delivery stability + collaboration signals

Combine quantitative and qualitative data for a well-balanced and unbiased developer performance model.

For example, include CC and code review feedback for code quality, DORA metrics like bug density to track delivery stability, and qualitative measures within collaboration like PR reviews, pair programming, and documentation. 

2. Avoid metric gaming by emphasizing trends, not one-off number  

Metric gaming can invite negative outcomes like higher defect rates and unhealthy team culture. So, it’s best to look beyond numbers and assess genuine progress by emphasizing trends.  

3. Focus on team-level success and knowledge sharing, not just individual heroics

Although individual achievements still hold value, an overemphasis can demotivate the rest of the team. Acknowledging team-level success and shared knowledge is the way forward to achieve outstanding performance as a unit. 

Conclusion 

Lines of code are a tempting but shallow metric. Real developer performance is about quality, collaboration, and consistency.

With the right tools and analysis, engineering leaders can build metrics that reflect the true impact, irrespective of the lines typed. 

Use Typo’s AI-powered insights to track vital developer performance metrics and make smarter choices. 

Book a demo of Typo today

10 Best Developer Experience (DevEx) Tools in 2025

10 Best Developer Experience (DevEx) Tools in 2025

Developer Experience (DevEx) is essential for boosting productivity, collaboration, and overall efficiency in software development. The right DevEx tools streamline workflows, provide actionable insights, and enhance code quality. New tools and new features are continually introduced to address evolving developer needs and improve the developer experience.

Understanding the developer journey is crucial—DevEx tools support developers at every stage, helping to identify and reduce friction points for a smoother experience. Integrating with existing workflows is important to ensure seamless adoption and minimal disruption.

We’ve explored the 10 best Developer Experience tools in 2025, highlighting their key features and limitations to help you choose the best fit for your team. Following best practices is vital to optimize developer experience and productivity. Satisfied developers are more productive and contribute to higher quality software.

These DevEx tools are also essential for streamlining api development, in addition to other software development processes.

Introduction to DevEx

Developer Experience (DevEx) constitutes the foundational infrastructure that orchestrates the comprehensive software development ecosystem, fundamentally transforming how development teams architect, implement, and deploy high-quality software solutions. An optimized developer experience framework not only enables developers to concentrate on complex algorithmic challenges and innovative feature development, but also drives exponential productivity gains through intelligent automation, workflow optimization, and friction elimination across the entire development lifecycle infrastructure. DevEx tools are specifically designed to improve the way developers work by reducing friction and streamlining daily tasks, making it easier for teams to focus on delivering value.

When organizations strategically invest in sophisticated DevEx platforms and intelligent toolchains, they empower their development teams to leverage advanced automation capabilities, streamline resource-intensive processes, and optimize existing development workflows through data-driven insights and predictive analytics. This comprehensive approach results in accelerated development cycles, enhanced cross-functional collaboration frameworks, and significantly improved developer satisfaction metrics, enabling teams to allocate substantially more resources toward core coding activities while minimizing operational overhead and routine task management. From seamless environment provisioning and comprehensive API documentation to intelligent integration capabilities with existing development infrastructure, every component of the DevEx ecosystem contributes to a more efficient, scalable, and resilient software development lifecycle. These tools allow developers to design, test, and integrate APIs efficiently, facilitating easier development workflows and collaboration.

Throughout this comprehensive analysis, we’ll examine the critical importance of DevEx optimization, explore the fundamental characteristics that define exceptional developer experience frameworks, and demonstrate how strategically implemented DevEx solutions can enable development teams and organizations to achieve ambitious technical objectives and business outcomes. Whether your focus involves enhancing developer productivity metrics, optimizing your software development processes through intelligent automation, or establishing a more collaborative and efficient environment for your development teams, understanding and systematically optimizing DevEx represents a crucial strategic imperative for modern software organizations.

Importance of DevEx for Engineering Leaders

For engineering leaders, optimizing developer experience (DevEx) comprises a critical architectural decision that directly impacts software development lifecycle (SDLC) efficiency and team performance metrics. A streamlined DevEx enables developers to dive into complex algorithmic challenges and innovative solutions rather than wrestling with inefficient toolchains or fragmented workflows that compromise productivity baselines. By leveraging integrated development environments (IDEs) that offer advanced debugging capabilities, robust version control systems like Git, and automated CI/CD pipeline integration, engineering leaders facilitate development teams in automating repetitive deployment tasks and streamlining code review processes.

These AI-driven development tools not only enhance developer throughput but also foster enhanced code quality standards and sustained team engagement across distributed development environments. Ultimately, when engineering leaders invest in comprehensive DevEx optimization strategies, they empower their development teams to deliver production-ready software with improved velocity, implement data-driven decision-making throughout the entire SDLC, and continuously optimize development workflows through infrastructure as code (IaC) practices for superior project deliverables. Facilitating developers through sophisticated tooling ecosystems and architectural patterns serves as the foundation for building resilient, high-performing development teams and achieving scalable organizational objectives.

Key Features to Look For in DevEx Tools 

Integrated Development Environment (IDE) Plugins

The DevEx tool must contain IDE plugins that enhance coding environments with syntax highlighting, code completion, and error detection features. They must also allow integration with external tools directly from the IDE and support multiple programming languages for versatility.

By providing these features, IDE plugins help reduce friction in the development process and enable developers to spend more time writing code.

Collaboration Features

The tools must promote teamwork through seamless collaboration, such as shared workspaces, real-time editing capabilities, and in-context discussions. These features facilitate better communication among teams and improve project outcomes.

Collaboration features empower developers by increasing their confidence, productivity, and autonomy, while also enabling developers to work more efficiently together and focus on innovation.

Developer Insights and Analytics

The Developer Experience tool could also offer insights into developer performance through qualitative metrics including deployment frequency and planning accuracy. A dx platform provides valuable insights for engineering managers by combining quantitative and qualitative data to optimize developer productivity and workflow. This helps engineering leaders understand the developer experience holistically. Analytics from such platforms help identify areas for process and productivity improvements.

Feedback Loops 

For a smooth workflow, developers need timely feedback for an efficient software process. Hence, ensure that the tools and processes empower teams to exchange feedback such as real-time feedback mechanisms, code quality analysis, or live updates to get the view of changes immediately.

Effective feedback loops can increase developer productivity by enabling faster iteration and improvement.

Impact on Productivity

Evaluate how the tool affects workflow efficiency and developers’ productivity. The right DevEx tools improve productivity and help developers achieve better outcomes. Assess it based on whether it reduces time spent on repetitive tasks or facilitates easier collaboration. Analyzing these factors can help gauge the tool’s potential impact on productivity.

DevEx Tool Evaluation Criteria

Identifying optimal DevEx tools necessitates a comprehensive evaluation framework that encompasses multiple critical dimensions and strategic considerations. Initially, the solution must facilitate seamless integration capabilities with your organization's existing technological infrastructure and established operational workflows, thereby ensuring that development teams can leverage these tools without disrupting their proven methodological approaches and productivity patterns.

Automation functionalities constitute another fundamental pillar—prioritize solutions that demonstrate the capacity to systematically automate repetitive operational tasks and minimize manual intervention requirements, consequently enabling developers to redirect their cognitive resources toward more innovative and high-impact initiatives. Real-time analytical insights coupled with instantaneous preview capabilities represent invaluable architectural features, as they empower development teams to rapidly identify, diagnose, and remediate issues throughout the development lifecycle, thereby optimizing overall process efficiency and reducing time-to-resolution metrics.

Furthermore, the selected tool should embody a developer-centric design philosophy that prioritizes the comprehensive developer journey experience, providing an enriched and empowering environment that facilitates the production of superior software deliverables. Scalability characteristics, robust security frameworks, and extensive documentation ecosystems also comprise essential evaluation criteria, as these elements ensure the solution can dynamically adapt and grow alongside your organizational expansion, safeguard your intellectual property and sensitive data assets, and accelerate developer onboarding and proficiency acquisition timelines. Through systematic consideration of these multifaceted criteria, organizations can strategically select DevEx tools that genuinely enhance developer productivity and align with overarching software development objectives and business outcomes.

Best Practices for DevEx

Optimizing developer experience necessitates implementing strategic methodologies that streamline workflows and enhance productivity across development teams. Organizations should prioritize intelligent automation frameworks—deploying sophisticated tools and platforms that systematically eliminate repetitive tasks and minimize manual interventions, enabling developers to allocate resources toward core coding activities and innovative solution architecture.

Comprehensive documentation ecosystems serve as critical infrastructure components, facilitating rapid developer onboarding, efficient troubleshooting protocols, and autonomous issue resolution capabilities. Establishing continuous feedback mechanisms proves essential for organizational optimization; by systematically capturing developer insights regarding software development processes, teams can iteratively refine operational workflows and systematically address performance bottlenecks. Implementing unified development platforms that seamlessly integrate multiple tools and services creates cohesive development environments, substantially reducing context-switching overhead and workflow friction.

Security frameworks must maintain paramount importance, with robust tools and methodologies deployed to safeguard development pipelines and ensure code integrity throughout the software development lifecycle. Through strategic adoption of these optimization practices, organizations can cultivate enhanced developer experiences that drive high-performance software delivery and accelerate business value realization.

Application Security in DevEx

Integrating application security throughout the Software Development Life Cycle (SDLC) fundamentally transforms the developer experience (DevEx) and establishes the foundation for building trustworthy, resilient software architectures. Modern DevEx platforms leverage AI-driven security tools that embed comprehensive security analysis throughout every phase of the development workflow, enabling developers to identify, analyze, and remediate vulnerabilities with unprecedented efficiency and accuracy.

Automated testing frameworks and real-time security scanning capabilities serve as essential components of this integrated approach, allowing development teams to detect potential security threats, code vulnerabilities, and compliance violations before they propagate to production environments. Machine learning algorithms provide continuous, real-time insights and intelligent feedback mechanisms that empower developers to make data-driven decisions about code security posture, ensuring that industry best practices and security standards are consistently followed at every stage of the development lifecycle.

By prioritizing application security integration within comprehensive DevEx toolchains, organizations not only establish robust protection for their software assets and sensitive data repositories but also enable development teams to maintain focus on delivering high-quality, scalable software solutions without compromising security requirements or operational efficiency. This proactive, AI-enhanced approach to security integration helps maintain stakeholder trust and regulatory compliance while supporting streamlined, automated development processes that accelerate time-to-market and reduce technical debt.

Project Management with DevEx Tools

DevEx tools have become increasingly critical components for optimizing project management workflows within modern software development lifecycles, fundamentally transforming how development teams coordinate, execute, and deliver software projects. By providing a comprehensive integrated platform for project management orchestration, these sophisticated tools enable developers to systematically prioritize development tasks, implement robust progress tracking mechanisms, and facilitate seamless cross-functional collaboration with distributed team members across various stages of the development process.

Real-time analytics and feedback loops generated through these platforms empower project managers to execute data-driven decision-making processes regarding optimal resource allocation strategies, timeline optimization, and budget management protocols, ensuring that software projects maintain adherence to predefined delivery schedules and performance benchmarks.

Intelligent automation of routine administrative tasks and workflow orchestration allows development teams to redirect their focus toward more complex problem-solving activities and creative software architecture design, significantly enhancing overall productivity metrics and reducing operational overhead costs throughout the development lifecycle. Additionally, these AI-enhanced DevEx platforms help project managers systematically identify process bottlenecks, performance optimization opportunities, and workflow inefficiencies, ultimately leading to higher quality software deliverables and superior project outcomes that align with business objectives.

By strategically leveraging DevEx tool ecosystems for comprehensive project management, organizations can enable development teams to operate with enhanced efficiency, achieve strategic development goals, and deliver substantial business value through optimized software delivery processes.

Typo 

Typo is an advanced engineering management platform that combines engineering intelligence with developer experience optimization to enhance team productivity and well-being. By capturing comprehensive, real-time data on developer workflows, work patterns, and team dynamics, Typo provides engineering leaders with actionable insights to identify blockers, monitor developer health, and improve overall software delivery processes.

Its pulse check-ins and automated alerts help detect early signs of burnout, enabling proactive interventions that foster a positive developer experience. Typo seamlessly integrates with popular tools such as Git, Slack, calendars, and CI/CD pipelines, creating a unified platform that streamlines workflows and reduces manual overhead. By automating routine tasks and providing visibility across the software development lifecycle, Typo empowers developers to focus on high-impact coding and innovation, while engineering managers gain the intelligence needed to optimize team performance and drive efficient, high-quality software development.

DX

DX is a comprehensive insights platform founded by researchers behind the DORA and SPACE framework. It offers both qualitative and quantitative measures to give a holistic view of the organization. GetDX breaks down results based on personas and streamlines developer onboarding with real-time insights.

By providing actionable insights, GetDX enables data-driven decision-making, allowing developers to focus on building and deploying applications rather than managing complex deployment details.

Key Features

  • Provides a suite of tools that capture data from surveys and systems in real time.
  • Supports high performance by delivering real-time, actionable insights that help teams optimize speed and efficiency.
  • Contextualizes performance with 180,000+ industry benchmark samples.
  • Uses advanced statistical analysis to identify the top opportunities.

Limitations 

  • GetDX's frequent updates and features can disrupt user experience and confuse teams. 
  • New managers often face a steep learning curve. 
  • Users managing multiple teams face configuration and managing team data difficulties. 

Jellyfish 

Jellyfish is a developer experience platform that combines developer-reported insights with system metrics. It also includes features for application security, embedding security testing and vulnerability management into the software development lifecycle. It captures qualitative and quantitative data to provide a complete picture of the development ecosystem and identify bottlenecks. Jellyfish can be seamlessly integrated with survey tools or use sentiment analysis to gather direct feedback from developers. Additionally, Jellyfish is compatible with a wide range of tech stack components, ensuring smooth integration with existing tools and technologies.

Key Features

  • Enables continuous feedback loops and rapid response to developer needs.
  • Allows teams to track effort without time tracking.
  • Tracks team health metrics such as code churn and pull request review times.
  • Helps teams optimize processes by providing actionable insights that streamline workflows and improve efficiency.

Limitations

  • Problem in integrating with popular tools like Jira and Okta which complicates the initial setup process and affects the overall user experience.
  • Absence of an API restricts users from exporting metrics for further analysis in other systems. 
  • Overlooks important aspects of developer productivity by emphasizing throughput over qualitative metrics. 

LinearB

LinearB provides engineering teams with data-driven insights and automation capabilities.  This software delivery intelligence platform provides teams with full visibility and control over developer experience and productivity. LinearB also helps them focus on the most important aspects of coding to speed up project delivery. For those interested in exploring other options, see our guide to LinearB alternative and LinearB alternatives.

By automating routine tasks and integrating with existing tools, LinearB significantly reduces manual work for engineering teams.

Key Features

Limitations 

  • Teams that do not utilize GIT-based workflow may find that many of the features are not applicable or useful to their processes.
  • Lacks comprehensive historical data or external benchmarks.
  • Needs to rely on separate tools for comprehensive project tracking and management. 

Github Copilot 

Github Copilot was developed by GitHub in collaboration with open AI. It supports open source projects by helping developers identify, manage, and secure open-source packages, which is essential for preventing vulnerabilities and ensuring compliance. It uses an open AI codex for writing code, test cases and code comments quickly. Github Copilot helps developers by providing AI-powered code suggestions, accelerating programming tasks, and aiding in writing higher-quality code more efficiently. It draws context from the code and suggests whole lines or complete functions that developers can accept, modify, or reject. Github Copilot can generate code in multiple languages including Typescript, Javascript and C++. Copilot is also designed to empower developers by increasing their confidence, productivity, and autonomy in coding.

Key Features

  • Creates predictive lines of code from comments and existing patterns in the code.
  • Seamlessly integrates with popular editors such as Neovim, JetBrains IDEs, and Visual Studio.
  • Helps increase developer productivity by providing intelligent code suggestions, enabling faster coding and reducing errors.
  • Create dictionaries of lookup data.

Limitations 

  • Struggles to fully grasp the context of complex coding tasks or specific project requirements.
  • Less experienced developers may become overly reliant on Copilot for coding task.
  • Can be costly for smaller teams. 

Postman 

Postman is a widely used automation testing tool for API. It is also widely used for API development, offering features that simplify designing, building, and collaborating on APIs throughout their lifecycle. It provides a streamlined process for standardizing API testing and monitoring it for usage and trend insights. This tool provides a collaborative environment for designing APIs using specifications like OpenAPI and a robust testing framework for ensuring API functionality and reliability.

Key Features

  • Enables users to mimic real-world scenarios and assess API behavior under various conditions.
  • Creates mock servers, and facilitates realistic simulations and comprehensive testing.
  • Supports the creation and testing of serverless functions, allowing developers to deploy code that runs on-demand without managing servers, which is essential for scalable and efficient web application development.
  • Auto-generates documentation to make APIs easily understandable and accessible.

Limitations 

  • User interface non friendly for beginners. 
  • Heavy reliance on Postman may create challenges when migrating workflows to other tools or platforms.
  • More suitable for manual testing rather than automated testing. 


Claude Code

Claude Code is an AI-powered coding assistant designed to help developers write, understand, and debug code more efficiently. Leveraging advanced natural language processing, it can interpret developer queries in plain English and generate relevant code snippets, explanations, or suggestions to streamline the software development process.

Claude Code enhances the developer experience by integrating seamlessly into existing workflows, reducing friction, and enabling developers to focus on higher-value tasks.

Key Features

  • Provides natural language code generation and explanation across multiple programming languages.
  • Assists in debugging by identifying potential errors and offering fixes or improvements.
  • Supports collaborative coding by facilitating clear communication and code sharing.
  • Integrates with popular IDEs and platforms to enable smooth adoption without disrupting existing tech stacks.
  • Helps automate tedious tasks, freeing developers to spend more time writing quality code.

Limitations

  • May occasionally produce inaccurate or incomplete code suggestions requiring manual review.
  • Performance can vary depending on the complexity of the codebase and query specificity.
  • Some advanced features may require a subscription or access through specific platforms.

Cursor

Cursor is an AI-powered coding assistant designed to enhance developer productivity by providing intelligent code completions, debugging support, and seamless integration with popular IDEs. It helps developers focus on writing high-quality code by automating repetitive tasks and offering instant previews of code changes.

Key Features

  • Integrates smoothly with popular IDEs such as VS Code and JetBrains, enabling developers to stay within their preferred development environment.
  • Provides AI-driven code completions that adapt to the context, reducing the time spent writing boilerplate or repetitive code.
  • Includes integrated debugging tools that help identify and fix errors quickly without leaving the IDE.
  • Offers instant previews to visualize code changes in real-time, accelerating the development and testing process.
  • Supports collaboration by allowing developers to share code snippets and feedback within the platform.

Limitations

  • AI suggestions may occasionally lack full context for complex projects, requiring manual review.
  • Some advanced features require a subscription, which might be a barrier for smaller teams.
  • Integration with less common IDEs is limited compared to mainstream editors.

Vercel 

Vercel is a cloud platform that gives frontend developers space to focus on coding and innovation. Vercel is known for enabling high performance in web applications by leveraging optimized deployment processes and a global edge network. It simplifies the entire lifecycle of web applications by automating the entire deployment pipeline. Vercel has collaborative features such as preview environments to help iterate quickly while maintaining high code quality. Vercel also supports serverless functions, allowing developers to deploy code that runs on-demand without managing servers.

Key Features

  • Applications can be deployed directly from their Git repositories.
  • Includes pre-built templates to jumpstart the app development process.
  • Allows to create APIs without managing traditional backend infrastructure.
  • Automation features help reduce manual work in deployment and scaling, streamlining workflows and improving efficiency.

Limitations

Quovery 

A cloud deployment platform to simplify the deployment and management of applications. Quovery simplifies managing infrastructure, making it easier for teams to deploy and scale their applications.

It automates essential tasks such as server setup, scaling, and configuration management that allows developers to prioritize faster time to market instead of handling infrastructure. Quovery automates deployment tasks, allowing developers to focus on building applications.

Key Features

  • Supports the creation of ephemeral environments for testing and development.
  • Scales applications automatically on demand.
  • Helps teams optimize processes by automating deployment and scaling, streamlining workflows for greater efficiency.
  • Includes built-in security measures such as multi-factor authentication and fine-grained access controls.

Limitations

  • Occasionally experiences minor bugs.
  • Can be overwhelming for those new to cloud and DevOps.
  • Deployment times may be slow.

Conclusion 

We've curated the best Developer Experience tools for you in 2025. Feel free to explore other options as well. Make sure to do your own research and choose what fits best for you.

All the best!

CTO’s Guide to Software Engineering Efficiency

CTO’s Guide to Software Engineering Efficiency

As a CTO, you often face a dilemma: should you prioritize efficiency or effectiveness? It’s a tough call.

To achieve optimal results, organizations must focus on both productivity and efficiency, ensuring that neither is sacrificed for the other.

Engineering efficiency ensures your team delivers quickly and with fewer resources. On the other hand, effectiveness ensures those efforts create real business impact. Software development efficiency, distinct from productivity, is about maximizing output while maintaining quality—doing the right things properly within a given timeframe. Efficiency in software engineering means the effort put into the work was the best bang for your buck.

So choosing one over the other is definitely not the solution. Quantitative metrics can help evaluate and maximize output in software engineering by providing measurable insights into team performance and process efficiency.

That’s why we came up with this guide to software engineering efficiency.

Defining Software Engineering Efficiency 

Software engineering efficiency is the intersection of speed, quality, and cost. It’s not just about how quickly code ships or how flawless it is; it’s about delivering value to the business while optimizing resources through the use of engineering metrics that help measure efficiency. Efficient engineering translates into quicker delivery of high-quality products, ensuring customer satisfaction.

True efficiency is when engineering outputs directly contribute to achieving strategic business goals—without overextending timelines, compromising quality, or overspending. Engineering leadership plays a crucial role in ensuring that these outputs are aligned with desired business outcomes.

A holistic approach to efficiency means addressing every layer of the engineering process. It starts with streamlining workflows to minimize bottlenecks, adopting tools that enhance productivity, and setting clear KPIs for code quality and delivery timelines, using engineering metrics to measure efficiency and generate meaningful insights that drive continuous improvement. Minimizing work in progress (WIP) helps prevent context switching and improves productivity.

As a CTO, to architect this balance, you need to foster collaboration between cross-functional teams, defining clear metrics for efficiency and ensuring that resource allocation prioritizes high-impact initiatives. Engineering leadership leverages these metrics to align engineering efforts with business outcomes, ensuring that measuring engineering efficiency translates into real organizational value. A highly capable engineering team can accelerate the time-to-market for new features, giving the business a competitive edge.

Understanding Development Process

The software development process represents a sophisticated orchestration of interconnected phases that transforms abstract concepts into robust, production-ready applications. How do CTOs and engineering leaders navigate this complex landscape to achieve exceptional software engineering efficiency? The development lifecycle encompasses critical stages including requirement analysis and gathering, architectural design, implementation with modern frameworks, comprehensive testing strategies, deployment automation, and continuous maintenance protocols. Each phase presents unique technical challenges and strategic opportunities for performance optimization, from leveraging natural language processing for requirement classification to implementing AI-driven code analysis for quality assurance.

What does optimizing the software development process truly entail in today's rapidly evolving technological landscape? It involves systematically identifying and eliminating pipeline bottlenecks, streamlining handoffs between cross-functional teams through automated workflows, and ensuring that each development phase delivers quantifiable business value. By focusing on engineering efficiency at every step—from microservices architecture decisions to CI/CD pipeline configurations—organizations can dramatically accelerate delivery velocity without compromising software quality or inflating operational costs. Modern optimization strategies leverage machine learning algorithms to predict resource allocation needs, automate routine development tasks, and provide intelligent insights for architectural decisions.

Measuring software engineering efficiency within the development process relies on comprehensive tracking of key performance indicators (KPIs) such as deployment frequency, lead time for changes, mean time to recovery, and change failure rates. These metrics provide engineering leaders with actionable intelligence into how rapidly and reliably new features, bug fixes, and system enhancements reach production environments. By continuously analyzing these KPIs through advanced monitoring tools and data visualization platforms, leaders can pinpoint inefficiencies in their development workflows, prioritize high-impact improvements, and implement data-driven changes that foster continuous progress. Ultimately, this analytical approach to the development process empowers engineering teams to deliver superior software products with greater velocity and stronger alignment to strategic business objectives.

Establishing Tech Governance 

Tech governance refers to the framework of policies, processes, and standards that guide how technology is used, managed, and maintained within an organization. A robust measurement process is a key part of effective governance, enabling organizations to systematically evaluate engineering quality and team performance.

For CTOs, it’s the backbone of engineering efficiency, ensuring consistency, security, and scalability across teams and projects.

Here’s why tech governance is so important:

  • Standardization: Promotes uniformity in tools, processes, and coding practices.
  • Risk Mitigation: Reduces vulnerabilities by enforcing compliance with security protocols.
  • Operational Efficiency: Streamlines workflows by minimizing ad-hoc decisions and redundant efforts.
  • Scalability: Prepares systems and teams to handle growth without compromising performance.
  • Transparency: Provides clarity into processes, enabling better decision-making and accountability.
  • Continuous Improvement: Involves an assessment team to ensure compliance, benchmark performance, and drive ongoing optimization.

For engineering efficiency, tech governance should focus on three core categories:

1. Configuration Management

Configuration management is foundational to maintaining consistency across systems and software, ensuring predictable performance and behavior.

It involves rigorously tracking changes to code, dependencies, and environments to eliminate discrepancies that often cause deployment failures or bugs.

Using tools like Git for version control, Terraform for infrastructure configurations, or Ansible for automation ensures that configurations are standardized and baselines are consistently enforced.

This approach not only minimizes errors during rollouts but also reduces the time required to identify and resolve issues, thereby enhancing overall system reliability and deployment efficiency.

Strong configuration management practices also contribute to cost reduction by minimizing errors and reducing maintenance overhead, leading to greater operational efficiency.

2. Infrastructure Management 

Infrastructure management focuses on effectively provisioning and maintaining the physical and cloud-based resources that support software engineering operations.

The adoption of Infrastructure as Code (IaC) practices allows teams to automate resource provisioning, scaling, and configuration updates, ensuring infrastructure remains agile and cost-effective. These practices also help optimize resource allocation by providing better visibility into planning metrics and engineering workloads, which improves efficiency and project forecasting.

Advanced monitoring tools like Typo provide real-time SDLC insights, enabling proactive issue resolution and resource optimization.

By automating repetitive tasks, infrastructure management frees engineering teams to concentrate on innovation rather than maintenance, driving operational efficiency at scale.

3. Frameworks for Deployment 

Frameworks for deployment establish the structured processes and tools required to release code into production environments seamlessly. Within the broader software development life cycle, deployment frameworks play a crucial role in ensuring efficient transitions between development, testing, and production stages.

A well-designed CI/CD pipeline automates the stages of building, testing, and deploying code, ensuring that releases are both fast and reliable.

Additionally, rollback mechanisms safeguard against potential issues during deployment, allowing for quick restoration of stable environments. This streamlined approach reduces downtime, accelerates time-to-market, and fosters a collaborative engineering culture.

Together, these deployment frameworks enhance software delivery and also ensure that the systems remain resilient under changing business demands.

By focusing on these tech governance categories, CTOs can build a governance model that maximizes efficiency while aligning engineering operations with strategic objectives.

Engineering Organization and Leadership

Leveraging high-performing engineering organizations requires establishing robust leadership frameworks and maintaining strategic focus on engineering efficiency optimization. Engineering leaders are responsible for architecting comprehensive visions, aligning cross-functional teams with business objectives, and ensuring that development processes operate seamlessly across all operational phases. Effective leaders facilitate open communication channels, encourage collaborative workflows across departments, and create environments where teams are systematically working toward shared strategic objectives that drive organizational success. Continuous learning and providing training opportunities keep the team's skills current with new technologies and best practices.

To measure engineering performance metrics and drive continuous improvement initiatives, leaders must leverage key performance indicators such as cycle time optimization, deployment frequency analysis, and comprehensive code quality assessments. By tracking these critical indicators through automated monitoring systems, engineering leaders can make informed, data-driven decisions that optimize development processes and maximize team performance across all project phases. Regularly reviewing these metrics through systematic analysis helps identify specific areas where efficiency can be enhanced, whether through process automation adjustments, strategic resource allocation optimization, or targeted skill development programs.

Continuous improvement methodologies and knowledge sharing frameworks are essential for achieving engineering excellence across development lifecycles. Leaders should promote organizational cultures where teams are systematically encouraged to learn from both successful implementations and failure scenarios, share best practices through documented processes, and experiment with innovative tools or advanced methodologies. This commitment to ongoing organizational growth enables engineering teams to consistently deliver high-quality software solutions, adapt to evolving business requirements, and contribute to long-term strategic business success through optimized development workflows.

Balancing Business Impact and Engineering Productivity 

If your engineering team’s efforts don’t align with key objectives like revenue growth, customer satisfaction, or market positioning, you’re not doing justice to your organization.

It’s crucial for development teams to align their efforts with key business outcomes to maximize impact and ensure their work delivers real value.

To ensure alignment, focus on building features that solve real problems, not just “cool” additions.

1. Chase value addition, not cool features 

Rather than developing flashy tools that don’t address user needs, prioritize features that improve user experience or address pain points. Focusing on producing quality code ensures that these value-added features remain maintainable and reliable over time. This prevents your engineering team from being consumed by tasks that don’t add value and keeps their efforts laser-focused on meeting demand.

2. Decision-making is a crucial factor 

You need to know when to prioritize speed over quality or vice versa. For example, during a high-stakes product launch, speed might be crucial to seize market opportunities. However, if a feature underpins critical infrastructure, you’d prioritize quality and scalability to avoid long-term failures. Balancing these decisions requires clear communication and understanding of business priorities. Understanding the team's ability to balance speed and quality is crucial for making effective decisions.

3. Balance innovation and engineering efficiency 

Encourage your team to explore new ideas, but within a framework that ensures tangible outcomes. Fostering engineering team efficiency enables teams to innovate without sacrificing productivity, ensuring that creative solutions are delivered effectively. Innovation should drive value, not just technical novelty. This approach ensures every project contributes meaningfully to the organization’s success.

Implementing DevOps Practices

Adopting DevOps practices represents a transformative strategy for maximizing engineering efficiency and accelerating business success across modern software organizations. By seamlessly integrating development and operations teams, DevOps methodologies streamline the entire development lifecycle, enabling engineering teams to deliver software applications faster and with significantly enhanced reliability. Key DevOps practices—including continuous integration (CI), continuous deployment (CD), and automated testing frameworks—fundamentally reduce manual intervention, minimize human-induced errors, and dramatically increase deployment frequency while maintaining code quality standards.

Engineering organizations can strategically leverage integrated development environments (IDEs) like Visual Studio Code with DevOps extensions, alongside agile methodologies and Infrastructure as Code (IaC) tools such as Terraform and Ansible to substantially enhance their DevOps initiatives. These cutting-edge tools and methodologies support rapid iteration cycles, improve cross-functional collaboration between development and operations teams, and significantly simplify the management of complex multi-environment workflows. By automating repetitive deployment tasks and standardizing CI/CD pipeline processes through platforms like Jenkins, GitLab CI, or Azure DevOps, engineering teams can redirect their focus toward high-value innovation activities that directly drive customer satisfaction and competitive differentiation.

Tracking critical performance metrics such as deployment frequency, lead time for changes, mean time to recovery (MTTR), and change failure rate proves essential for accurately measuring the tangible impact of DevOps implementation across engineering organizations. These key performance indicators (KPIs) provide invaluable insights into automation effectiveness, delivery velocity optimization, and team responsiveness to production incidents. By continuously monitoring and iteratively refining their DevOps processes through data-driven approaches, engineering organizations can systematically reduce technical debt accumulation, enhance overall software quality standards, and establish a sustainable competitive advantage within the rapidly evolving software industry landscape. Ultimately, implementing comprehensive DevOps practices empowers cross-functional teams to consistently deliver high-quality software products with exceptional efficiency, supporting both immediate operational business needs and strategic long-term organizational growth objectives.

Communicating Efficiency to the CEO and Board 

If you’re at a company where the CEO doesn’t come from a technical background — you will face some communication challenges. There will always be questions about why new features are not being shipped despite having a good number of software engineers.

It is crucial to tailor efficiency reports to the senior executive level, ensuring that the information aligns with organizational priorities and provides leadership with the right metrics to assess engineering performance.

What you should focus on is giving the stakeholders insights into how the engineering headcount is being utilized.

1. Reporting Software Engineering Efficiency 

Instead of presenting granular task lists, focus on providing a high-level summary of accomplishments tied to business objectives. For example, show the percentage of technical debt reduced, the cycle time improvements, or the new features delivered and their impact on customer satisfaction or revenue.

Include visualizations like charts or dashboards to offer a clear, data-driven view of progress. These tools help track progress toward engineering goals by making it easy to monitor project advancements and measure performance against key metrics. Highlight key milestones, ongoing priorities, and how resources are being allocated to align with organizational goals.

2. Translating Technical Metrics into Business Language

Board members and CEOs may not resonate with terms like “code churn” or “defect density,” but they understand business KPIs like revenue growth, customer retention, and market expansion. 

For instance, instead of saying, “We reduced bug rate by 15%,” explain, “Our improvements in code quality have resulted in a 10% reduction in downtime, enhancing user experience and supporting retention.” 

3. Building Trust Through Transparency

Trust is built when you are upfront about trade-offs, challenges, and achievements. 

For example, if you chose to delay a feature release to improve scalability, explain the rationale: “While this slowed our time-to-market, it prevents future bottlenecks, ensuring long-term reliability.” 

4. Framing Discussions Around ROI and Risk Management

Frame engineering decisions in terms of ROI, risk mitigation, and long-term impact. For example, explain how automating infrastructure saves costs in the long run or how adopting robust CI/CD practices reduces deployment risks. Linking these outcomes to strategic goals ensures the board sees technology investments as valuable, forward-thinking decisions that drive sustained business growth. 

Build vs. Buy Decisions 

Deciding whether to build a solution in-house or purchase off-the-shelf technology is crucial for maintaining software engineering efficiency. The build vs. buy decision is a complex process involving multiple factors that must be carefully evaluated. Here’s what to take into account:

1. Cost Considerations 

From an engineering efficiency standpoint, building in-house often requires significant engineering hours that could be spent on higher-value projects. The direct costs include developer time, testing, and ongoing maintenance. Hidden costs like delays or knowledge silos can also reduce operational efficiency. 

Conversely, buying off-the-shelf technology allows immediate deployment and support, freeing the engineering team to focus on core business challenges. 

However, it's crucial to evaluate licensing and customization costs to ensure they don't create inefficiencies later. 

2. Strategic Alignment 

For software engineering efficiency, the choice must align with broader business goals. Building in-house may be more efficient if it allows your team to streamline unique workflows or gain a competitive edge. 

However, if the solution is not central to your business's differentiation, buying ensures the engineering team isn't bogged down by unnecessary development tasks, maintaining their focus on high-impact initiatives. 

3. Scalability, Flexibility, and Integration 

An efficient engineering process requires solutions that scale with the business, integrate seamlessly into existing systems, and adapt to future needs. 

While in-house builds offer customization, they can overburden teams if integration or scaling challenges arise. 

Off-the-shelf solutions, though less flexible, often come with pre-tested scalability and integrations, reducing friction and enabling smoother operations. 

Key Metrics CTOs Should Measure for Software Engineering Efficiency 

While the CTO’s role is rooted in shaping the company’s vision and direction, it also requires ensuring that software engineering teams maintain high productivity.

However, relying solely on traditional metrics—such as lines of code, story points, commit counts, or even DORA metrics—can be limiting, as these may not fully capture real developer performance or the nuances of modern workflows. Google's DevOps research, particularly the work of the DORA team, has been instrumental in identifying key engineering metrics like deployment frequency, lead time, and reliability, which help organizations assess and improve their software delivery performance. Additionally, the rise of generative AI tools, such as Copilot X and ChatGPT, is transforming how productivity and efficiency are measured, as these tools enable developers to complete tasks significantly faster and require new approaches to tracking impact.

Here are some of the metrics you should keep an eye on:

1. Cycle Time 

Cycle time measures how long it takes to move a feature or task from development to deployment. A shorter cycle time means faster iterations, enabling quicker feedback loops and faster value delivery. Monitoring this helps identify bottlenecks and improve development workflows. 

2. Lead Time 

Lead time tracks the duration from ideation to delivery. It encompasses planning, design, development, and deployment phases. A long lead time might indicate inefficiencies in prioritization or resource allocation. By optimizing this, CTOs ensure that the team delivers what matters most to the business in a timely manner.

3. Velocity 

Velocity measures how much work a team completes in a sprint or milestone. This metric reflects team productivity and helps forecast delivery timelines. Tracking story points at the team level enables engineering leadership to monitor planned versus completed work, providing insights into development velocity and helping identify areas for improvement. Consistent or improving velocity is a strong indicator of operational efficiency and team stability.

4. Bug Rate and Defect Density

Bug rate and defect density assess the quality and reliability of the codebase. High values indicate a need for better testing or development practices. Incorporating code reviews into the development process helps maintain code quality and reduces the number of defects by catching issues early and promoting consistency. Implementing a clear code review process maintains code quality and facilitates knowledge sharing. Tracking these ensures that speed doesn’t come at the expense of quality, which can lead to technical debt.

5. Code Churn 

Code churn tracks how often code changes after the initial commit. Excessive churn may signal unclear requirements or poor initial implementation. If not managed properly, high code churn can also contribute to increased tech debt, making it important to track and address to maintain workflow efficiency. Keeping this in check ensures efficiency and reduces rework.

By selecting and monitoring these metrics, you can align engineering outcomes with strategic objectives while building a culture of accountability and continuous improvement.

Conclusion 

The CTO plays a crucial role in driving software engineering efficiency, balancing technical execution with business goals.

By focusing on key metrics, establishing strong governance, and ensuring that engineering efforts align with broader company objectives, CTOs help maximize productivity while minimizing waste.

A balanced approach to decision-making—whether prioritizing speed or quality—ensures both immediate impact and long-term scalability.

Effective CTOs deliver efficiency through clear communication, data-driven insights, and the ability to guide engineering teams toward solutions that support the company’s strategic vision. CTOs should continually seek ways to improve efficiency through strategic decision-making and the adoption of best practices.

View All

AI

View All
ai-impact-dora-metrics

Harnessing AI Impact on DORA Metrics for Enhanced DevOps Performance

Introduction

AI impact on DORA metrics reveals a striking productivity paradox: individual developers merged 98% more pull requests while organizational software delivery performance remained essentially flat. The 2025 DORA Report—retitled “State of AI-assisted Software Development”—surveyed nearly 5,000 technology professionals and uncovered that AI tools amplify existing team capabilities rather than universally improving delivery metrics.

This article covers the 2025 DORA Report findings, the seven team archetypes that replaced traditional performance tiers, and practical measurement strategies for engineering leaders navigating AI adoption. The target audience includes VPs and Directors of Engineering responsible for measuring AI tool ROI, deployment frequency improvements, and overall engineering performance. Understanding why AI benefits vary so dramatically across teams has become essential for any organization investing in AI coding assistants.

Direct answer: AI acts as an amplifier that magnifies whatever work practices, cultural health, and platform maturity already exist in an organization. Strong teams see gains; teams with foundational challenges see their dysfunction worsen. This means engineering leaders must fix DORA metric baselines before expecting AI investment to deliver meaningful improvement.

By the end of this article, you will understand:

  • Why the productivity paradox exists and what telemetry data reveals about individual vs. organizational outcomes
  • How to identify your team’s archetype and tailor AI strategy accordingly
  • Which seven foundational practices determine successful AI adoption
  • How to implement AI-aware measurement that provides actionable insights beyond traditional DORA metrics
  • What immediate steps to take in the next 12 months before competitive disadvantages become permanent

Understanding AI’s Amplifier Effect on DORA Metrics

The 2025 DORA Report introduced a critical framing: AI acts as an “amplifier” or “multiplier” rather than a universal productivity booster. According to DevOps research conducted by Google Cloud, organizations with strong engineering systems, healthy data ecosystems, and mature internal platforms see positive gains from AI adoption. Organizations with weak foundations see those weaknesses magnified—higher change failure rate, more production failures, and increased rework.

AI adoption among software professionals surged to approximately 90% in 2025, up from roughly 75% the previous year. Most professionals now use AI tools daily, with median usage around two hours per day. Over 80% report improved individual productivity, and roughly 59% report improved code quality. Yet these perception-based gains don’t translate uniformly to organizational performance—the core insight that defines the AI era for engineering teams.

The 2025 DORA Metrics Evolution

The DORA framework historically tracked four core metrics—Change Lead Time, Deployment Frequency, Change Failure Rate, and Mean Time to Recovery—as the foundation for measuring software delivery performance. These four metrics were used to categorize teams into different performance levels and benchmark improvement areas. In 2024, the DORA framework evolved to include five metrics, adding Deployment Rework Rate and removing the elite/high/medium/low performance tiers that defined earlier reports.

Throughput metrics now include:

  • Lead time for changes (time from committed code to production)
  • Deployment frequency
  • Failed deployment recovery time (essentially moving recovery speed into throughput measurement)

Instability metrics include:

  • Change failure rate (percentage of deployments that fail, require rollback, or cause production incidents—failures or issues that occur after deployment)
  • Rework Rate—a new valid metric that counts unplanned deployments required due to production issues

The addition of Rework Rate acknowledges that failures aren’t always outright rollbacks. Many disruptions are remediated via additional fixes, and tracking this provides a more complete picture of delivery stability. New metrics added to the DORA framework include Deployment Rework Rate and measures of AI Code Share, Code Durability, and Complexity-Adjusted Throughput.

Deployment Rework Rate measures the frequency of unplanned deployments required due to production issues.
AI Code Share tracks the proportion of code generated by AI tools.
Code Durability assesses how long code survives without major rework.
Complexity-Adjusted Throughput accounts for the complexity of changes when measuring delivery speed.

This evolution directly addresses AI-era challenges where AI-generated code may increase deployment volume while simultaneously creating quality assurance burdens downstream. Lead Time for Changes can drop initially as AI accelerates code writing, but bottlenecks may shift to code review, increasing the review time significantly. Tracking code that survives without major rework over time is also important for understanding long-term stability.

Platform Engineering as the AI Success Foundation

Research shows that platform engineering stands out as the primary enabler of successful AI adoption. Approximately 90% of organizations have adopted at least one internal developer platform, and 76% have dedicated platform teams. High-quality internal platforms correlate strongly with AI amplification benefits—teams can move faster because CI/CD pipelines, monitoring, version control practices, and developer experience infrastructure absorb the increased code velocity AI enables, especially when they already understand the importance of DORA metrics for boosting tech team performance.

Without strong platforms, AI tools’ output creates chaos. More committed code flowing through immature pipelines leads to bottlenecks in code review, longer queues, and ultimately more deployments fail. The DORA AI capabilities model emphasizes that platform prerequisites must exist before AI adoption can translate individual developer productivity into organizational outcomes.

This connection between foundational capabilities and the productivity paradox explains why some high performing teams thrive with AI while others struggle.

The AI Productivity Paradox: Individual Gains vs Organizational Outcomes

The productivity paradox represents the most significant finding from 2025: individual developers produce dramatically more output, but engineering teams don’t see proportional improvements in delivery speed or business outcomes. Faros AI, analyzing telemetry from over 10,000 developers, quantified this gap with precision that survey data alone cannot provide, which underscores both the strengths and pros and cons of DORA metrics for continuous delivery.

Individual Developer Metrics Show Strong Gains

At the individual level, AI assisted coding delivers measurable improvements:

  • 98% more pull requests merged per developer
  • 21% more tasks completed per period with AI assistance
  • 67.4% more PR contexts being handled, indicating increased cognitive complexity management

Individual developers report that AI coding assistants help them code faster, produce better documentation, and move through routine tasks with less friction. These gains are real and substantial. The challenge is that individual productivity improvements don’t automatically flow through to organizational performance.

Organizational DORA Metrics Remain Flat

Despite the surge in individual output, Faros AI’s telemetry revealed that organizational delivery metrics—deployment frequency, lead time, and the ability to quickly restore service after incidents (recovery speed)—showed no noticeable improvement. The traditional DORA metrics remained essentially flat across their sample.

Worse, several quality and efficiency signals degraded:

  • Code review time increased approximately 91%—reviewers couldn’t keep pace with AI generated code volume
  • PR sizes grew roughly 154%—larger, more complex changes that take longer to review and more likely to cause issues
  • Bug rates increased approximately 9% when PRs became larger and reviews less efficient. The Change Failure Rate tends to rise significantly, by up to 7.2%, as AI-generated code is often larger and more prone to subtle bugs.
  • 13.8% increase in work restarts indicating systemic issues with code quality or requirements clarity
  • 26% more stalled tasks as review bottlenecks and integration challenges increased. Mean Time to Recover (MTTR) is generally the least affected metric as incident response relies on human judgment, and the ability to quickly restore service remains critical.

This data reveals where AI benefits evaporate: somewhere between individual contribution and organizational delivery, bottlenecks absorb the productivity gains. The complete picture shows AI helps individual developers produce more, but without corresponding improvements in review processes, pipeline efficiency, and quality assurance, that output creates downstream burden rather than business outcomes and often surfaces as classic signs of declining DORA metrics.

The Seven Critical AI Capabilities

The DORA AI capabilities model identifies seven foundational practices that determine whether AI adoption succeeds or fails at the organizational level:

  • Clear and communicated AI stance/governance: Organizations with explicit policy and guidelines about AI usage see better outcomes than those with grassroots experimentation
  • Healthy data ecosystems: Clean data, accessible logs, usable metrics and telemetry enable AI tools to work effectively
  • AI-accessible internal data: Codebases, documentation, and tools structured so AI can work with context
  • Strong version control practices: Atomic commits, branch discipline, small changes, and traceability
  • Small-batch, iterative workflows: The discipline to ship incrementally rather than accumulate large changes
  • User-centric focus: Keeping real problems and product goals central rather than optimizing for output metrics
  • Quality internal platforms: Developer experience infrastructure that enables rather than impedes flow

Teams that score well on these seven capabilities convert AI adoption into real performance benefits. Teams lacking these foundations experience the amplifier effect negatively—AI magnifies their dysfunction rather than solving it.

Seven Team Archetypes and AI Measurement Strategies

The 2025 DORA Report replaced the traditional linear performance tiers (Elite, High, Medium, Low) with seven team archetypes. This shift reflects a more nuanced understanding that team performance is multidimensional—throughput matters, but so does instability, team health, valuable work time, friction, and burnout, which aligns with newer DORA metrics guides for engineering leaders that emphasize a broader view of performance.

The Archetype Framework

The seven archetypes are built from multiple dimensions, which still rely on mastering core DORA metrics implementation:

  • Throughput metrics (lead time, deployment frequency, recovery time)
  • Instability metrics (change failure rate, rework rate)
  • Product performance (business impact, user satisfaction)
  • Individual effectiveness (developer perception)
  • Time spent on valuable work vs. rework
  • Friction in workflows
  • Burnout levels

Gene Kim and the DORA researchers developed this framework because teams with identical DORA metrics might have vastly different experiences and outcomes. A team deploying frequently with low failure rate but high burnout requires different interventions than one with the same metrics but healthy team dynamics.

AI Impact by Team Archetype

  • Harmonious High-Achievers (~20%)
    Current DORA Profile: High throughput, low instability, low burnout
    AI Impact Pattern: Amplified excellence, quality risks at scale
    Measurement Priority: Monitor rework rate and code complexity closely
  • Pragmatic Performers (~20%)
    Current DORA Profile: Strong throughput and stability, moderate engagement
    AI Impact Pattern: Productivity gains with engagement risk
    Measurement Priority: Track time spent on valuable work
  • Stable and Methodical (~15%)
    Current DORA Profile: Quality-focused, measured throughput
    AI Impact Pattern: Benefits from AI with discipline
    Measurement Priority: Maintain failure rate baselines
  • Constrained by Process (~17%)
    Current DORA Profile: Variable performance, process friction
    AI Impact Pattern: AI exacerbates friction
    Measurement Priority: Streamline review and approval workflows first
  • Legacy Bottleneck (~11%)
    Current DORA Profile: Slow deployment, reactive workloads
    AI Impact Pattern: Limited AI benefits until platform investment
    Measurement Priority: Fix foundations before AI rollout
  • High Impact, Low Cadence (~7%)
    Current DORA Profile: High value, infrequent delivery
    AI Impact Pattern: Mixed stability
    Measurement Priority: Balance throughput push with quality gates
  • Foundational Challenges (~10%)
    Current DORA Profile: Struggling across all metrics
    AI Impact Pattern: AI worsens dysfunction
    Measurement Priority: Fix basics before any AI adoption

Tailored AI Strategies by Archetype

Strategies for Foundational Challenges Teams

Prioritize establishing basic CI/CD pipelines, test coverage, build quality, and simple rollback mechanisms. AI adoption before these foundations exist will amplify chaos.

Strategies for Legacy Bottleneck Teams

Address technical debt, modularize monolithic systems, and create internal platforms to standardize processes. AI tools can help with code modernization, but platform investment must come first.

Strategies for Constrained by Process Teams

Identify process friction—reviews, decision bottlenecks, approval chains—and streamline or automate them. Adding AI-generated code to a team already drowning in review backlog makes things worse.

Strategies for High Performing Organizations

Guard against quality degradation by monitoring instability metrics closely. Success creates risk: as throughput increases, maintaining code quality and architecture discipline becomes harder.

Common AI Measurement Challenges and Solutions

Administrative Groupings vs Real Teams

Challenge: HR hierarchies define teams administratively, but actual collaboration patterns don’t match org charts. AI tool adoption may be high in one administrative group while the engineers actually working together span multiple groups.

Solution: Combine HR hierarchies with telemetry data to measure actual collaboration patterns. Track who reviews whose code, who co-authors changes, and where knowledge flows. This provides a more accurate picture of where AI adoption is actually impacting delivery.

Attribution Errors from Developer Movement

Challenge: Developers move between teams, change roles, and contribute to multiple repositories. Attributing AI impact to specific teams or projects becomes unreliable.

Solution: Track AI-influenced code contributions across team boundaries with proper tooling. Engineering intelligence platforms like Typo can measure AI-influenced PR outcomes with verified data rather than relying on license adoption estimates or self-reported usage, which is critical when implementing DORA DevOps metrics in large organizations.

Missing AI-Specific Metrics

Challenge: Traditional DORA metrics don’t distinguish between AI generated code and human-written code. You can’t assess whether AI is helping or hurting without this visibility.

Solution: Layer AI adoption rate, acceptance rates, and quality impact on traditional DORA metrics. Track:

  • Percentage of PRs with AI assistance
  • PR review time for AI-assisted vs. non-AI PRs
  • Bug density in AI-generated vs. manual code
  • Batch size and code complexity trends

Value Stream Visibility Gaps

Challenge: AI productivity gains evaporate somewhere in the delivery pipeline, but without end-to-end visibility, you can’t identify where.

Solution: Implement Value Stream Management to track flow from ideation through commit, review, QA, deploy, and post-release monitoring. This stream management approach reveals where time or defects accumulate—often in review queues or integration testing phases that become bottlenecks when AI dramatically increases deployment frequency upstream, and it depends on accurately measuring DORA metrics across the pipeline.

Conclusion and Next Steps

The 2025 DORA Report confirms that AI amplifies existing team patterns rather than uniformly improving software delivery performance. Teams with strong DORA baselines, mature platforms, and healthy engineering cultures see AI benefits compound. Teams with foundational challenges see AI worsen their dysfunction. The productivity paradox—individual gains that don’t translate to organizational outcomes—will persist until engineering leaders address the bottlenecks between developer output and business value delivery.

Immediate actions for engineering leaders:

  1. Assess your current team archetype using the seven-archetype framework. Understand whether your teams are positioned to benefit from AI or whether foundational fixes must come first.
  2. Establish AI measurement baselines that go beyond traditional DORA metrics. Track AI adoption rate, PR size trends, review time changes, and rework rate to understand AI’s actual impact.
  3. Implement platform prerequisites identified in the DORA AI capabilities model: governance clarity, healthy data ecosystems, version control discipline, and quality internal platforms.
  4. Deploy comprehensive measurement through engineering intelligence platforms that provide actionable insights into where AI productivity gains evaporate in your delivery pipeline.

The window for action is approximately 12 months. Organizations that successfully integrate AI with strong DORA foundations will achieve meaningful improvement in delivery speed and quality. Those that add AI to broken systems will see competitive disadvantages compound as their instability metrics worsen while competitors pull ahead.

Related topics worth exploring: Value Stream Management for end-to-end visibility, DevEx measurement for understanding developer friction, and AI ROI frameworks that connect tool investment to business outcomes.

Frequently Asked Questions

What did the 2025 DORA report say about AI?

The 2025 DORA Report found that approximately 90% of developers now use AI tools, with over 80% reporting productivity gains at the individual level. The central finding is that AI acts as an amplifier—magnifying organizational strengths and weaknesses rather than uniformly improving performance.

The report introduced seven critical capabilities that determine whether AI benefits scale to organizational performance: governance clarity, healthy data ecosystems, AI-accessible internal data, strong version control practices, small-batch workflows, user-centric focus, and quality internal platforms.

Notably, DORA researchers found no correlation between AI adoption and increased developer burnout, possibly because developers feel more productive even when downstream organizational stress increases.

Does AI improve DORA metrics or make them worse?

AI improves individual developer metrics but creates organizational delivery challenges. Teams with strong DORA baselines see amplified benefits; weak teams see amplified dysfunction.

Quality and stability signals often worsen despite throughput improvements. Faros AI telemetry showed bug rates increased approximately 9% and code review time increased 91% as AI-generated code volume overwhelmed review capacity.

Platform engineering maturity determines AI success more than tool adoption rates. Organizations with strong CI/CD pipelines, monitoring, and internal platforms convert AI productivity into delivery improvements. Organizations lacking these foundations see AI create more chaos.

How does AI affect deployment frequency and lead time?

Deployment frequency increases due to AI-generated code volume, but this may not reflect meaningful output. More deployments don’t automatically translate to faster value delivery if those deployments require rework or cause production incidents.

Lead time for changes reduces for individual contributions, but review bottlenecks increase as reviewers struggle to keep pace with higher code volume. The 91% increase in review time documented by Faros AI shows where individual lead time gains get absorbed.

Engineering leaders need to measure complexity-adjusted throughput rather than raw deployment counts. Failed deployment recovery time becomes a more critical metric than traditional MTTR because it captures the full cost of instability.

What are the seven team archetypes in DORA 2025?

The seven team archetypes are: Harmonious High-Achievers, Pragmatic Performers, Stable and Methodical, Constrained by Process, Legacy Bottleneck, High Impact Low Cadence, and Foundational Challenges.

Each archetype requires different AI adoption strategies and measurement approaches. Multidimensional classification considers throughput, stability, team well-being, friction, and time spent on valuable work—not just the four traditional DORA metrics.

One-size-fits-all AI strategies fail because a Legacy Bottleneck team needs platform investment before AI adoption, while Constrained by Process teams need to streamline workflows first. Harmonious High-Achievers can adopt AI aggressively but must monitor quality degradation.

How can engineering leaders measure AI impact on their teams?

Engineering leaders should combine traditional DORA metrics with AI adoption rates and code quality indicators. This means tracking not just deployment frequency and lead time, but also AI-influenced PR outcomes, PR size trends, review time changes, and rework rate.

Track AI-influenced PR outcomes with verified data rather than license adoption estimates. Engineering intelligence platforms like Typo provide visibility into actual AI usage patterns and their correlation with delivery and quality outcomes, complementing high-level resources that keep DORA metrics explained with practical insights.

Implement Value Stream Management to identify where AI gains evaporate in the delivery pipeline. Often, review queues, integration testing, or deployment approval processes become bottlenecks that absorb individual productivity improvements before they translate to business outcomes.

Use engineering intelligence platforms to correlate AI usage with delivery metrics, quality signals, and developer experience indicators. This comprehensive measurement approach provides actionable insights that surface problems before they compound.

ai-coding-tool-impact

Understanding AI Coding Tool Impact: Boosting Efficiency and Quality

Introduction

AI coding tool impact is now a central concern for software organizations, especially as we approach 2026. Engineering leaders and VPs of Engineering are under increasing pressure to not only adopt AI coding tools but also to measure, optimize, and de-risk their investments. Understanding the true impact of AI coding tools is critical for maintaining competitive advantage, controlling costs, and ensuring software quality in a rapidly evolving landscape.

The scope of this article is to provide a comprehensive guide for engineering leaders on how to measure, optimize, and de-risk the impact of AI coding tools within their organizations. We will synthesize public research, real-world metrics, and actionable measurement practices to help you answer: “Is Copilot, Cursor, or Claude Code actually helping us?” This guide is designed for decision-makers who need to justify AI investments, optimize developer productivity, and safeguard code quality as AI becomes ubiquitous in the software development lifecycle (SDLC).

AI coding tools are everywhere. The 2025 DORA report shows roughly 90% of developers now use them, with daily usage rates climbing from 18% in 2024 to 73% in 2026. GitHub Copilot alone generates 46% of all code written by developers. Yet most engineering leaders still can’t quantify ROI beyond license counts.

The central tension is stark. Some reports show “rocket ship” uplift—high-AI teams nearly doubling PRs per engineer. Meanwhile, controlled 2024–2025 studies reveal 10–20% slowdowns on real-world tasks. At Typo, an engineering intelligence platform processing 15M+ pull requests across 1,000+ teams, we focus on measuring actual behavioral change in the SDLC—cycle time, PR quality, DevEx—not just tool usage.

This article synthesizes public research, real-world metrics, and concrete measurement practices so you can answer: “Is Copilot, Cursor, or Claude Code actually helping us?” With data, building on a broader view of AI-assisted coding impact, metrics, and best practices.

“We thought AI would be a slam dunk. Six months in, our Jira data told a different story than our engineers’ enthusiasm.” — VP of Engineering, Series C SaaS

What We Mean by “AI Coding Tool Impact”

Impact must be defined in concrete engineering terms, not vendor marketing. For the purposes of this article, AI coding tool impact refers to the measurable effects—positive or negative—that AI-powered development tools have on software delivery, code quality, developer experience, and organizational efficiency.

Key Dimensions of AI Coding Tool Impact

  • Delivery speed: Cycle time from first commit to production, lead time for changes, PRs merged per engineer weekly, closely aligned with DORA software delivery performance metrics.
  • Code quality: Revert rates, incident-linked PRs, change failure rate (CFR), defect escape rate.
  • Deployment frequency: How often you ship to production.
  • Developer experience: Flow state, cognitive load, satisfaction, autonomy, supported by modern developer experience tools and practices.

Three layers matter:

  • Tool adoption: Seats activated, prompts per day.
  • Activity shift: PR size changes, testing habits, who writes code.
  • Outcome change: Faster releases, fewer incidents, happier developers.

AI-influenced PRs are pull requests that contain AI-generated code or are opened by AI agents. This concept is more meaningful than license utilization, as it directly ties AI tool adoption to tangible changes in the SDLC. The relationship between AI tool adoption, code review practices, and code quality is critical: AI lowers the barrier to entry for less-experienced developers, but the developer’s role is shifting from writing code to reviewing, validating, and debugging AI-generated code. Teams with strong code review processes see quality improvements, while those without may experience a decline in quality.

Specific tools—GitHub Copilot, Cursor, Claude Code, Amazon Q—manifest differently across GitHub, GitLab, and Bitbucket workflows through code suggestions, AI-generated PR descriptions, and chat-driven refactors.

The concept of “AI-influenced PRs” (PRs containing AI generated code or opened by AI agents) matters more than license utilization. This ties directly to DORA’s 2024 evolution with its five key metrics, including deployment rework rate.

With this foundation, we can now explore what the data really says about the measurable impacts of AI coding tools.

What the Data Really Says: Conflicting Studies and How to Reconcile Them

AI coding tools promise measurable benefits, including faster development cycles, reduced time spent on repetitive tasks, and increased developer productivity. However, the data presents a nuanced picture.

The “rocket ship” findings are compelling: organizations with 75–100% AI adoption see engineers merging ~2.2 PRs weekly versus ~1.2 at low-adoption firms. Revert rates nudge only slightly from ~0.61% to ~0.65%.

But here’s the counterweight: a controlled 2024–2025 study with 16 experienced open-source maintainers working on 246 real issues using Cursor and Claude 3.5/3.7 Sonnet took 19% longer than those without AI—despite expecting a 24% speedup.

The perception gap is critical. Developers reported ~20% perceived speedup even when measured slowdown appeared. This matters enormously for budget decisions and vendor claims.

Main Measurable Impacts of AI Coding Tools

  • Faster development cycles: Cycle time can be reduced by several hours due to faster coding and debugging with AI tools.
  • Reduced time on repetitive tasks: AI tools automate boilerplate, test generation, and documentation, freeing developers for higher-value work.
  • Increased developer productivity: Developers complete tasks 20% to 55% faster; feature delivery time has dropped from 9.5 hours to 5.8 hours in some cases.
  • Higher feature throughput: Organizations report delivering 2.3x more features per quarter compared to 2023.
  • Increased PR volume: Companies with the highest levels of AI adoption merged an average of 2.2 pull requests per engineer per week, nearly double the 1.12 weekly pull requests at low-adoption companies.
  • Lower development costs: Total development costs have decreased by an average of 32% due to faster prototyping and automated bug remediation.
  • Mainstream adoption: By 2025, over 80% of professional developers will use AI daily; 64% of companies are now generating a majority of their code with AI assistance.
  • ROI measurement: Tracking adoption rates, code acceptance rates, and active user engagement helps organizations measure the tangible impact of AI coding tools and justify investment.

When AI Tends to Help

  • Unfamiliar codebase navigation
  • Boilerplate code generation
  • Test generation
  • Documentation updates

When AI Tends to Hurt

  • Complex refactoring of existing code
  • Ambiguous requirements
  • Security-sensitive changes
  • Edge cases requiring deep domain knowledge

The methodological differences explain the conflict: benchmarks versus messy real issues, short-term experiments versus months of practice, individual tasks versus team-level throughput.

Transition: Understanding these measurable impacts and their limitations sets the stage for building a robust measurement framework. Next, we’ll break down the four key dimensions you must track to quantify AI coding tool impact in your organization.

The Four Dimensions of AI Coding Tool Impact You Must Track

Most companies over-index on seat usage and lines generated while under-measuring downstream effects. A proper framework covers four dimensions: Delivery Speed, Code Quality & Risk, Developer Experience, and Cost & Efficiency, ideally powered by AI-driven engineering intelligence for productivity.

Delivery Speed and Throughput

Track these concrete metrics:

  • Cycle time from first commit to production
  • PR time-to-merge
  • PRs merged per engineer weekly
  • Lead time for changes (DORA)

Real example: A mid-market SaaS team’s average PR cycle time dropped from 3.6 days to 2.5 days after rolling out Copilot paired with Typo’s automated AI code review across 40 engineers.

AI affects specific stages differently:

  • Coding time often shrinks
  • Review waiting time can grow if human reviewers distrust AI code
  • Rework time can expand if AI-generated changes are noisy

Segment PRs by “AI-influenced” versus “non-AI” to isolate whether speed gains come from AI-assisted work or process changes.

Code Quality, Stability, and Technical Debt

Measurable indicators include:

  • Revert/rollback rate
  • Incident-linked PRs
  • Change failure rate
  • Test coverage trends
  • Critical bug density in AI-influenced modules

Research shows 48% of AI generated code harbors potential security vulnerabilities. Leaders care less about minor revert bumps than spikes in high-severity incidents or prolonged remediation times.

AI tools can improve quality (faster test generation, consistent patterns) and worsen it (subtle logic bugs, hidden security issues, copy-pasted vulnerabilities). Automated AI in the code review process with PR health scores catches risky patterns before production.

Sidebar: Main Risks and Governance Needs of AI-Generated Code

AI-generated code can introduce significant risks, including security vulnerabilities (e.g., 48% of AI-generated code harbors potential security vulnerabilities, and approximately 29% of AI-generated Python code contains potential weaknesses). The role of the developer is shifting from writing code to reviewing, validating, and debugging AI-generated code—akin to reviewing a junior developer’s pull request. Blindly accepting AI suggestions can lead to rapid accumulation of technical debt and decreased code quality.

To manage these risks, organizations must:

  • Implement governance frameworks and clear usage guidelines specifying appropriate use cases for AI coding tools.
  • Require mandatory code reviews for AI-generated snippets to ensure quality and functionality.
  • Conduct regular security audits of AI-generated code to identify vulnerabilities and data leakage patterns.
  • Invest in comprehensive training for developers to maximize the benefits of AI code generation tools.
  • Establish clear policies about what information can be shared with AI services to ensure data privacy and security.

Transition: With code quality and risk addressed, the next dimension to consider is how AI coding tools affect developer experience and team behavior.

Developer Experience and Team Behavior

Impact isn’t only about speed. AI coding tools change how developers working on code feel—flow state, cognitive load, satisfaction, perceived autonomy.

Gartner’s 2025 research found organizations with strong DevEx are 31% more likely to improve delivery flow. Combine anonymous AI-chatbot surveys with behavioral data (time in review queues, context switching, after-hours work) to surface whether AI reduces friction or adds confusion, as explored in depth in developer productivity in the age of AI.

Sample survey questions:

  • “When using Copilot/Cursor, do you feel more or less confident in the code you ship?”
  • “Does AI help or hurt your ability to stay informed and in flow?”

Measurement must not rely on surveillance or keystroke tracking.

Transition: After understanding the impact on developer experience, it’s essential to evaluate the cost and ROI of AI coding tools to ensure sustainable investment.

Cost, Licenses, and ROI

The full cost picture includes:

  • License fees for Copilot/Cursor/Claude Code
  • Indirect costs (longer code reviews, extra testing)
  • Opportunity costs (engineers learning tools versus shipping features)

Naive ROI views based on 28-day retention or acceptance rates mislead without tying to DORA metrics. A proper ROI model maps license cost per seat to actual AI-influenced PRs, quantifies saved engineer-hours from reduced cycle time, and factors in avoided incidents using rework rate and CFR.

Example scenario: A 200-engineer org comparing $300k/year in AI tool spend against 15% cycle time reduction and 30% fewer stuck PRs can calculate a clear payback period.

Transition: With these four dimensions in mind, let’s move on to how you can systematically measure and optimize AI coding tool impact in your organization.

How to Build an AI Coding Tool Impact Measurement Program

Use existing workflows (GitHub/GitLab/Bitbucket, Jira/Linear, CI/CD) and an engineering intelligence platform rather than one-off spreadsheets. Measurement must cover near-term experiments (first 90 days) and long-term trends (12+ months) to capture learning curves and model upgrades.

Step 1: Establish a Pre-AI Baseline

  1. Capture 4–8 weeks of data before rollout: PRs per engineer, cycle time, deployment frequency, change failure rate, MTTR, DevEx survey scores.
  2. Seamless integration with Git and Jira automates baseline capture without manual reporting.
  3. Normalize by team and repo to avoid confounding factors.

Step 2: Map Where AI Will Be Used in the SDLC

  1. Prioritize high-ROI use cases: boilerplate generation, test creation, multi file editing, documentation.
  2. Gate riskier areas: security-sensitive modules, compliance-heavy domains.
  3. Create an internal “AI usage playbook” with governance and review expectations.

Step 3: Roll Out AI Tools in Controlled Cohorts

  1. Stage rollout with pilot teams for 60–90 days instead of flipping the switch.
  2. Define comparison cohorts and avoid contamination.
  3. Establish training sessions for advanced prompting and refactor flows.
  4. Communicate that the goal is learning, not surveillance.

Step 4: Instrument AI-Influenced Work in Your Data

  1. Use practical tagging: PR labels like “ai-assisted,” commit message prefixes, or automated inference.
  2. Automatically classify AI-influenced PRs to show separate dashboards with PR size, review depth, and defect rates.
  3. Don’t rely solely on vendor dashboards that only expose usage without linking to SDLC outcomes.

Step 5: Analyze Impact on Delivery, Quality, and DevEx

  1. After 60–90 days, compare AI pilot versus control teams on cycle time, rework rate, incident-linked PRs, security findings, and DevEx survey responses.
  2. Run sliced analysis by language, repo, and team size.
  3. Build a concise internal “AI impact report” with 3–4 key metrics for leadership.

Step 6: Iterate, Expand, or Roll Back Based on Evidence

  1. Strong positive impact → scale AI access and training
  2. Mixed impact → tune governance before scaling
  3. Negative impact → pause rollout, narrow use cases
  4. Set quarterly checkpoints to reassess as models improve and practices evolve.

Transition: With a measurement program in place, it’s crucial to address governance, code review, and safety nets to manage the risks of AI-generated code.

Governance, Code Review, and Safety Nets for AI-Generated Code

Higher throughput without governance accelerates technical debt and incident risk.

Set Explicit AI Usage and Quality Policies

Define where AI is mandatory, allowed, or prohibited by code area. Policies should cover attribution, documentation standards, and manual validation expectations. Align with compliance and legal requirements for data privacy. Enterprise teams need clear boundaries for features like background agents and autonomous agents.

Modernize Code Review for AI-Generated Changes

Traditional line-by-line review doesn’t scale when AI generates 300-line diffs in seconds. Modern approaches use AI-powered code review tools, LLM-powered review comments, PR health scores, security checks, and auto-suggested fixes. Adopt PR size limits and enforce test requirements. One customer reduced review time by ~30% while cutting critical quality assurance issues by ~40%.

Protect Data Privacy and Security When Using External AI

Real risks include leaking proprietary code in prompts and reintroducing known CVEs. Technical controls: proxy AI traffic through approved gateways, redact secrets before sending prompts, use self hosted or enterprise plans with stronger access controls. Surface suspicious patterns like repeated changes to security-sensitive files.

Transition: Once governance and safety nets are established, organizations can move from basic usage dashboards to true engineering intelligence.

From Usage Dashboards to Engineering Intelligence

GitHub’s Copilot metrics (28-day retention, suggestion acceptance, usage by language) answer “Who is using Copilot?” They don’t answer “Are we shipping better software faster and safer?”

Example: A company built a Grafana-based Copilot dashboard but couldn’t explain flat cycle time to the CFO. After implementing proper engineering intelligence, they discovered review time had ballooned on AI-influenced PRs—and fixed it with new review rules.

Key Metrics Beyond AI Usage

Beyond vendor dashboards, trend these signals:

  • PR size distribution for AI versus non-AI PRs
  • Time in code review queues
  • Rework and deployment rework rate
  • Flow efficiency (active versus waiting time)
  • Developer-reported friction from DevEx surveys

Summary Table: Main Measurable Impacts of AI Coding Tools

Impact Area Measurable Benefit
Development Cycle Speed Cycle time reduced by several hours; 20–55% faster task completion
Feature Throughput 2.3x more features delivered per quarter; 2.2 PRs/engineer/week at high adoption
Cost Reduction 32% decrease in total development costs
Developer Productivity Feature delivery time dropped from 9.5 to 5.8 hours; increased PR volume
Adoption Rate 80%+ of developers use AI daily by 2025; 64% of companies generate majority of code with AI
Code Quality Quality improvements with strong review; risk of vulnerabilities without governance
ROI Measurement Track adoption, code acceptance, and engagement for tangible impact

Benchmark against similar-sized engineering teams to see whether AI helps you beat the market or just keep pace.

Transition: To maximize sustainable performance, connect AI coding tool impact to DORA metrics and broader business outcomes.

AI Coding Tools, DORA Metrics, and Sustainable Performance

Connect AI impact to DORA’s common language: deployment frequency, lead time, change failure rate, MTTR, deployment rework rate, using resources like a practical DORA metrics guide for AI-era teams.

AI can move each metric positively (faster implementation, more frequent releases) or negatively (rushed risky changes, slower incident diagnosis). The 2024–2025 DORA findings show AI adoption is strongest in organizations with solid existing practices—platform engineering is the #1 enabler of AI gains.

Data driven insights that tie AI adoption to DORA profile changes reveal whether you’re improving or generating noise. Concrete customer results: 30% reduction in PR time-to-merge, 20% more deployments.

Transition: With all these elements in place, let’s summarize a pragmatic playbook for engineering leaders to maximize AI coding tool impact.

Putting It All Together: A Pragmatic Playbook for VPs of Engineering

AI coding tools like GitHub Copilot, Cursor, and Claude Code can be a rocket ship—but only with measured impact across delivery, quality, and DevEx, paired with strong governance and automated review.

Your checklist:

  • Baseline your key metrics before rollout
  • Roll out AI in controlled cohorts with clear hypotheses
  • Tag AI-influenced work systematically
  • Monitor DORA + AI impact through unified analytics
  • Modernize code review for AI-generated changes
  • Set explicit policies (solo developers through enterprise adoption)
  • Invest in developer training beyond the free tier or free hobby plan
  • Understand cursor pricing and pro plan versus paid plan tradeoffs
  • Reassess quarterly—don’t assume early results hold forever
  • Create value by connecting AI impact to business outcomes

Whether you’re evaluating cursor fits for your team, considering multi model access capabilities, or scaling enterprise AI assistance, the principle holds: measure before you scale.

Typo connects in 60 seconds to your existing systems. Start a free trial or book a demo to see your AI coding tool impact quantified—not estimated.

AI code reviewers

The Best AI Code Review Tools to Improve Your Development Workflow

Code review agent adoption jumped from 14.8% to 51.4% of engineering teams between January and October 2025. That’s not a trend—it’s a tipping point. By early 2026, the question isn’t whether to use AI code review tools, but which one fits your stack, your security posture, and your ability to measure impact.

This guide is intended for engineering leaders, developers, and DevOps professionals evaluating AI code review solutions for their teams. With the rapid adoption of AI in software development, choosing the right code review tool is critical for maintaining code quality, security, and team productivity.

This guide covers the leading AI code review tools in 2026, the real trade-offs between them, and how to prove they’re actually working for your team.

Quick Answer: The Best AI Code Review Tools in 2026

If you need a fast answer, here’s the breakdown by use case.

For GitHub-native teams wanting minimal friction, GitHub Copilot Code Review delivers inline comments and PR summaries without additional setup. For fast, conversational review across GitHub, GitLab, and Bitbucket, CodeRabbit remains the most widely adopted bot with over 13 million pull requests processed across 2 million repositories. Teams running trunk-based development (a workflow where all developers work on a single branch, promoting frequent integration) with high PR velocity should look at Graphite Agent, optimized for stacked diffs and dependency chains.

For system-aware review that indexes entire repositories and reasons across services, Greptile and BugBot stand out—though they come with more compute overhead. Security-first teams should layer in CodeQL (GitHub Advanced Security) or Snyk Code for deep vulnerability analysis. And if you need AI code review combined with PR analytics, DORA metrics (lead time, deployment frequency, change failure rate, mean time to recovery—key software delivery performance indicators), and AI impact measurement in one platform, Typo is built exactly for that.

Here’s the quick mapping:

  • GitHub Copilot Code Review → Best for GitHub teams wanting native AI comments and summaries with zero setup.
  • CodeRabbit → Best for fast, conversational PR review across multiple programming languages and hosts.
  • Graphite Agent → Best for high-volume PR flows and trunk-based development workflows.
  • Greptile / BugBot → Best for repo-wide, system-aware AI review that catches architectural issues.
  • Typo → Best if you want AI review + PR analytics + AI impact measurement in one platform.
  • CodeQL / Snyk Code → Best for deep security analysis and OWASP Top 10 coverage in PRs.

One critical data point to keep in mind: only 46% of developers fully trust AI-generated code according to the Stack Overflow 2025 survey. This trust gap means AI code review tools work best as force multipliers for human judgment, not replacements. The right tool depends on your repo host, security posture, language stack, and whether your leadership needs verified impact measurement to justify the investment.

What Are AI Code Review Tools?

AI code review tools are systems that analyze pull requests (PRs, which are proposed code changes submitted for review before merging into the main codebase) and code changes using large language models, static code analysis (automated code checking based on predefined rules), and sometimes semantic graphing to catch issues before human review. They’ve evolved from simple linters into sophisticated review agents that can reason about intent, context, and cross-file dependencies.

Most tools integrate directly with GitHub, GitLab, or Bitbucket. They run on each commit or PR update, leaving inline comments, PR summaries, and sometimes suggested patches. The focus is typically on bugs, security vulnerabilities, style violations, and maintainability concerns—surfacing problems before they consume human reviewers’ time.

The key difference from classic static analysis is the shift from deterministic to probabilistic reasoning:

  • Static analysis (SonarQube, Semgrep) → Rule-based, deterministic, excellent for consistent enforcement of coding standards and OWASP patterns.
  • AI / LLM review → Probabilistic, contextual, capable of understanding developer intent and providing instant feedback that explains why something is problematic.

The 2025–2026 shift has been from diff-only, file-level comments to system-aware review. Tools like Greptile, BugBot, and Typo now index entire repositories—sometimes hundreds of thousands of files—to reason about cross-service changes, API contract violations, and architectural regressions. This matters because a change in one file might break behavior in another service entirely, and traditional diff-level analysis would miss it.

The augmentation stance is essential: AI reduces review toil and surfaces risk, but human reviewers remain critical for complex business logic, architecture decisions, and production readiness judgment, as emphasized in broader discussions of the use of AI in the code review process.

Why Engineering Teams Are Adopting AI Code Review (and Where It Goes Wrong)

Release cycles are shrinking. AI-generated code volume is exploding. Teams using AI coding assistants like GitHub Copilot ship 98% more PRs—but face 91% longer review times as the bottleneck shifts from writing code to validating it. DORA metrics (lead time, deployment frequency, change failure rate, mean time to recovery—key software delivery performance indicators) are under board-level scrutiny, and engineering leaders need ways to maintain quality standards without burning out senior reviewers.

Benefits Driving Adoption

  • Reduced PR cycle time: Teams report 40-60% drops in review time per PR with comprehensive code review capabilities from AI tools.
  • Consistent enforcement: AI doesn’t get tired, doesn’t skip checks on Friday afternoons, and applies the same quality gates across all contributors.
  • Better support for juniors: Explanatory feedback from AI review tools accelerates knowledge transfer and helps less experienced developers learn coding standards in context.
  • Keeping up with AI-generated code: Human reviewers can’t manually review every line when code generation volume triples; automated AI code review handles the initial triage.

Common Failure Modes

Teams fail with AI code review tools in three predictable ways:

Over-reliance without human oversight. Accepting every AI suggestion without human review leads to subtle logic bugs, authentication edge cases, and security issues slipping through. AI catches obvious problems; humans catch the non-obvious ones.

Misaligned workflows. Bots spam comments, reviewers ignore them, and no one owns the AI feedback. This creates noise rather than signal, and review quality actually decreases as teams learn to dismiss automated reviews entirely.

No measurement. Teams install tools but never track effects on PR flow, rework rate, or post-merge incidents. Without data, you can’t prove ROI—and you can’t identify when a tool is creating more problems than it solves.

The core truth: AI review amplifies existing practices. Strong code review processes + AI = faster, safer merges when grounded in proven best practices for code review. Weak or chaotic review culture + AI = more noise, longer queues, and frustrated developers.

How We Evaluated AI Code Review Tools for 2026

This guide focuses on real-world PR workflows, not feature checklists. The target audience is modern SaaS teams on GitHub, GitLab, or Bitbucket who need to balance code review efficiency with security, maintainability, and the ability to prove impact.

Evaluation Criteria Overview

  • Accuracy and signal-to-noise ratio: How many comments are actually useful? How often does the tool hallucinate or miss critical issues? High false positives kill adoption.
  • Context depth: File-level vs. repository-wide vs. cross-service analysis. Does the tool understand the broader context of changes?
  • Security capabilities: OWASP Top 10 coverage, secret detection, dataflow analysis, and integration with existing AppSec tools.
  • Developer experience: Review speed, comment quality, configurability, and overall “spamminess” in development workflows.
  • Scalability: Performance on large and complex codebases, monorepos, and multi-repo architectures.
  • Deployment model and privacy: SaaS vs. self-hosted vs. air-gapped options and data retention policies.
  • Measurable impact: Does the tool surface metrics like PR cycle time, rework rate, and defect trends? This is Typo’s key differentiator.

Tools were compared using real pull requests across TypeScript, Java, Python, and Go, with live GitHub and GitLab repositories running active CI/CD pipelines. We drew from benchmarks published in late 2025 and early 2026.

The article separates general-purpose PR review agents, security-first tools, and engineering intelligence platforms that combine dedicated code review with analytics.

Top 10 AI Code Review Tools in 2026

This section profiles 10 notable review tools, grouped by use case: GitHub-native, agent-based PR bots, system-aware reviewers, and platforms that mix AI with metrics. Each tool profile starts with an H3 subheading, followed by clearly labeled sub-sections for 'Strengths,' 'Limitations,' and 'Pricing.'

GitHub Copilot Code Review

Strengths:

  • Runs automatically on pull requests for supported plans, analyzing diffs with context from commit history.
  • Produces natural-language summaries of large PRs, reducing time to understand code changes.
  • Offers suggestions for refactors, missing tests, and potential bugs across multiple programming languages.
  • Minimal initial setup for GitHub-hosted repos; uses existing workflows without additional configuration.

Limitations:

  • GitHub-only; no GitLab or Bitbucket support.
  • Limited compared to specialized tools for architectural and multi-repo awareness.
  • Security depth often requires pairing with CodeQL or external scanners for comprehensive security analysis.

Pricing: Included in Copilot Business (~$19/user/month) and Enterprise (~$39/user/month) tiers. Details change frequently; check GitHub’s current pricing.

CodeRabbit

Strengths:

  • Leaves human-like comments directly in PRs, explaining reasoning and linking to best practices.
  • Learns project conventions over time through “Learnings” to reduce false positives and tailor feedback.
  • Supports JavaScript/TypeScript, Python, Java, Go, and popular frameworks like React and Django.
  • Offers “ask follow-up” workflows where developers can query the bot inside the PR thread for contextual analysis.

Limitations:

  • Primarily diff-level context; repository-wide reasoning is improving but limited compared to system-aware engines.
  • No first-class built-in analytics on DORA metrics or AI impact; requires external tools for impact measurement.

Pricing: Free tier available (rate-limited). Pro plans around $24/dev/month annually. Enterprise pricing custom for large teams.

Graphite AI Agent

Strengths:

  • Optimized for teams merging dozens or hundreds of PRs per day with support for stacked PRs.
  • AI agent reviews multiple related branches with awareness of dependency chains.
  • Strong fit for TypeScript/React, backend services, and monorepo patterns in modern SaaS teams.

Limitations:

  • Best for teams already standardizing on Graphite for PR management; less attractive as a standalone reviewer.
  • GitHub-focused; limited or no support for GitLab/Bitbucket as of early 2026.

Pricing: AI features included in paid plans (~$40/user/month). Usage-based or seat-based pricing; check current rates.

Greptile

Strengths:

  • Builds a semantic index over thousands of files, enabling developers to trace behavior across modules and services.
  • Better at catching architectural regressions, broken contracts, and inconsistent API usage than simple diff bots.
  • Can answer “why” questions in PRs by referencing commit history and related files.

Limitations:

  • Indexing large monorepos can be resource-intensive with initial latency during setup.
  • SaaS-first deployment; self-hosted or air-gapped options limited compared to enterprise-only offerings.

Pricing: Typically usage-based (per repo or per seat) around $30/user/month. Startup and enterprise tiers available.

BugBot

Strengths:

  • Emphasizes execution reasoning and test impact, not just style or simple code smells.
  • Can propose test cases and highlight untested branches affected by a PR.
  • Works well for backend-heavy stacks (Java, Go, Node.js) and API-driven services.

Limitations:

  • Less mature ecosystem and integrations than established players like GitHub or Snyk.
  • May require tuning to avoid over-commenting on minor style changes.

Pricing: Per-seat plans for small teams; volume pricing for enterprises. Representative range in the high tens of dollars per dev/month.

CodeQL (GitHub Advanced Security)

Strengths:

  • Deep variant analysis across large repositories, excellent for OWASP Top 10 and custom rules.
  • Tight integration with GitHub pull requests: alerts show directly in PRs with precise traces.
  • Strong ecosystem of community and vendor-maintained queries; supports Java, JavaScript/TypeScript, C/C++, C#, Go, and Python.

Limitations:

  • Requires GitHub Advanced Security for private repos, which can be expensive for enterprise teams.
  • Focused on security review and specific quality aspects; not a conversational or LLM-style reviewer.

Pricing: GitHub Advanced Security pricing generally ~$30+/user/month per active committer. Public repos can use CodeQL for free.

Snyk Code (DeepCode Engine)

Strengths:

  • Combines ML and symbolic reasoning over millions of code samples to detect security flaws.
  • Integrates with IDEs, GitHub/GitLab/Bitbucket, and CI pipelines, surfacing issues before merge.
  • Offers remediation guidance and learning content tailored to modern stacks (Node, Java, .NET).

Limitations:

  • Security-centric; not optimized for general readability or design review.
  • Full capabilities locked behind Snyk’s paid plans, potentially overkill if you only need AI review.

Pricing: Free tier available. Paid plans start around $1,260/year per developer, with organization-level packages for larger teams.

Sourcegraph Cody

Strengths:

  • Uses Sourcegraph’s search and graph to give LLMs rich, global context: ideal for large monorepos and multi-repo architectures.
  • Can run review agents that identify risky changes across microservices and shared libraries.
  • Strong enterprise features: SSO, audit logs, granular permissions, and on-prem options.

Limitations:

  • Best suited to organizations already invested in Sourcegraph; heavier-weight than simple GitHub Apps.
  • Higher price point than lightweight review bots; targeted at mid-market and enterprise teams.

Pricing: Enterprise pricing often starts around $49/user/month for Cody. Volume discounts and platform bundles available; confirm with Sourcegraph.

Self-Hosted and Privacy-First Tools (PR-Agent, Tabby, Tabnine)

Strengths:

  • Complete control over models and infrastructure; can run entirely in your own VPC or data center.
  • No external API calls if configured with local models, satisfying strict compliance requirements.
  • Ability to tailor models and prompts to organization-specific coding standards.

Limitations:

  • Significant DevOps overhead: GPU provisioning, scaling, updates, and observability.
  • Configuration complexity and longer rollout timelines (often 6–12 weeks or more).
  • Typically weaker analytics and workflow insights compared to commercial SaaS platforms.

Pricing: Software may be free or open source, but total cost of ownership spans $100K–$500K+ over 12–18 months for 50–200 developers once hardware and staffing are factored in.

Typo: AI Code Review Plus Engineering Intelligence

AI Code Review Strengths:

  • LLM-powered PR review that blends static analysis with reasoning-based feedback, catching logic issues, security issues, and style problems in context of the whole repo.
  • PR health scores and merge confidence indicators based on signals like diff risk, reviewer load, test coverage, and historical defect patterns.
  • Automated checks for security smells and risky patterns, with fix suggestions where safe.
  • Analyzes code across multiple programming languages with support for human written code and AI generated code equally.

Analytics and Impact Capabilities:

  • Tracks how AI review changes PR cycle time, time to first review, rework rate, and change failure rate over time.
  • Measures adoption and impact of AI coding assistants like GitHub Copilot, Cursor, and Claude code using real PR data—not just license counts.
  • Connects AI review events to DORA metrics and deployment behavior in CI/CD, enabling developers and leaders to see real impact.
  • Surfaces actionable insights on technical debt, long term code health, and review quality trends.

Integrations and Deployment:

  • First-class integrations with GitHub, GitLab, and Bitbucket plus Jira/Linear and CI tools like GitHub Actions, Jenkins, and CircleCI.
  • Self-serve setup that connects in about 60 seconds via OAuth and starts analyzing historical PRs immediately.
  • Slack integration for surfacing risky PRs, stuck reviews, and AI feedback summaries to engineering teams.

Proof Points:

  • Groundworks achieved a 40% reduction in critical code quality issues after implementing Typo.
  • Over 15M+ PRs processed across 1,000+ engineering teams globally.
  • Customers like Prendio and Requestly report significant improvements in deployments and PR throughput.

Ideal Fit: VPs and Directors of Engineering who need both automated code review and trustworthy metrics to justify AI investments and improve developer experience.

Pricing: Free trial available with transparent per-seat pricing. More affordable scaling than legacy engineering analytics tools, with details outlined in Typo’s plans and pricing. Visit typoapp.io for current plans.

Key Trade-Offs: Static Analysis vs LLM Review vs System-Aware Engines

Modern stacks increasingly combine three layers: static analyzers, LLM-based PR bots, and system-aware engines. Understanding the trade-offs helps you build the right stack without redundancy or gaps.

Approach Characteristics Pros Cons
Static Analysis Deterministic, rule-based tools (e.g., SonarQube, Semgrep, CodeQL). Applies automated code checking based on predefined rules. Predictable outputs, low false negatives on known patterns, consistent enforcement. Blind to developer intent and cross-service workflows; can’t understand why code exists.
LLM Review Uses large language models for contextual, natural-language feedback and suggestions. Strong for mentoring, can identify missing tests, suggest refactors, explain reasoning. Prone to hallucinations, variable review quality, context limits.
System-Aware Review Indexes large codebases to understand service boundaries, schemas, and shared libraries. Catches architectural drift, breaking changes across microservices, API contract issues. Compute-intensive, initial latency, may be overkill for smaller repos.

Layered Approach for High-Performing Teams

High-performing teams layer these approaches rather than choosing one:

  1. Static analysis as non-negotiable gates: Catch security vulnerabilities, style violations, and known anti-patterns automatically.
  2. LLM review for reasoning and coaching: Provide explanatory feedback that accelerates knowledge transfer and catches human-readable issues.
  3. System-aware or intelligence platforms (like Typo): Connect review behavior to delivery metrics, improving code quality and tracking long term code health across the development process.

This combination addresses manual review time constraints while maintaining maintainable code standards across the software development lifecycle, especially when enhanced with AI-powered PR summaries and review time estimates.

How to Measure the Impact of AI Code Review Tools

Installing a bot is easy. Proving ROI to a CTO or CFO requires linking AI review activity to delivery outcomes. Too many teams treat AI tools as “set and forget” without tracking whether they’re actually improving code review processes or just adding noise.

Core Metrics to Track

  • PR cycle time: Time from PR open to merge, and time to first review. Track whether automated reviews reduce manual review time.
  • Rework rate: Follow-up PRs or commits fixing issues introduced by recent changes. AI should reduce rework, not create it.
  • Change failure rate: Post-merge incidents tied to changes that passed AI review. This is a critical DORA metric.
  • Review depth: Comments per PR and meaningful changes before merge—without overloading developers with false positives.

Connecting Tool Signals to Outcomes

The measurement approach matters as much as the metrics:

  • Compare metrics for 4–8 weeks pre-adoption vs. 4–8 weeks post-adoption for the same teams on similar work.
  • Run A/B style rollout: some squads with AI review enabled, others as control. This isolates the tool’s effect from other process changes.
  • Correlate AI feedback volume and acceptance rates with reduction in escaped defects.

Why Typo Automates This

Typo ingests PR data, AI review events, CI outcomes, and incident data to automatically surface whether AI review is improving or just adding noise. Dashboards help engineering leadership share impact with finance and executives using verified data rather than estimates.

One warning: usage metrics alone (number of suggestions, comments generated) are vanity metrics. They don’t matter unless they map to faster, safer delivery. Track outcomes, not activity.

Choosing the Right AI Code Review Tool for Your Team

Tool choice starts from your constraints and goals: repo host, security needs, stack complexity, and desired analytics depth. There’s no universal “best” tool—only the best fit for your specific development workflows.

Key Decision Dimensions

Dimension Questions to answer
Hosting and data GitHub vs GitLab vs Bitbucket? SaaS acceptable or need self-hosted/air-gapped?
Primary goal Speed (cycle time)? Security (OWASP, compliance)? Maintainability? Measurement?
Team size and budget 5–20 devs can start with SaaS bots; 50–200+ devs must consider TCO and integration overhead.
Architecture Small repo vs large monorepo vs microservices? System-aware review becomes critical at scale.
Multiple reviewers Do you need AI to supplement human reviewers or replace initial triage entirely?

Example Playbooks

Run Short, Data-Driven Pilots

Pilots should be 4–6 weeks on representative repos with clear success criteria:

  • 20–30% reduction in PR cycle time without increased incident rate.
  • Measurable reduction in manual review time for human reviewers.
  • Developer feedback on comment quality and relevance (avoiding tool fatigue).

Be willing to iterate or switch tools based on evidence, not marketing claims. The development process improves when decisions are grounded in real pull requests data.

Start Measuring Today

If you’re evaluating AI code review options and need to prove impact, connect your GitHub, GitLab, or Bitbucket repos to Typo in under a minute. Run a limited-scope pilot and see if AI review plus analytics improves your DORA metrics and PR health. Typo is already used by 1,000+ teams and has processed over 15M PRs—giving it robust benchmarks for what “good” looks like.

The best AI code review tool is the one that proves its impact on your delivery metrics. Start measuring, and let the data guide your decision.

Generative AI for Engineering

Generative AI for Engineering

Introduction

Generative AI for engineering represents a fundamental shift in how engineers approach code development, system design, and technical problem-solving. Unlike traditional automation tools that follow predefined rules, generative AI tools leverage large language models to create original code snippets, design solutions, and technical documentation from natural language prompts. This technology is transforming software development and engineering workflows across disciplines, enabling teams to generate code, automate repetitive tasks, and accelerate delivery cycles at unprecedented scale.

Key features such as AI assistant and AI chat are now central to these tools, helping automate and streamline coding and problem-solving tasks. AI assistants can improve productivity by offering modular code solutions, while AI chat enables conversational, inline assistance for debugging, code refactoring, and interactive query resolution.

This guide covers generative AI applications across software engineering, mechanical design, electrical systems, civil engineering, and cross-disciplinary implementations. The content is designed for engineering leaders, development teams, and technical professionals seeking to understand how AI coding tools integrate with existing workflows and improve developer productivity. Many AI coding assistants integrate with popular IDEs to streamline the development process. Whether you’re evaluating your first AI coding assistant or scaling enterprise-wide adoption, this resource provides practical frameworks for implementation and measurement.

What is generative AI for engineering?

It encompasses AI systems that create functional code, designs, documentation, and engineering solutions from natural language prompts and technical requirements—serving as a collaborative partner that handles execution while engineers focus on strategic direction and complex problem-solving. AI coding assistants can be beneficial for both experienced developers and those new to programming.

By the end of this guide, you will understand:

  • How generative AI enhances productivity across engineering disciplines
  • Methods for improving code quality through AI-powered code suggestions and reviews
  • Strategies for automating technical documentation and knowledge management
  • Approaches for accelerating design cycles and reducing engineering bottlenecks
  • Implementation frameworks for integrating AI tools with existing engineering workflows

Generative AI can boost coding productivity by up to 55%, and developers can complete tasks up to twice as fast with generative AI assistance.

Understanding Generative AI in Engineering Context

Generative AI refers to artificial intelligence systems that create new content—code, designs, text, or other outputs—based on patterns learned from training data. Generative AI models are built using machine learning techniques and are often trained on publicly available code, enabling them to generate relevant and efficient code snippets. For engineering teams, this means AI models that understand programming languages, engineering principles, and technical documentation well enough to generate accurate code suggestions, complete functions, and solve complex programming tasks through natural language interaction.

The distinction from traditional engineering automation is significant. Conventional tools execute predefined scripts or follow rule-based logic. Generative AI tools interpret context, understand intent, and produce original solutions. Most AI coding tools support many programming languages, making them versatile for different engineering teams. When you describe a problem in plain English, these AI systems generate code based on that description, adapting to your project context and coding patterns.

Artificial Intelligence and Generative AI: Key Differences and Relationships

Artificial intelligence (AI) is a broad field dedicated to building systems that can perform tasks typically requiring human intelligence, such as learning, reasoning, and decision-making. Within this expansive domain, generative AI stands out as a specialized subset focused on creating new content—whether that’s text, images, or, crucially for engineers, code.

Generative AI tools leverage advanced machine learning techniques and large language models to generate code snippets, automate code refactoring, and enhance code quality based on natural language prompts or technical requirements. While traditional AI might classify data or make predictions, generative AI goes a step further by producing original outputs that can be directly integrated into the software development process.

In practical terms, this means that generative AI can generate code, suggest improvements, and even automate documentation, all by understanding the context and intent behind a developer’s request. The relationship between AI and generative AI is thus one of hierarchy: generative AI is a powerful application of artificial intelligence, using the latest advances in large language models and machine learning to transform how engineers and developers approach code generation and software development.

Software Engineering Applications

In software development, generative AI applications have achieved immediate practical impact. AI coding tools now generate code, perform code refactoring, and provide intelligent suggestions directly within integrated development environments like Visual Studio Code. These tools help developers write code more efficiently by offering relevant suggestions and real-time feedback as they work. These capabilities extend across multiple programming languages, from Python code to JavaScript, Java, and beyond.

The integration with software development process tools creates compounding benefits. When generative AI connects with engineering analytics platforms, teams gain visibility into how AI-generated code affects delivery metrics, code quality, and technical debt accumulation. AI coding tools can also automate documentation generation, enhancing code maintainability and reducing manual effort. This connection between code generation and engineering intelligence enables data-driven decisions about AI tool adoption and optimization.

Modern AI coding assistant implementations go beyond simple code completion. They analyze pull requests, suggest bug fixes, identify security vulnerabilities, and recommend code optimization strategies. These assistants help with error detection and can analyze complex functions within code to improve quality and maintainability. Some AI coding assistants, such as Codex, can operate within secure, sandboxed environments without requiring internet access, which enhances safety and security for sensitive projects. Developers can use AI tools by following prompt-based workflows to generate code snippets in many programming languages, streamlining the process of writing and managing code. The shift is from manual coding process execution to AI-augmented development where engineers direct and refine rather than write every line.

AI coding tools can integrate with popular IDEs to streamline the development workflow, making it easier for teams to adopt and benefit from these technologies. Generative AI is transforming the process of developing software by automating and optimizing various stages of the software development lifecycle.

Design and Simulation Engineering

Beyond software, generative AI transforms how engineers approach CAD model generation, structural analysis, and product design. Rather than manually iterating through design variations, engineers can describe requirements in natural language and receive generated design alternatives that meet specified constraints.

This capability accelerates the design cycle significantly. Where traditional design workflows required engineers to manually model each iteration, AI systems now generate multiple viable options for human evaluation. The engineer’s role shifts toward defining requirements clearly, evaluating AI-generated options critically, and applying human expertise to select and refine optimal solutions.

Documentation and Knowledge Management

Technical documentation represents one of the highest-impact applications for generative AI in engineering. AI systems now generate specification documents, API documentation, and knowledge base articles from code analysis and natural language prompts. This automation addresses a persistent bottleneck—documentation that lags behind code development.

The knowledge extraction capabilities extend to existing codebases. AI tools analyze code to generate explanatory documentation, identify undocumented dependencies, and create onboarding materials for new team members. This represents a shift from documentation as afterthought to documentation as automated, continuously updated output.

These foundational capabilities—code generation, design automation, and documentation—provide the building blocks for discipline-specific applications across engineering domains.

Benefits of Generative AI in Engineering

Generative AI is rapidly transforming engineering by streamlining the software development process, boosting productivity, and elevating code quality. By integrating generative ai tools into their workflows, engineers can automate repetitive tasks such as code formatting, code optimization, and documentation, freeing up time for more complex and creative problem-solving.

One of the standout benefits is the ability to receive accurate code suggestions in real time, which not only accelerates development but also helps maintain high code quality standards. Generative AI tools can proactively detect security vulnerabilities and provide actionable feedback, reducing the risk of costly errors. As a result, teams can focus on innovation and strategic initiatives, while the AI handles routine aspects of the development process. This shift leads to more efficient, secure, and maintainable software, ultimately driving better outcomes for engineering organizations.

Increased Productivity and Efficiency

Generative AI dramatically enhances productivity and efficiency in software development by automating time-consuming tasks such as code completion, code refactoring, and bug fixes. AI coding assistants like GitHub Copilot and Tabnine deliver real-time code suggestions, allowing developers to write code faster and with fewer errors. These generative ai tools can also automate testing and validation, ensuring that code meets quality standards before it’s deployed.

By streamlining the coding process and reducing manual effort, generative AI enables developers to focus on higher-level design and problem-solving. The result is a more efficient development process, faster delivery cycles, and improved code quality across projects.

Enhanced Innovation and Creativity

Generative AI is not just about automation—it’s also a catalyst for innovation and creativity in software development. By generating new code snippets and suggesting alternative solutions to complex challenges, generative ai tools empower developers to explore fresh ideas and approaches they might not have considered otherwise.

These tools can also help developers experiment with new programming languages and frameworks, broadening their technical expertise and encouraging continuous learning. By providing a steady stream of creative input and relevant suggestions, generative AI fosters a culture of experimentation and growth, driving both individual and team innovation.

Generative AI Applications in DevOps

Building on these foundational capabilities, generative AI manifests differently across engineering specializations. Each discipline leverages the core technology—large language models processing natural language prompts to generate relevant output—but applies it to domain-specific challenges and workflows.

Software Development and DevOps

Software developers experience the most direct impact from generative AI adoption. AI-powered code reviews now identify issues that human reviewers might miss, analyzing code patterns across multiple files and flagging potential security vulnerabilities, error handling gaps, and performance concerns. These reviews happen automatically within CI/CD pipelines, providing feedback before code reaches production.

The integration with engineering intelligence platforms creates closed-loop improvement. When AI coding tools connect to delivery metrics systems, teams can measure how AI-generated code affects deployment frequency, lead time, and failure rates. This visibility enables continuous optimization of AI tool configuration and usage patterns.

Pull request analysis represents a specific high-value application. AI systems summarize changes, identify potential impacts on dependent systems, and suggest relevant reviewers based on code ownership patterns. For development teams managing high pull request volumes, this automation reduces review cycle time while improving coverage. Developer experience improves as engineers spend less time on administrative review tasks and more time on substantive technical discussion.

Automated testing benefits similarly from generative AI. AI systems generate test plans based on code changes, identify gaps in test coverage, and suggest test cases that exercise edge conditions. This capability for improving test coverage addresses a persistent challenge—comprehensive testing that keeps pace with rapid development.

Best Practices for Using Generative AI

Adopting generative AI tools in software development can dramatically boost coding efficiency, accelerate code generation, and enhance developer productivity. However, to fully realize these benefits and avoid common pitfalls, it’s essential to follow a set of best practices tailored to the unique capabilities and challenges of AI-powered development.

Define Clear Objectives

Before integrating generative AI into your workflow, establish clear goals for what you want to achieve—whether it’s faster code generation, improved code quality, or automating repetitive programming tasks. Well-defined objectives help you select the right AI tool and measure its impact on your software development process.

Choose the Right Tool for Your Stack

Select generative AI tools that align with your project’s requirements and support your preferred programming languages. Consider factors such as compatibility with code editors like Visual Studio Code, the accuracy of code suggestions, and the tool’s ability to integrate with your existing development environment. Evaluate whether the AI tool offers features like code formatting, code refactoring, and support for multiple programming languages to maximize its utility.

Prioritize High-Quality Training Data

The effectiveness of AI models depends heavily on the quality of their training data. Ensure that your AI coding assistant is trained on relevant, accurate, and up

Common Challenges and Solutions

Engineering teams implementing generative AI encounter predictable challenges. Addressing these proactively improves adoption success and long-term value realization.

Code Quality and Technical Debt Concerns

AI-generated code, while often functional, can introduce subtle quality issues that accumulate into technical debt. The solution combines automated quality gates with enhanced visibility.

Integrate AI code review tools that specifically analyze AI-generated code against your organization’s quality standards. Platforms providing engineering analytics should track technical debt metrics before and after AI tool adoption, enabling early detection of quality degradation. Establish human review requirements for all AI-generated code affecting critical systems or security-sensitive components.

Integration with Existing Engineering Workflows

Seamless workflow integration determines whether teams actively use AI tools or abandon them after initial experimentation.

Select tools with native integration for your Git workflows, CI/CD pipelines, and project management systems. Avoid tools requiring engineers to context-switch between their primary development environment and separate AI interfaces. The best AI tools embed directly where developers work—within VS Code, within pull request interfaces, within documentation platforms—rather than requiring separate application access.

Measure adoption through actual usage data rather than license counts. Engineering intelligence platforms can track AI tool engagement alongside traditional productivity metrics, identifying integration friction points that reduce adoption.

Team Adoption and Change Management

Technical implementation succeeds or fails based on team adoption. Engineers accustomed to writing code directly may resist AI-assisted approaches, particularly if they perceive AI tools as threatening their expertise or autonomy.

Address this through transparency about AI’s role as augmentation rather than replacement. Share data showing how AI handles repetitive tasks while freeing engineers for complex problem-solving requiring critical thinking and human expertise. Celebrate examples where AI-assisted development produced better outcomes faster.

Measure developer experience impacts directly. Survey teams on satisfaction with AI tools, identify pain points, and address them promptly. Track whether AI adoption correlates with improved or degraded engineering velocity and quality metrics.

The adoption challenge connects directly to the broader organizational transformation that generative AI enables, including the integration of development experience tools.

Generative AI and Code Review

Generative AI is revolutionizing the code review process by delivering automated, intelligent feedback powered by large language models and machine learning. Generative ai tools can analyze code for quality, security vulnerabilities, and performance issues, providing developers with real-time suggestions and actionable insights.

This AI-driven approach ensures that code reviews are thorough and consistent, catching issues that might be missed in manual reviews. By automating much of the review process, generative AI not only improves code quality but also accelerates the development workflow, allowing teams to deliver robust, secure software more efficiently. As a result, organizations benefit from higher-quality codebases and reduced risk, all while freeing up developers to focus on more strategic tasks.

Conclusion and Next Steps

Generative AI for engineering represents not a future possibility but a present reality reshaping how engineering teams operate. The technology has matured from experimental capability to production infrastructure, with mature organizations treating prompt engineering and AI integration as core competencies rather than optional enhancements.

The most successful implementations share common characteristics: clear baseline metrics enabling impact measurement, deliberate pilot programs generating organizational learning, quality gates ensuring AI augments rather than degrades engineering standards, and continuous improvement processes optimizing tool usage over time.

To begin your generative AI implementation:

  1. Evaluate your current engineering metrics—delivery speed, code quality, documentation currency, developer productivity
  2. Pilot one AI coding tool with a single team on a contained project
  3. Measure impact on the metrics you established, adjusting approach based on results
  4. Expand adoption deliberately, using measured outcomes to guide rollout speed and scope

For organizations seeking deeper understanding, related topics warrant exploration: DORA metrics frameworks for measuring engineering effectiveness, developer productivity measurement approaches, and methodologies for tracking AI impact on engineering outcomes over time.

Additional Resources

Engineering metrics frameworks for measuring AI impact:

  • DORA metrics (deployment frequency, lead time, change failure rate, time to restore) provide standardized measurement of delivery effectiveness
  • Developer experience surveys capture qualitative impacts of AI tool adoption
  • Code quality metrics (complexity, duplication, security vulnerability density) track AI effects on codebase health

Integration considerations for popular engineering tools:

  • Git-based workflows benefit from AI tools that operate at the pull request level
  • CI/CD pipelines can incorporate AI-powered code review as automated quality gates
  • Project management integration enables AI-assisted task estimation and planning

Key capabilities to evaluate in AI coding tools: For developers and teams focused on optimizing software delivery, it's also valuable to explore the best CI/CD tools.

  • Support for your programming languages and frameworks
  • Integration with your code editors and development environments
  • Data security and privacy controls appropriate for your industry
  • Retrieval augmented generation capabilities for project-specific context
  • Free version availability for evaluation before enterprise commitment
Productivity of Software

Enhancing the Productivity of Software: Key Strategies

The productivity of software is under more scrutiny than ever. After the 2022–2024 downturn, CTOs and VPs of Engineering face constant scrutiny from CEOs and CFOs demanding proof that engineering spend translates into real business value. This article is for engineering leaders, managers, and teams seeking to understand and improve the productivity of software development. Understanding software productivity is critical for aligning engineering efforts with business outcomes in today's competitive landscape. The question isn’t whether your team is busy—it’s whether the productivity of software your organization produces actually moves the needle.

Measuring developer productivity is a complex process that goes far beyond simple output metrics. Developer productivity is closely linked to the overall success of software development teams and the viability of the business.

This article answers how to measure and improve software productivity using concrete frameworks like DORA metrics, SPACE, and DevEx, while accounting for the AI transformation reshaping how developers work. Many organizations, including leading tech companies such as Facebook, Meta, and Uber, struggle to connect the creative and collaborative work of software developers to tangible business outcomes. We’ll focus on team-level and system-level productivity, tying software delivery directly to business outcomes like feature throughput, reliability, and revenue impact. Throughout, we’ll show how engineering intelligence platforms like Typo help mid-market and enterprise teams unify SDLC data and surface real-time productivity signals.

As an example of how industry leaders are addressing these challenges, Microsoft created the Developer Velocity Assessment (DVI) tool to help organizations measure and improve developer productivity by focusing on internal processes, tools, culture, and talent management.

Defining the “productivity of software”: beyond lines of code

When we talk about productivity of software, we’re not counting keystrokes or commits. We’re asking: how effectively does an engineering org convert time, tools, and talent into reliable, high-impact software in production?

This distinction matters because naive metrics create perverse incentives. Measuring developer productivity by lines of code rewards verbosity, not value. Senior engineering leaders learned this lesson decades ago, yet the instinct to count output persists.

Here’s a clearer way to think about it:

  • Effort refers to hours spent, commits made, meetings attended—the inputs your team invests
  • Output means features shipped, pull requests merged, services deployed—the tangible artifacts produced
  • Outcome captures user behavior changes, adoption rates, and support ticket trends—evidence that output matters to someone
  • Impact is the actual value delivered: revenue growth, NRR improvement, churn reduction, or cost savings

Naive Metrics vs. Outcome-Focused Metrics:

Naive Metrics Outcome-Focused Metrics
Lines of code added Deployment frequency
Commit counts Lead time for changes
Story points completed Feature adoption rate
PRs opened Change failure rate
Hours logged Revenue per engineering hour

Productive software systems share common characteristics: fast feedback loops, low friction in the software development process, and stable, maintainable codebases. Software productivity is emergent from process, tooling, culture, and now AI assistance—not reducible to a single metric.

The software engineering value cycle: effort → output → outcome → impact

Understanding the value cycle transforms how engineering managers think about measuring productivity. Let’s walk through a concrete example.

Imagine a software development team at a B2B SaaS company shipping a usage-based billing feature targeted for Q3 2025. Here’s how value flows through the system:

Software developers are key contributors at each stage of the value cycle, and their productivity should be measured in terms of meaningful outcomes and impact, not just effort or raw output.

Effort Stage:

  • Product and engineering alignment sessions (planning time in Jira/Linear)
  • Development work tracked via Git commits and branch activity
  • Code reviews consuming reviewer hours
  • Testing and QA cycles in CI/CD pipelines

Output Stage:

  • 47 merged pull requests across three microservices
  • Two new API endpoints deployed to production
  • Updated documentation and SDK changes released

Outcome Stage:

  • 34% of eligible customers adopt usage-based billing within 60 days
  • Support tickets related to billing confusion drop 22%
  • Customer-reported feature requests for billing flexibility close as resolved

Impact Stage:

  • +4% expansion NRR within two quarters
  • Sales team reports faster deal cycles for customers seeking flexible pricing
  • Customer satisfaction scores for billing experience increase measurably

Measuring productivity of software means instrumenting each stage—but decision-making should prioritize outcomes and impact. Your team can ship 100 features that nobody uses, and that’s not productivity—that’s waste.

Typo connects these layers by correlating SDLC events (PRs, deployments, incidents) with delivery timelines and user-facing milestones. This lets engineering leaders track progress from code commit to business impact without building custom dashboards from scratch.

Qualitative vs. Quantitative Metrics

Effective measurement of developer productivity requires a balanced approach that includes both qualitative and quantitative metrics. Qualitative metrics provide insights into developer experience and satisfaction, while quantitative metrics capture measurable outputs such as deployment frequency and cycle time.

Why measuring software productivity is uniquely hard

Every VP of Engineering has felt this frustration: the CEO asks for a simple metric showing whether engineering is “productive,” and there’s no honest, single answer.

Here’s why measuring productivity is uniquely difficult for software engineering teams:

The creativity factor makes output deceptive. A complex refactor or bug fix in 50 lines can be more valuable than adding 5,000 lines of new code. A developer who spends three days understanding a system failure before writing a single line may be the most productive developer that week. Traditional quantitative metrics miss this entirely.

Collaboration blurs individual contribution. Pair programming, architectural decisions, mentoring junior developers, and incident response often don’t show up cleanly in version control systems. The developer who enables developers across three teams to ship faster may have zero PRs that sprint.

Cross-team dependencies distort team-level metrics. In modern microservice and platform setups, the front-end team might be blocked for two weeks waiting on platform migrations. Their cycle time looks terrible, but the bottleneck lives elsewhere. System metrics without context mislead.

AI tools change the shape of output. With GitHub Copilot, Amazon CodeWhisperer, and internal LLMs, the relationship between effort and output is shifting. Fewer keystrokes produce more functionality. Output-only productivity measurement becomes misleading when AI tools influence productivity in ways raw commit counts can’t capture.

Naive metrics create gaming and fear. When individual developers know they’re ranked by PRs per week, they optimize for quantity over quality. The result is inflated PR counts, fragmented commits, and a culture where team members game the system instead of building software that matters.

Well-designed productivity metrics surface bottlenecks and enable healthier, more productive systems. Poorly designed ones destroy trust.

Core frameworks for understanding the productivity of software

Several frameworks have emerged to help engineering teams measure development productivity without falling into the lines of code trap. Each captures something valuable—and each has blind spots. These frameworks aim to measure software engineering productivity by assessing efficiency, effectiveness, and impact across multiple dimensions.

DORA Metrics (2014–2021, State of DevOps Reports)

DORA metrics remain the gold standard for measuring delivery performance across software engineering organizations. The four key indicators:

  • Deployment frequency measures how often your team deploys to production. Elite teams deploy multiple times per day; low performers might deploy monthly.
  • Lead time for changes tracks time from first commit to production. Elite teams achieve under one hour.
  • Mean time to restore (MTTR) captures how quickly you recover from system failure. Elite performers restore service in under an hour.
  • Change failure rate measures what percentage of deployments cause production issues. Elite teams stay between 0-15%.

Research shows elite performers—about 20% of surveyed organizations—deploy 208 times more frequently with 106 times faster lead times than low performers. DORA metrics measure delivery performance and stability, not individual performance.

Typo uses DORA-style metrics as baseline health indicators across repos and services, giving engineering leaders a starting point for understanding overall engineering productivity.

SPACE Framework (Microsoft/GitHub, 2021)

SPACE legitimized measuring developer experience and collaboration as core components of productivity. The five dimensions:

  • Satisfaction and well-being: How developers feel about their work, tools, and team
  • Performance: Outcomes and quality of work produced
  • Activity: Observable actions like commits, reviews, and deployments
  • Communication & collaboration: How effectively team members work together
  • Efficiency & flow: Ability to complete work without friction or interruptions

SPACE acknowledges that developer sentiment matters and that qualitative metrics belong alongside quantitative ones.

DX Core 4 Framework

The DX Core 4 framework unifies DORA, SPACE, and Developer Experience into four dimensions: speed, effectiveness, quality, and business impact. This approach provides a comprehensive view of software engineering productivity by integrating the strengths of each framework.

DevEx / Developer Experience

DevEx encompasses the tooling, process, documentation, and culture shaping day-to-day development work. Companies like Google, Microsoft, and Shopify now have dedicated engineering productivity or DevEx teams specifically focused on making developers work more effective. The Developer Experience Index (DXI) is a validated measure that captures key engineering performance drivers.

Key DevEx signals include build times, test reliability, deployment friction, code review turnaround, and documentation quality. When DevEx is poor, even talented teams struggle to ship.

Value Stream & Flow Metrics

Flow metrics help pinpoint where value gets stuck between idea and production:

  • Cycle time: Total time from first commit to production deployment
  • Time in review: How long PRs wait for and undergo review
  • Time in waiting: Idle time where work sits blocked
  • Work in progress (WIP): Active items consuming team attention
  • Throughput: Completed items per time period

High WIP correlates strongly with context switching and elongated cycle times. Teams juggling too many items dilute focus and slow delivery.

Typo combines elements of DORA, SPACE, and flow into a practical engineering intelligence layer—rather than forcing teams to choose one framework and ignore the others.

What not to do: common anti-patterns in software productivity measurement

Before diving into effective measurement, let’s be clear about what destroys trust and distorts behavior.

Lines of code and commit counts reward noise, not value.

LOC and raw commit counts incentivize verbosity. A developer who deletes 10,000 lines of dead code improves system health and reduces tech debt—but “scores” negatively on LOC metrics. A developer who writes bloated, copy-pasted implementations looks like a star. This is backwards.

Per-developer output rankings create toxic dynamics.

Leaderboard dashboards ranking individual developers by PRs or story points damage team dynamics and encourage gaming. They also create legal and HR risks—bias and misuse concerns increasingly push organizations away from individual productivity scoring.

Ranking individual developers by output metrics is the fastest way to destroy the collaboration that makes the most productive teams effective.

Story points and velocity aren’t performance metrics.

Story points are a planning tool, helping teams forecast capacity. They were never designed as a proxy for business value or individual performance. When velocity gets tied to performance reviews, teams inflate estimates. A team “completing” 80 points per sprint instead of 40 isn’t twice as productive—they’ve just learned to game the system.

Time tracking and “100% utilization” undermine creative work.

Measuring keystrokes, active windows, or demanding 100% utilization treats software development like assembly line work. It undermines trust and reduces the creative problem-solving that building software requires. Sustainable software productivity requires slack for learning, design, and maintenance.

Single-metric obsession creates blind spots.

Optimizing only for deployment frequency while ignoring change failure rate leads to fast, broken releases. Obsessing over throughput while ignoring developer sentiment leads to burnout. Metrics measured in isolation mislead.

How to measure the productivity of software systems effectively

Here’s a practical playbook engineering leaders can follow to measure software developer productivity without falling into anti-patterns.

Start by clarifying objectives with executives.

  • Tie measurement goals to specific business questions: “Can we ship our 2026 roadmap items without adding 20% headcount?” or “Why do features take three months from design to production?”
  • Decide upfront that metrics will improve systems and teams, not punish individual developers
  • Get explicit buy-in that you’re measuring to empower developers, not surveil them

Establish baseline SDLC visibility.

  • Integrate Git (GitHub, GitLab, Bitbucket), issue trackers (Jira, Linear), and CI/CD (CircleCI, GitHub Actions, GitLab CI, Azure DevOps) into a single view
  • Track end-to-end cycle time, PR size and review time, deployment frequency, and incident response times
  • Build historical data baselines before attempting to measure improvement

Layer on DORA and flow metrics.

  • Compute DORA metrics per service or team over at least a full quarter to smooth anomalies
  • Add flow metrics (time waiting for review, time in QA, time blocked) to explain why DORA metrics look the way they do
  • Track trends over time rather than snapshots—improvement matters more than absolute numbers

Include developer experience signals.

  • Run lightweight, anonymous DevEx surveys quarterly, with questions about friction in builds, tests, deployments, and code reviews
  • Segment results by team, seniority, and role to identify local bottlenecks (e.g., platform team suffering from constant interrupts)
  • Use self reported data to complement system metrics—neither tells the whole story alone

Correlate engineering metrics with product and business outcomes.

  • Connect releases and epics to product analytics (adoption, retention, NPS) where possible
  • Track time spent on new feature development vs. maintenance and incidents as a leading indicator of future impact
  • Measure how many bugs escape to production and their severity—quality metrics predict customer satisfaction

Typo does most of this integration automatically, surfacing key delivery signals and DevEx trends so leaders can focus on decisions, not pipeline plumbing.

Engineering teams and collaboration: the human factor in productivity

The Role of Team Collaboration

In the world of software development, the productivity of engineering teams hinges not just on tools and processes, but on the strength of collaboration and the human connections within the team. Measuring developer productivity goes far beyond tracking lines of code or counting pull requests; it requires a holistic view that recognizes the essential role of teamwork, communication, and shared ownership in the software development process.

Effective collaboration among team members is a cornerstone of high-performing software engineering teams. When developers work together seamlessly—sharing knowledge, reviewing code, and solving problems collectively—they drive better code quality, reduce technical debt, and accelerate the delivery of business value. The most productive teams are those that foster open communication, trust, and a sense of shared purpose, enabling each individual to contribute their best work while supporting the success of the entire team.

Qualitative vs. Quantitative Metrics

To accurately measure software developer productivity, engineering leaders must look beyond traditional quantitative metrics. While DORA metrics such as deployment frequency, lead time, and change failure rate provide valuable insights into the development process, they only tell part of the story. Complementing these with qualitative metrics—like developer sentiment, team performance, and self-reported data—offers a more complete picture of productivity outcomes. Qualitative metrics provide insights into developer experience and satisfaction, while quantitative metrics capture measurable outputs such as deployment frequency and cycle time. For example, regular feedback surveys can surface hidden bottlenecks, highlight areas for improvement, and reveal how team members feel about their work environment and the development process.

Engineering managers play a pivotal role in influencing productivity by creating an environment that empowers developers. This means providing the right tools, removing obstacles, and supporting continuous improvement. Prioritizing developer experience and well-being not only improves overall engineering productivity but also reduces turnover and increases the business value delivered by the software development team.

Balancing individual performance with team collaboration is key. While it’s important to recognize and reward outstanding contributions, the most productive teams are those where success is shared and collective ownership is encouraged. By tracking both quantitative metrics (like deployment frequency and lead time) and qualitative insights (such as code quality and developer sentiment), organizations can make data-driven decisions to optimize their development process and drive better business outcomes.

Self-reported data from developers is especially valuable for understanding the human side of productivity. By regularly collecting feedback and analyzing sentiment, engineering leaders can identify pain points, address challenges, and create a more positive and productive work environment. This human-centered approach not only improves developer satisfaction but also leads to higher quality software and more successful business outcomes.

Ultimately, fostering a culture of collaboration, open communication, and continuous improvement is essential for unlocking the full potential of engineering teams. By valuing the human factor in productivity and leveraging both quantitative and qualitative metrics, organizations can build more productive teams, deliver greater business value, and stay competitive in the fast-paced world of software development.

AI and the changing face of software productivity

AI Tool Adoption Metrics

The 2023–2026 AI inflection—driven by Copilot, Claude, and internal LLMs—is fundamentally changing what software developer productivity looks like. Engineering leaders need new approaches to understand AI’s impact.

How AI coding tools change observable behavior:

  • Fewer keystrokes and potentially fewer commits per feature as AI tools accelerate coding
  • Larger semantic jumps per commit—more functionality with less manually authored code
  • Different bug patterns and review needs for AI-generated code
  • Potential quality concerns around maintainability and code comprehension

Practical AI impact metrics to track:

  • Adoption: What percentage of engineers actively use AI tools weekly?
  • Throughput: How have cycle time and lead time changed after AI introduction?
  • Quality: What’s happening to change failure rate, post-deploy bugs, and incident severity on AI-heavy services?
  • Maintainability: How long does onboarding new engineers to AI-heavy code areas take? How often does AI-generated code require refactoring?

Keep AI metrics team-level, not individual.

Avoid attaching “AI bonus” scoring or rankings to individual developers. The goal is understanding system improvements and establishing guardrails—not creating new leaderboards.

Responding to AI-Driven Changes

Concrete example: A team introducing Copilot in 2024

One engineering team tracked their AI tool adoption through Typo after introducing Copilot. They observed 15–20% faster cycle times within the first quarter. However, code quality signals initially dipped—more PRs required multiple review rounds, and change failure rate crept up 3%.

The team responded by introducing additional static analysis rules and AI-specific code review guidelines. Within two months, quality stabilized while throughput gains held. This is the pattern: AI tools can dramatically improve developer velocity, but only when paired with quality guardrails.

Typo tracks AI-related signals—PRs with AI review suggestions, patterns in AI-assisted changes—and correlates them with delivery and quality over time.

Improving the productivity of software: practical levers for engineering leaders

Understanding metrics is step one. Actually improving the productivity of software requires targeted interventions tied back to those metrics. To improve developer productivity, organizations should adopt strategies and frameworks—such as flow metrics and holistic approaches—that systematically enhance engineering efficiency.

Reduce cycle time by fixing review and CI bottlenecks.

  • Use PR analytics to identify repos with long “time to first review” and oversized pull requests
  • Introduce policies like smaller PRs (research shows PRs under 400 lines achieve 2-3x faster cycle times), dedicated review hours, and reviewer load balancing
  • Track code reviews turnaround time and set team expectations
  • Improving developer productivity starts with optimizing workflows and reducing technical debt.

Invest in platform engineering and internal tooling.

  • Unified build pipelines, golden paths, and self-service environments dramatically reduce friction
  • Measure time-to-first-commit for new services and build times to quantify improvements
  • Platform investments compound—every team benefits from better infrastructure

Systematically manage technical debt.

  • Allocate a fixed percentage (15–25%) of capacity to refactoring and reliability work per quarter
  • Track incidents, on-call load, and maintenance vs. feature development work to justify debt paydown to product and finance stakeholders
  • Prevent the maintenance trap where less than 20% of time goes to new capabilities

Improve documentation and knowledge sharing.

  • Measure onboarding time for new engineers on core services (time to first merged PR, time to independently own incidents)
  • Encourage architecture decision records (ADRs) and living system docs
  • Monitor if onboarding metrics improve after documentation investments

Streamline processes and workflows.

  • Streamlining processes and workflows can help improve developer productivity.

Protect focus time and reduce interruption load.

  • Research shows interruptions consume 40% of development time for many teams
  • Cut unnecessary meetings, especially for senior ICs and platform teams
  • Pair focus-time initiatives with survey questions about “ability to get into flow” and check correlation with delivery metrics
  • A positive culture has a greater impact on productivity than most tracking tools or metrics.

Typo validates which interventions move the needle by comparing before/after trends in cycle time, DORA metrics, DevEx scores, and incident rates. Continuous improvement requires closing the feedback loop between action and measurement.

Team-level vs. individual productivity: where to focus

Software is produced by teams, not isolated individuals. Architecture decisions, code reviews, pair programming, and on-call rotations blur individual ownership of output. Trying to measure individual performance through system metrics creates more problems than it solves. Measuring and improving the team's productivity is essential for enhancing overall team performance and identifying opportunities for continuous improvement.

Focus measurement at the squad or stream-aligned team level:

  • Track DORA metrics, cycle time, and flow metrics by team, not by person
  • Use qualitative feedback and 1:1s to support individual developers without turning dashboards into scorecards
  • Recognize that team’s productivity emerges from how team performs together, not from summing individual outputs

How managers can use team-level data effectively:

  • Identify teams under chronic load or with high incident rates—then add headcount, tooling, or redesign work to help
  • Spot healthy patterns and replicate them (e.g., teams with consistently small PRs and low change failure rates)
  • Compare similar teams to find what practices differentiate the most productive teams from struggling ones
  • Effective communication and collaboration amongst team members significantly boost productivity.
  • High-performing teams maintain clear communication channels and streamlined processes, which directly impacts productivity.
  • Creating a culture of collaboration and learning can significantly enhance developer productivity.

The entire team succeeds or struggles together. Metrics should reflect that reality.

Typo’s dashboards are intentionally oriented around teams, repos, and services—helping leaders avoid the per-engineer ranking traps that damage trust and distort behavior.

How Typo helps operationalize software productivity measurement

Typo is an AI-powered engineering intelligence platform designed to make productivity measurement practical, not theoretical.

Unified SDLC visibility:

  • Connects Git, CI/CD, issue trackers, and incident tools into a single layer
  • Works with common stacks including GitHub, GitLab, Jira, and major CI providers
  • Typically pilots within days, not months of custom integration work

Real-time delivery and quality signals:

  • Computes cycle time, review bottlenecks, deployment frequency measures, and DORA metrics automatically
  • Tracks how team performs across repos and services without manual data collection
  • Provides historical data for trend analysis and forecasting delivery timelines

AI-based code review and delivery insights:

  • Automatically flags risky PRs, oversized changes, and hotspots based on historical incident data
  • Suggests reviewers and highlights code areas likely to cause regressions
  • Helps maintain code quality as teams adopt AI coding tools

Developer experience and AI impact capabilities:

  • Built-in DevEx surveys and sentiment tracking tied to specific tools, teams, and workflows
  • Measures AI coding tool impact by correlating adoption with delivery and quality trends
  • Surfaces productivity outcomes alongside the developer experience signals that predict them

Typo exists to help engineering leaders answer the question: “Is our software development team getting more effective over time, and where should we invest next?”

Ready to see your SDLC data unified? Start Free Trial, Book a Demo, or join a live demo to see Typo in action.

Getting started: a 90-day plan to improve the productivity of your software organization

Here’s a concrete roadmap to operationalize everything in this article.

  1. Phase 1 (Weeks 1–3): Instrumentation and baselines
    • Connect SDLC tools to a platform like Typo to gather cycle time, DORA metrics, and PR analytics
    • Run a short, focused DevEx survey to understand where engineers feel the most friction
    • Establish baseline measurements before attempting any interventions
    • Identify 3-5 candidate bottlenecks based on initial data
  2. Phase 2 (Weeks 4–8): Targeted interventions
    • Choose 2–3 clear bottlenecks (long review times, flakey tests, slow deployments) and run focused experiments
    • Introduce small PR guidelines, clean up CI pipelines, or pilot a platform improvement
    • Track whether interventions are affecting the metrics you targeted
    • Gather qualitative feedback from team members on whether changes feel helpful
  3. Phase 3 (Weeks 9–12): Measure impact and expand
    • Compare before/after metrics on cycle time, deployment frequency, change failure rate, and DevEx scores
    • Decide which interventions to scale across teams and where to invest next quarter
    • Build the case for ongoing investments (AI tooling, platform team expansion, documentation push) using actual value demonstrated
    • Establish ongoing measurement cadence for continuous improvement

Sustainable productivity of software is about building a measurable, continuously improving system—not surveilling individuals. The goal is enabling engineering teams to ship faster, with higher quality, and with less friction. Typo exists to make that shift easier and faster.

Start your free trial today to see how your engineering organization’s productivity signals compare—and where you can improve next.

Generative AI for Developers

Top Generative AI for Developers: Enhance Your Coding Skills Today

Why generative AI matters for developers in 2026

Between 2022 and 2026, generative AI has become an indispensable part of the developer stack. What began with GitHub Copilot’s launch in 2021 has evolved into a comprehensive ecosystem where AI-powered code completion, refactoring, test generation, and even autonomous code reviews are embedded into nearly every major IDE and development platform.

The pace of innovation continues at a rapid clip. In 2025 and early 2026, advancements in models like GPT-4.5, Claude 4, Gemini 3, and Qwen4-Coder have pushed the boundaries of code understanding and generation. AI-first IDEs such as Cursor and Windsurf have matured, while established platforms like JetBrains, Visual Studio, and Xcode have integrated deeper AI capabilities directly into their core products.

So what can generative AI do for your daily coding in 2026? The practical benefits include generating code from natural language prompts, intelligent refactoring, debugging assistance, test scaffolding, documentation generation, automated pull request reviews, and even multi-file project-wide edits. These features are no longer experimental; millions of developers rely on them to streamline writing, testing, debugging, and managing code throughout the software development lifecycle.

Most importantly, AI acts as an amplifier, not a replacement. The biggest gains come from increased productivity, fewer context switches, faster feedback loops, and improved code quality. The “no-code” hype has given way to a mature understanding: generative AI is a powerful assistant that accelerates developers’ existing skills. Developers now routinely use generative AI to automate manual tasks, improve code quality, and shorten delivery timelines by up to 60%.

This article targets two overlapping audiences: individual developers seeking hands-on leverage in daily work, and senior engineering leaders evaluating team-wide impact, governance, and ROI. Whether you’re writing Python code in Visual Studio Code or making strategic decisions about AI tooling across your organization, you’ll find practical guidance here.

One critical note before diving deeper: the increase in AI-generated code volume and velocity makes developer productivity and quality tooling more important than ever. Platforms like Typo provide essential visibility to understand where AI is helping and where it might introduce risk—topics we explore throughout this guide. AI coding tools continue to significantly enhance developers' capabilities and efficiency.

A developer is seated at a modern workstation, surrounded by multiple screens filled with code editors and terminal windows, showcasing various programming tasks. The setup highlights the use of advanced AI coding tools for code generation, real-time code suggestions, and efficient development processes, enhancing coding efficiency and code quality.

Core capabilities of generative AI coding assistants for developers

Generative AI refers to AI systems that can generate entire modules, standardized functions, and boilerplate code from natural language prompts. In 2026, large language model (LLM)-based tools have matured well beyond simple autocomplete suggestions.

Here’s what generative AI tools reliably deliver today:

  • Inline code completion: AI-powered code completion now predicts entire functions or code blocks from context, not just single tokens. Tools like GitHub Copilot, Cursor, and Gemini provide real-time, contextually relevant suggestions tailored to your specific project or code environment, understanding your project context and coding patterns.
  • Natural language to code: Describe what you want in plain English, and the model generates working code. This works especially well for boilerplate, CRUD operations, and implementations of well-known patterns.
  • Code explanation and understanding: Paste unfamiliar or complex code into an AI chat, and get clear explanations of what it does. This dramatically reduces the time spent deciphering legacy systems.
  • Code refactoring: Request specific transformations—extract a function, convert to async, apply a design pattern—and get accurate code suggestions that preserve behavior.
  • Test generation: AI excels at generating unit tests, integration tests, and test scaffolds from existing code. This is particularly valuable for under-tested legacy codebases.
  • Log and error analysis: Feed stack traces, logs, or error messages to an AI assistant and get likely root causes, reproduction steps, and suggested bug fixes.
  • Cross-language translation: Need to port Python code to Go or migrate from one framework to another? LLMs handle various programming tasks involving translation effectively.

Modern models like Claude 4, GPT-4.5, Gemini 3, and Qwen4-Coder now handle extremely long contexts—often exceeding 1 million tokens—which means they can understand multi-file changes across large codebases. This contextual awareness makes them far more useful for real-world development than earlier generations.

AI agents take this further by extending beyond code snippets to project-wide edits. They can run tests, update configuration files, and even draft pull request descriptions with reasoning about why changes were made. Tools like Cline, Aider, and Qodo represent this agentic approach, helping to improve workflow.

That said, limitations remain. Hallucinations still occur—models sometimes fabricate APIs or suggest insecure patterns. Architectural understanding is often shallow. Security blind spots exist. Over-reliance without thorough testing and human review remains a risk. These tools augment experienced developers; they don’t replace the need for code quality standards and careful review.

Types of generative AI tools in the modern dev stack

The 2026 ecosystem isn’t about finding a single “winner.” Most teams mix and match tools across categories, choosing the right instrument for each part of their development workflow. Modern development tools integrate AI-powered features to enhance the development process by combining IDE capabilities with project management and tool integration, streamlining coding efficiency and overall project workflow.

  • IDE-native assistants: These live inside your code editor and provide inline completions, chat interfaces, and refactoring support. Examples include GitHub Copilot, JetBrains AI Assistant, Cursor, Windsurf, and Gemini Code Assist. Most professional developers now use at least one of these daily in Visual Studio Code, Visual Studio, JetBrains IDEs, or Xcode.
  • Browser-native builders: Tools like Bolt.new and Lovable let you describe applications in natural language and generate full working prototypes in your browser. They’re excellent for rapid prototyping but less suited for production codebases with existing architecture.
  • Terminal and CLI agents: Command-line tools like Aider, Gemini CLI, and Claude CLI enable repo-wide refactors and complex multi-step changes without leaving your terminal. They integrate well with version control workflows.
  • Repository-aware agents: Cline, Sourcegraph Cody, and Qodo (formerly Codium) understand your entire repository structure, pull in relevant code context, and can make coordinated changes across multiple files. These are particularly valuable for code reviews and maintaining consistency.
  • Cloud-provider assistants: Amazon Q Developer and Gemini Code Assist are optimized for cloud-native development, offering built-in support for cloud services, infrastructure-as-code, and security best practices specific to their platforms.
  • Specialized domain tools: CodeWP handles WordPress development, DeepCode (Snyk) focuses on security vulnerability detection, and various tools target specific frameworks or languages. These provide deeper expertise in narrow domains.
  • Developer productivity and quality platforms: Alongside pure AI tools, platforms like Typo integrate AI context to help teams measure throughput, identify friction points, and maintain standards. This category focuses less on generating code and more on ensuring the code that gets generated—by humans or AI—stays maintainable and high-quality.

Getting started with AI coding tools

Jumping into the world of AI coding tools is straightforward, thanks to the wide availability of free plans and generous free tiers. To get started, pick an AI coding assistant that fits your workflow—popular choices include GitHub Copilot, Tabnine, Qodo, and Gemini Code Assist. These tools offer advanced AI capabilities such as code generation, real-time code suggestions, and intelligent code refactoring, all designed to boost your coding efficiency from day one.

Once you’ve selected your AI coding tool, take time to explore its documentation and onboarding tutorials. Most modern assistants are built around natural language prompts, allowing you to describe what you want in plain English and have the tool generate code or suggest improvements. Experiment with different prompt styles to see how the AI responds to your requests, whether you’re looking to generate code snippets, complete functions, or fix bugs.

Don’t hesitate to take advantage of the free plan or free tier most tools offer. This lets you test out features like code completion, bug fixes, and code suggestions without any upfront commitment. As you get comfortable, you’ll find that integrating an AI coding assistant into your daily routine can dramatically accelerate your development process and help you tackle repetitive tasks with ease.

How generative AI changes the developer workflow

Consider the contrast between a developer’s day in 2020 versus 2026.

In 2020, you’d hit a problem, open a browser tab, search Stack Overflow, scan multiple answers, copy a code snippet, adapt it to your context, and hope it worked. Context switching between editor, browser, and documentation was constant. Writing tests meant starting from scratch. Debugging involved manually adding log statements and reasoning through traces.

In 2026, you describe the problem in your IDE’s AI chat, get a relevant solution in seconds, and tab-complete your way through the implementation. The AI assistant understands your project context, suggests tests as you write, and can explain confusing error messages inline. The development process has fundamentally shifted.

Here’s how AI alters specific workflow phases:

Requirements and design: AI can transform high-level specs into skeleton implementations. Describe your feature in natural language, and get an initial architecture with interfaces, data models, and stub implementations to refine.

Implementation: Inline code completion handles boilerplate and repetitive tasks. Need error handling for an API call? Tab-complete it. Writing database queries? Describe what you need in comments and let the AI generate code.

Debugging: Paste a stack trace into an AI chat and get analysis of the likely root cause, suggested fixes, and even reproduction steps. This cuts debugging time dramatically for common error patterns and can significantly improve developer productivity.

Testing: AI-generated test scaffolds cover happy paths and edge cases you might miss. Tools like Qodo specialize in generating comprehensive test suites from existing code.

Maintenance: Migrations, refactors, and documentation updates that once took days can happen in hours. Commit message generation and pull request descriptions get drafted automatically, powered by the AI engineering intelligence platform Typo.

Most developers now use multi-tool workflows: Cursor or VS Code with Copilot for daily coding, Cline or Qodo for code reviews and complex refactors, and terminal agents like Aider for repo-wide changes.

AI reduces micro-frictions—tab switching, hunting for examples, writing repetitive code—but can introduce macro-risks if teams lack guardrails. Inconsistent patterns, hidden complexity, and security vulnerabilities can slip through when developers trust AI output without critical review.

A healthy pattern: treat AI as a pair programmer you’re constantly reviewing. Ask for explanations of why it suggested something. Prompt for architecture decisions and evaluate the reasoning. Use it as a first draft generator, not an oracle.

For leaders, this shift means more code generated faster—which requires visibility into where AI was involved and how changes affect long-term maintainability. This is where developer productivity tools become essential.

Evaluating generative AI tools: what devs and leaders should look for

Tool evaluation in 2026 is less about raw “model IQ” and more about fit, IDE integration, and governance. A slightly less capable model that integrates seamlessly into your development environment will outperform a more powerful one that requires constant context switching.

Key evaluation dimensions to consider:

  • Code quality and accuracy: Does the tool generate code that actually compiles and works? How often do you need to fix its suggestions? Test this on real tasks from your codebase, not toy examples.
  • Context handling: Can the tool access your repository, related tickets, and documentation? Tools with poor contextual awareness generate generic code that misses your patterns and conventions.
  • Security and privacy: Where does your code go when you use the tool? Enterprise teams need clear answers on data retention, whether code trains future models, and options for on-prem or VPC deployment. Check for API key exposure risks.
  • Integration depth: Does it work natively in your IDE (VS Code extension, JetBrains plugin) or require a separate interface? Seamless integration beats powerful-but-awkward every time.
  • Performance and latency: Slow suggestions break flow. For inline completion, sub-second responses are essential. For larger analysis tasks, a few seconds is acceptable.

Consider the difference between a VS Code-native tool like GitHub Copilot and a browser-based IDE like Bolt.new. Copilot meets developers where they already work; Bolt.new requires adopting a new environment entirely. For quick prototypes Bolt.new shines, but for production work the integrated approach wins.

Observability matters for leaders. How can you measure AI usage across your team? Which changes involved AI assistance? This is where platforms like Typo become valuable—they can aggregate workflow telemetry to show where AI-driven changes cause regressions or where AI assistance accelerates specific teams.

Pricing models vary significantly:

  • Flat-rate subscriptions (GitHub Copilot Business: ~$19/user/month)
  • Per-token pricing (can spike with heavy usage)
  • Hybrid models combining subscription with usage caps
  • Self-hosted options using local AI models (Qwen4-Coder via Unsloth, models in Xcode 17)

For large teams, cost modeling against actual usage patterns is essential before committing.

The best evaluation approach: pilot tools on real PRs and real incidents. Test during a production bug postmortem—see how the AI assistant handles actual debugging pressure before rolling out across the org.

Developer productivity in the age of AI-generated code

Classic productivity metrics were already problematic—lines of code and story points have always been poor proxies for value. When AI can generate code that touches thousands of lines in minutes, these metrics become meaningless.

The central challenge for 2026 isn’t “can we write more code?” It’s “can we keep AI-generated code reliable, maintainable, and aligned with our architecture and standards?” Velocity without quality is just faster accumulation of technical debt.

This is where developer productivity and quality platforms become essential. Tools like Typo help teams by:

  • Surfacing friction points: Where do developers get stuck? Which code reviews languish? Where does context switching kill momentum?
  • Highlighting slow cycles: Code review bottlenecks, CI failures, and deployment delays become visible and actionable.
  • Detecting patterns: Excessive rework on AI-authored changes, higher defect density in certain modules, or teams that struggle with AI integration.

The key insight is correlating AI usage with outcomes:

  • Defect rates: Do modules with heavy AI assistance have higher or lower bug counts?
  • Lead time for changes: From commit to production—is AI helping or hurting?
  • MTTR for incidents: Can AI-assisted teams resolve issues faster?
  • Churn in critical modules: Are AI-generated changes stable or constantly revised?

Engineering intelligence tools like Typo can integrate with AI tools by tagging commits touched by Copilot, Cursor, or Claude. This gives leaders a view into where AI accelerates work versus where it introduces risk—data that’s impossible to gather from git logs alone. To learn more about the importance of collaborative development practices like pull requests, visit our blog.

Senior engineering leaders should use these insights to tune policies: when to allow AI-generated code, when to require additional review, and which teams might need training or additional guardrails. This isn’t about restricting AI; it’s about deploying it intelligently.

Governance, security, and compliance for AI-assisted development

Large organizations have shifted from ad-hoc AI experimentation to formal policies. If you’re responsible for software development at scale, you need clear answers to governance questions:

  • Allowed tools: Which AI assistants can developers use? Is there a vetted list?
  • Data residency: Where does code go when sent to AI providers? Is it stored?
  • Proprietary code handling: Can sensitive code be sent to third-party LLMs? What about production secrets or API keys?
  • IP treatment: Who owns AI-generated code? How do licensing concerns apply?

Security considerations require concrete tooling:

  • SAST/DAST integration: Tools like Typo SAST, Snyk and DeepCode AI scan for security vulnerabilities in both human and AI-generated code.
  • Security-focused review: Qodo and similar platforms can flag security smells during code review.
  • Cloud security: Amazon Q Developer scans AWS code for misconfigurations; Gemini Code Assist does the same for GCP.

Compliance and auditability matter for regulated industries. You need records of:

  • Which AI tools were used on which changesets.
  • Mapping changes to JIRA or Linear tickets.
  • Evidence for SOC2/ISO27001 audits.
  • Internal risk review documentation.

Developer productivity platforms like Typo serve as a control plane for this data. They aggregate workflow telemetry from Git, CI/CD, and AI tools to produce compliance-friendly reports and leader dashboards. When an auditor asks “how do you govern AI-assisted development?” you have answers backed by data.

Governance should be enabling rather than purely restrictive. Define safe defaults and monitoring rather than banning AI and forcing shadow usage. Developers will find ways to use AI regardless—better to channel that into sanctioned, observable patterns.

Integration with popular IDEs and code editors

AI coding tools are designed to fit seamlessly into your existing development environment, with robust integrations for the most popular IDEs and code editors. Whether you’re working in Visual Studio Code, Visual Studio, JetBrains IDEs, or Xcode, you’ll find that leading tools like Qodo, Tabnine, GitHub Copilot, and Gemini Code Assist offer dedicated extensions and plugins to bring AI-powered code completion, code generation, and code reviews directly into your workflow.

For example, the Qodo VS Code extension delivers accurate code suggestions, automated code refactoring, and even AI-powered code reviews—all without leaving your editor. Similarly, Tabnine’s plugin for Visual Studio provides real-time code suggestions and code optimization features, helping you maintain high code quality as you work. Gemini Code Assist’s integration across multiple IDEs and terminals offers a seamless experience for cloud-native development.

These integrations minimize context switching and streamline your development workflow. This not only improves coding efficiency but also ensures that your codebase benefits from the latest advances in AI-powered code quality and productivity.

Practical patterns for individual developers

Here’s how to get immediate value from generative AI this week, even if your organization’s policy is still evolving. If you're also rethinking how to measure developer performance, consider why Lines of Code can be misleading and what smarter metrics reveal about true impact.

Daily patterns that work:

  • Spike solutions: Use AI for quick prototypes and exploratory code, then rewrite critical paths yourself with deeper understanding to improve developer productivity.
  • Code explanation: Paste unfamiliar code into an AI chat before diving into modifications—build code understanding before changing anything.
  • Test scaffolding: Generate initial test suites with AI, then refine for edge cases and meaningful assertions.
  • Mechanical refactors: Use terminal agents like Aider for find-and-replace-style changes across many files.
  • Error handling and debugging: Feed error messages to AI for faster diagnosis of bug fixes.

Platforms like Typo are designed for gaining visibility, removing blockers, and maximizing developer effectiveness.

Combine tools strategically:

  • VS Code + Copilot or Cursor for inline suggestions during normal coding.
  • Cline or Aider for repo-wide tasks like migrations or architectural changes.
  • ChatGPT or Claude via browser for architecture discussions and design decisions.
  • GitHub Copilot for pull request descriptions and commit message drafts.

Build AI literacy:

  • Learn prompt patterns that consistently produce good results for your domain.
  • Review AI code critically—don’t just accept suggestions.
  • Track when AI suggestions fail: edge cases, concurrency, security, performance are common weak spots.
  • Understand the free tier and paid plan differences for tools you rely on.

If your team uses Typo or similar productivity platforms, pay attention to your own metrics. Understand where you’re slowed down—reviews, debugging, context switching—and target AI assistance at those specific bottlenecks.

Developers who can orchestrate both AI tools and productivity platforms become especially valuable. They translate individual improvements into systemic gains that benefit entire teams.

Strategies for senior engineering leaders and CTOs

If you’re a VP of Engineering, Director, or CTO in 2026, you’re under pressure to “have an AI strategy” without compromising reliability. Here’s a framework that works.

Phased rollout approach:

Phase Focus Duration
Discovery Discovery of the power of integrating GitHub with JIRA using Typo’s analytics platform and software development analytics tools. Small pilots on volunteer teams using 2–3 AI tools. 4–6 weeks
Measurement Establish baseline developer metrics using platforms such as Typo. 2–4 weeks
Controlled Expansion Scale adoption with risk control through static code analysis. Standardize the toolset across squads using an Engineering Management Platform. 8–12 weeks
Continuous Tuning Introduce policies and guardrails based on observed usage and performance patterns. Ongoing

Define success metrics carefully:

  • Lead time (commit to production)
  • Deployment frequency
  • Change fail rate
  • Developer satisfaction scores
  • Time saved on repetitive tasks

Avoid vanity metrics like “percent of code written by AI.” That number tells you nothing about value delivered or quality maintained.

Use productivity dashboards proactively: Platforms like Typo surface unhealthy trends before they become crises:

  • Spikes in reverts after AI-heavy sprints.
  • Higher defect density in modules with heavy AI assistance.
  • Teams struggling with AI adoption vs. thriving teams.

When you see problems, respond with training or process changes—not tool bans.

Budgeting and vendor strategy:

  • Avoid tool sprawl: consolidate on 2-3 AI tools plus one productivity platform.
  • Negotiate enterprise contracts that bundle AI + productivity tooling.
  • Consider hybrid strategies: hosted models for most use cases, local AI models for sensitive code.
  • Factor in the generous free tier offers when piloting—but model actual costs at scale.

Change management is critical: If you're considering development analytics solutions as part of your change management strategy, you might want to compare top Waydev alternatives to find the platform that best fits your team's needs.

  • Communicate clearly that AI is a co-pilot, not a headcount reduction tactic.
  • Align incentives with quality and maintainability, not raw output.
  • Update performance reviews and OKRs to reflect the new reality.
  • Train leads on how to review AI-assisted code effectively.

Case-study style examples and scenarios

Example 1: Mid-size SaaS company gains visibility

A 150-person SaaS company adopted Cursor and GitHub Copilot across their engineering org in Q3 2025, paired with Typo for workflow analytics.

Within two months, they saw (DORA metrics) lead time drop by 23% for feature work. But Typo’s dashboards revealed something unexpected: modules with the heaviest AI assistance showed 40% higher bug rates in the first release cycle.

The response wasn’t to reduce AI usage—it was to adjust process. They implemented mandatory thorough testing gates for AI-heavy changes and added architect mode reviews for core infrastructure. By Q1 2026, the bug rate differential had disappeared while lead time improvements held, highlighting the importance of tracking key DevOps metrics to monitor improvements and maintain high software quality.

Example 2: Cloud-native team balances multi-cloud complexity

A platform team managing AWS and GCP infrastructure used Gemini Code Assist for GCP work and Amazon Q Developer for AWS. They added Gemini CLI for repo-wide infrastructure-as-code changes.

Typo surfaced a problem: code reviews for infrastructure changes were taking 3x longer than application code, creating bottlenecks. The data showed that two senior engineers were reviewing 80% of infra PRs.

Using Typo’s insights, they rebalanced ownership, created review guidelines specific to AI-generated infrastructure code, and trained three additional engineers on infra review. Review times dropped to acceptable levels within six weeks.

Example 3: Platform team enforces standards in polyglot monorepo

An enterprise platform team introduced Qodo as a code review agent for their polyglot monorepo spanning Python, TypeScript, and Go. The goal: consistent standards across languages without burning out senior reviewers.

Typo data showed where auto-fixes reduced reviewer load most significantly: Python code formatting and TypeScript type issues saw 60% reduction in review comments. Go code, with stricter compiler checks, showed less impact.

The team adjusted their approach—using AI review agents heavily for Python and TypeScript, with more human focus on Go architecture decisions. Coding efficiency improved across all languages while maintaining high quality code standards.

A team of developers collaborates in a modern office, reviewing code together on large screens, utilizing advanced AI coding tools for real-time code suggestions and code optimization. The environment fosters effective code reviews and enhances coding efficiency through the use of AI-powered coding assistance and collaboration on complex code snippets.

Future trends: multi-agent systems, AI-native IDEs, and developer experience

Looking ahead from 2026 into 2027 and beyond, several trends are reshaping developer tooling.

Multi-agent systems are moving from experimental to mainstream. Instead of a single AI assistant, teams deploy coordinated agents: a code generation agent, a test agent, a security agent, and a documentation agent working together via frameworks like MCP (Model Context Protocol). Tools like Qodo and Gemini Code Assist are already implementing early versions of this architecture.

AI-native IDEs continue evolving. Cursor and Windsurf blur boundaries between editor, terminal, documentation, tickets, and CI feedback. JetBrains and Apple’s Xcode 17 now include deeply integrated AI assistants with direct access to platform-specific context.

As agents gain autonomy, productivity platforms like Typo become more critical as the “control tower.” When an AI agent makes changes across fifty files, someone needs to track what changed, which teams were affected, and how reliability shifted. Human oversight doesn’t disappear—it elevates to system level.

Skills developers should invest in:

  • Systems thinking: understanding how changes propagate through complex systems.
  • Prompt and agent orchestration: directing AI tools effectively.
  • Reading AI-generated code with a reviewer’s mindset: faster pattern recognition for AI-typical mistakes.
  • Cursor rules and similar configuration for customizing AI behavior.

The best teams treat AI and productivity tooling as one cohesive developer experience strategy, not isolated gadgets added to existing workflows.

Conclusion & recommended next steps

Generative AI is now table stakes for software development. The best AI tools are embedded in every major IDE, and developers who ignore them are leaving significant coding efficiency gains on the table. But impact depends entirely on how AI is integrated, governed, and measured.

For individual developers, AI assistants provide real leverage—faster implementations, better code understanding, and fewer repetitive tasks. For senior engineering leaders, the equation is more complex: pair AI coding tools with productivity and quality platforms like Typo to keep the codebase and processes healthy as velocity increases.

Your action list for the next 90 days:

  1. Pick 1-2 AI coding tools to pilot: Start with GitHub Copilot or Cursor if you haven’t already. Add a terminal agent like Aider for repo-wide tasks.
  2. Baseline team metrics: Use a platform like Typo to measure lead time, review duration, and defect rates before and after AI adoption.
  3. Define lightweight policies: Establish which tools are sanctioned, what review is required for AI-heavy changes, and how to track AI involvement.
  4. Schedule a 90-day review: Assess what’s working, what needs adjustment, and whether broader rollout makes sense.

Think of this as a continuous improvement loop: experiment, measure, adjust tools and policies, repeat. This isn’t a one-time “AI adoption” project—it’s an ongoing evolution of how your team works.

Teams who learn to coordinate generative AI, human expertise, and developer productivity tooling will ship faster, safer, and with more sustainable engineering cultures. The tools are ready. The question is whether your processes will keep pace.

Additional resources for AI coding

If you’re eager to expand your AI coding skills, there’s a wealth of resources and communities to help you get the most out of the best AI tools. Online forums like the r/ChatGPTCoding subreddit are excellent places to discuss the latest AI coding tools, share code snippets, and get advice on using large language models like Claude Sonnet and OpenRouter for various programming tasks.

Many AI tools offer comprehensive tutorials and guides covering everything from code optimization and error detection to best practices for code sharing and collaboration. These resources can help you unlock advanced features, troubleshoot issues, and discover new techniques to improve your development workflow.

Additionally, official documentation and developer blogs from leading AI coding tool providers such as GitHub Copilot, Qodo, and Gemini Code Assist provide valuable insights into effective usage and integration with popular IDEs like Visual Studio Code and JetBrains. Participating in webinars, online courses, and workshops can also accelerate your learning curve and keep you updated on the latest advancements in generative AI for developers.

Finally, joining AI-focused developer communities and attending conferences or meetups dedicated to AI-powered development can connect you with peers and experts, fostering collaboration and knowledge sharing. Embracing these resources will empower you to harness the full potential of AI coding assistants and stay ahead in the rapidly evolving software development landscape.

Top AI Coding Assistants

Top AI Coding Assistants to Boost Your Development Efficiency in 2026

TLDR

AI coding assistants have evolved beyond simple code completion into comprehensive development partners that understand project context, enforce coding standards, and automate complex workflows across the entire development stack. Modern AI coding assistants are transforming software development by increasing productivity and code quality for developers, engineering leaders, and teams. These tools integrate with Git, IDEs, CI/CD pipelines, and code review processes to provide end-to-end development assistance that transforms how teams build software.

Enterprise-grade AI coding assistants now handle multiple files simultaneously, performing security scanning, test generation, and compliance enforcement while maintaining strict code privacy through local models and on-premises deployment options. The 2026 landscape features specialized AI agents for different tasks: code generation, automated code review, documentation synthesis, debugging assistance, and deployment automation.

This guide covers evaluation, implementation, and selection of AI coding assistants in 2026. Whether you’re evaluating GitHub Copilot, Amazon Q Developer, or open-source alternatives, the framework here will help engineering leaders make informed decisions about tools that deliver measurable improvements in developer productivity and code quality.

Understanding AI Coding Assistants

AI coding assistants are intelligent development tools that use machine learning and large language models to enhance programmer productivity across various programming tasks. Unlike traditional autocomplete or static analysis tools that relied on hard-coded rules, these AI-powered systems generate novel code and explanations using probabilistic models trained on massive code repositories and natural language documentation.

Popular AI coding assistants boost efficiency by providing real-time code completion, generating boilerplate and tests, explaining code, refactoring, finding bugs, and automating documentation. AI assistants improve developer productivity by addressing various stages of the software development lifecycle, including debugging, code formatting, code review, and test coverage.

These tools integrate into existing development workflows through IDE plugins, terminal interfaces, command line utilities, and web-based platforms. A developer working in Visual Studio Code or any modern code editor can receive real-time code suggestions that understand not just syntax but semantic intent, project architecture, and team conventions.

The evolution from basic autocomplete to context-aware coding partners represents a fundamental shift in software development. Early tools like traditional IntelliSense could only surface existing symbols and method names. Today’s AI coding assistants generate entire functions, suggest bug fixes, write documentation, and refactor code across multiple files while maintaining consistency with your coding style.

AI coding assistants function as augmentation tools that amplify developer capabilities rather than replace human expertise. They handle repetitive tasks, accelerate learning of new frameworks, and reduce the cognitive load of routine development work, allowing engineers to focus on architecture, complex logic, and creative problem-solving that requires human judgment.

What Are AI Coding Assistants?

AI coding assistants are tools that boost efficiency by providing real-time code completion, generating boilerplate and tests, explaining code, refactoring, finding bugs, and automating documentation. These intelligent development tools are powered by large language models trained on vast code repositories encompassing billions of lines across every major programming language. These systems understand natural language prompts and code context to provide accurate code suggestions that match your intent, project requirements, and organizational standards.

Core capabilities span the entire development process:

  • Code completion and generation: From single-line suggestions to generating complete functions based on comments or natural language descriptions
  • Code refactoring: Restructuring existing code for readability, performance, or design pattern compliance without changing behavior
  • Debugging assistance: Analyzing error messages, stack traces, and code context to suggest bug fixes and explain root causes
  • Documentation creation: Generating docstrings, API documentation, README files, and inline comments from code analysis
  • Test automation: Creating unit tests, integration tests, and test scaffolds based on function signatures and behavior

Different types serve different needs. Inline completion tools like Tabnine provide AI-powered code completion as you type. Conversational coding agents offer chat interface interactions for complex questions. Autonomous development assistants like Devin can complete multi-step tasks independently. Specialized platforms focus on security analysis, code review, or documentation.

Modern AI coding assistants understand project context including file relationships, dependency structures, imported libraries, and architectural patterns. They learn from your codebase to provide relevant suggestions that align with existing conventions rather than generic code snippets that require extensive modification.

Integration points extend throughout the development environment—from version control systems and pull request workflows to CI/CD pipelines and deployment automation. This comprehensive integration transforms AI coding from just a plugin into an embedded development partner.

Key Benefits of AI Coding Assistants for Development Teams

Accelerated Development Velocity

  • AI coding assistants reduce time spent on repetitive coding tasks significantly.
  • Industry measurements show approximately 30% reduction in hands-on coding time, with even higher gains for writing automated tests.
  • Developers can generate code for boilerplate patterns, CRUD operations, API handlers, and configuration files in seconds rather than minutes.

Improved Code Quality

  • Automated code review, best practice suggestions, and consistent style enforcement improve high quality code output across team members.
  • AI assistants embed patterns learned from millions of successful projects, surfacing potential issues before they reach production.
  • Error detection and code optimization suggestions help prevent bugs during development rather than discovery in testing.

Enhanced Learning and Knowledge Transfer

  • Contextual explanations, documentation generation, and coding pattern recommendations accelerate skill development.
  • Junior developers can understand unfamiliar codebases quickly through AI-driven explanations.
  • Teams adopting new languages or frameworks reduce ramp-up time substantially when AI assistance provides idiomatic examples and explains conventions.

Reduced Cognitive Load

  • Handling routine tasks like boilerplate code generation, test creation, and documentation updates frees mental bandwidth for complex problem-solving.
  • Developers maintain flow state longer when the AI assistant handles context switching between writing code and looking up API documentation or syntax.

Better Debugging and Troubleshooting

  • AI-powered error analysis provides solution suggestions based on codebase context rather than generic stack overflow answers.
  • The assistant understands your specific error handling patterns, project dependencies, and coding standards to suggest fixes that integrate cleanly with existing code.

Why AI Coding Assistants Matter in 2026

The complexity of modern software development has increased exponentially. Microservices architectures, cloud-native deployments, and rapid release cycles demand more from smaller teams. AI coding assistants address this complexity gap by providing intelligent automation that scales with project demands.

The demand for faster feature delivery while maintaining high code quality and security standards creates pressure that traditional development approaches cannot sustain. AI coding tools enable teams to ship more frequently without sacrificing reliability by automating quality checks, test generation, and security scanning throughout the development process.

Programming languages, frameworks, and best practices evolve continuously. AI assistants help teams adapt to emerging technologies without extensive training overhead. A developer proficient in Python code can generate functional code in unfamiliar languages guided by AI suggestions that demonstrate correct patterns and idioms.

Smaller teams now handle larger codebases and more complex projects through intelligent automation. What previously required specialized expertise in testing, documentation, or security becomes accessible through AI capabilities that encode this knowledge into actionable suggestions.

Competitive advantage in talent acquisition and retention increasingly depends on developer experience. Organizations offering cutting-edge AI tools attract engineers who value productivity and prefer modern development environments over legacy toolchains that waste time on mechanical tasks.

Essential Criteria for Evaluating AI Coding Assistants

Create a weighted scoring framework covering these dimensions:

  • Accuracy and Relevance
    • Quality of code suggestions across your primary programming language
    • Accuracy of generated code with minimal modification required
    • Relevance of suggestions to actual intent rather than syntactically valid but wrong solutions
  • Context Understanding
    • Codebase awareness across multiple files and dependencies
    • Project structure comprehension including architectural patterns
    • Ability to maintain consistency with existing coding style
  • Integration Capabilities
    • Compatibility with your code editor and development environment
    • Version control and pull request workflow integration
    • CI/CD pipeline connection points
  • Security Features
    • Data privacy practices and code handling policies
    • Local execution options through local models
    • Compliance certifications (SOC 2, GDPR, ISO 27001)
  • Enterprise Controls
    • User management and team administration
    • Usage monitoring and policy enforcement
    • Audit logging and compliance reporting

Weight these categories based on organizational context. Regulated industries prioritize security and compliance. Startups may favor rapid integration and free tier availability. Distributed teams emphasize collaboration features.

How Modern AI Coding Assistants Differ: Competitive Landscape Overview

The AI coding market has matured with distinct approaches serving different needs.

Closed-source enterprise solutions offer comprehensive features, dedicated support, and enterprise controls but require trust in vendor data practices and create dependency on external services. Open-source alternatives provide customization, local deployment options, and cost control at the expense of turnkey experience and ongoing maintenance burden.

Major platforms differ in focus:

  • GitHub Copilot: Ecosystem integration, widespread adoption, comprehensive language support, deep IDE integration across Visual Studio Code and JetBrains
  • Amazon Q Developer: AWS-centric development with cloud service integration and enterprise controls for organizations invested in Amazon infrastructure
  • Google Gemini Code Assist: Large context windows, citation features, Google Cloud integration
  • Tabnine: Privacy-focused enterprise deployment with on-premises options and custom model training
  • Claude Code: Conversational AI coding assistant with strong planning capabilities, supporting project planning, code generation, and documentation via natural language interaction and integration with GitHub repositories and command line workflows
  • Cursor: AI-first code editor built on VS Code offering an agent mode that supports goal-oriented multi-file editing and code generation, deep integration with the VS Code environment, and iterative code refinement and testing capabilities

Common gaps persist across current tools:

  • Limited context windows restricting understanding of large codebases
  • Poor comprehension of legacy codebases with outdated patterns
  • Inadequate security scanning that misses nuanced vulnerabilities
  • Weak integration with enterprise workflows beyond basic IDE support
  • Insufficient code understanding for complex refactoring across the entire development stack

Pricing models range from free plan tiers for individual developers to enterprise licenses with usage-based billing. The free version of most tools provides sufficient capability for evaluation but limits advanced AI capabilities and team features.

Integration with Development Tools and Workflows

Seamless integration with development infrastructure determines real-world productivity impact.

IDE Integration

Evaluate support for your primary code editor whether Visual Studio Code, JetBrains suite, Vim, Neovim, or cloud-based editors. Look for IDEs that support AI code review solutions to streamline your workflow:

  • Native VS Code extension quality and responsiveness
  • Feature parity across different editors
  • Configuration synchronization between environments

Version Control Integration

Modern assistants integrate with Git workflows to:

  • Generate commit message descriptions from diffs
  • Assist pull request creation and description
  • Provide automated code review comments
  • Suggest reviewers based on code ownership

CI/CD Pipeline Connection

End-to-end development automation requires:

  • Test generation triggered by code changes
  • Security scanning within build pipelines
  • Documentation updates synchronized with releases
  • Deployment preparation and validation assistance

API and Webhook Support

Custom integrations enable:

  • Workflow automation beyond standard features
  • Connection with internal tools and platforms
  • Custom reporting and analytics
  • Integration with project management systems

Setup complexity varies significantly. Some tools require minimal configuration while others demand substantial infrastructure investment. Evaluate maintenance overhead against feature benefits.

Real-Time Code Assistance and Context Awareness

Real-time code suggestions transform development flow by providing intelligent recommendations as you type rather than requiring explicit queries.

Immediate Completion

As developers write code, AI-powered code completion suggests:

  • Variable names based on context and naming conventions
  • Method calls with appropriate parameters
  • Complete code snippets for common patterns
  • Entire functions matching described intent

Project-Wide Context

Advanced contextual awareness includes:

  • Understanding relationships between files in the project
  • Dependency analysis and import suggestion
  • Architectural pattern recognition
  • Framework-specific conventions and idioms

Team Pattern Learning

The best AI coding tools learn from:

  • Organizational coding standards and style guides
  • Historical code patterns in the repository
  • Peer review feedback and corrections
  • Custom rule configurations

Multi-File Operations

Complex development requires understanding across multiple files:

  • Refactoring that updates all call sites
  • Cross-reference analysis for impact assessment
  • Consistent naming and structure across modules
  • API changes propagated to consumers

Context window sizes directly affect suggestion quality. Larger windows enable understanding of more project context but may increase latency. Retrieval-augmented generation techniques allow assistants to index entire codebases while maintaining responsiveness.

AI-Powered Code Review and Quality Assurance

Automated code review capabilities extend quality assurance throughout the development process rather than concentrating it at pull request time.

Style and Consistency Checking

AI assistants identify deviations from:

  • Organizational coding standards
  • Language idiom best practices
  • Project-specific conventions
  • Consistent error handling patterns

Security Vulnerability Detection

Proactive scanning identifies:

  • Common vulnerability patterns (injection, authentication flaws)
  • Insecure configurations
  • Sensitive data exposure risks
  • Dependency vulnerabilities

Hybrid AI approaches combining large language models with symbolic analysis achieve approximately 80% success rate for automatically generated security fixes that don’t introduce new issues.

Performance Optimization

Code optimization suggestions address:

  • Algorithmic inefficiencies
  • Resource usage patterns
  • Caching opportunities
  • Unnecessary complexity

Test Generation and Coverage

AI-driven test creation includes:

  • Unit test generation from function signatures
  • Integration test scaffolding
  • Coverage gap identification
  • Regression prevention through comprehensive test suites

Compliance Checking

Enterprise environments require:

  • Industry standard adherence (PCI-DSS, HIPAA)
  • Organizational policy enforcement
  • License compliance verification
  • Documentation requirements

Customizable Interfaces and Team Collaboration

Developer preferences and team dynamics require flexible configuration options.

Individual Customization

  • Suggestion verbosity controls (more concise vs more complete)
  • Keyboard shortcut configuration
  • Inline vs sidebar interface preferences
  • Language and framework prioritization

For more options and insights, explore developer experience tools.

Team Collaboration Features

Shared resources improve consistency:

  • Organizational code snippets libraries
  • Custom prompt templates for common tasks
  • Standardized code generation patterns
  • Knowledge bases encoding architectural decisions

Administrative Controls

Team leads require:

  • Usage monitoring and productivity analytics
  • Policy enforcement for acceptable use
  • Configuration management across team members
  • Cost tracking and budget controls

Permission Systems

Sensitive codebases need:

  • Repository-level access controls
  • Feature restrictions for different user roles
  • Audit trails for AI interactions
  • Data isolation between projects

Onboarding Support

Adoption acceleration through:

  • Progressive disclosure of advanced features
  • Interactive tutorials and guided experiences
  • Best practice documentation
  • Community support resources

Advanced AI Capabilities and Autonomous Features

The frontier of AI coding assistants extends beyond suggestion into autonomous action, raising important questions about how to measure their impact on developer productivity—an area addressed by the SPACE Framework.

Autonomous Coding Agents

Next-generation AI agents can:

  • Complete entire features from specifications
  • Implement bug fixes across multiple files
  • Handle complex development tasks independently
  • Execute multi-step plans with human checkpoints

Natural Language Programming

Natural language prompts enable:

  • Describing requirements in plain English
  • Generating working code from descriptions
  • Iterating through conversational refinement
  • Prototyping full stack apps from concepts

This “vibe coding” approach allows working prototypes from early-stage ideas within hours, enabling rapid experimentation.

Multi-Agent Systems

Specialized agents coordinate:

AI agents are increasingly integrated into CI/CD tools to streamline various aspects of the development pipeline:

  • Code generation agents for implementation
  • Testing agents for quality assurance
  • Documentation agents for technical writing
  • Security agents for vulnerability prevention

Predictive Capabilities

Advanced AI capabilities anticipate:

  • Common errors before they occur
  • Optimization opportunities
  • Dependency update requirements
  • Performance bottlenecks

Emerging Features

The cutting edge of developer productivity includes:

  • Automatic dependency updates with compatibility verification
  • Security patch applications with regression testing
  • Performance optimization with benchmarking
  • Terminal commands generation for DevOps tasks

Security, Privacy, and Enterprise Controls

Enterprise adoption demands rigorous security posture, as well as a focus on boosting engineering team efficiency with DORA metrics.

Data Privacy Concerns

Critical questions include:

  • What code is transmitted to cloud services?
  • How is code used in model training?
  • What data retention policies apply?
  • Who can access code analysis results?

Security Features

Essential capabilities:

  • Code vulnerability scanning integrated in development
  • License compliance checking for dependencies
  • Sensitive data detection (API keys, credentials)
  • Secure coding pattern enforcement powered by AI

Deployment Options

Organizations choose based on risk tolerance:

  • Cloud-hosted services with encryption and access controls
  • Virtual private cloud deployments with data isolation
  • On-premises installations for maximum control
  • Local models running entirely on developer machines

Enterprise Controls

Administrative requirements:

  • Single sign-on and identity management
  • Role-based access controls
  • Comprehensive audit logging
  • Usage analytics and reporting

Compliance Standards

Verify certifications:

  • SOC 2 Type II for service organization controls
  • ISO 27001 for information security management
  • GDPR compliance for European operations
  • Industry-specific requirements (HIPAA, PCI-DSS)

How to Align AI Coding Assistant Selection with Team Goals

Structured selection processes maximize adoption success and ROI.

Map Pain Points to Capabilities

Identify specific challenges:

  • Productivity bottlenecks in repetitive tasks
  • Code quality issues requiring automated detection
  • Skill gaps in specific languages or frameworks
  • Documentation debt accumulating over time

Technology Stack Alignment

Evaluate support for:

  • Primary programming languages used by the team
  • Frameworks and libraries in active use
  • Development methodologies (agile, DevOps)
  • Existing toolchain and workflow integration

Team Considerations

Factor in:

  • Team size affecting licensing costs and administration overhead
  • Experience levels influencing training requirements
  • Growth plans requiring scalable pricing models
  • Remote work patterns affecting collaboration features

Business Objectives Connection

Link tool selection to outcomes:

  • Faster time-to-market through accelerated development
  • Reduced development costs via productivity gains
  • Improved software quality through automated checking
  • Enhanced developer experience for retention

Success Metrics Definition

Establish before implementation:

  • Baseline measurements for comparison
  • Target improvements to demonstrate value
  • Evaluation timeline for assessment
  • Decision criteria for expansion or replacement

Measuring Impact: Metrics That Matter for Development Teams

Track metrics that demonstrate value and guide optimization.

Development Velocity

Measure throughput improvements:

  • Features completed per sprint
  • Time from commit to deployment
  • Cycle time for different work types
  • Lead time reduction for changes

Code Quality Indicators

Monitor quality improvements:

  • Bug rates in production
  • Security vulnerabilities detected pre-release
  • Test coverage percentages
  • Technical debt measurements

Developer Experience

Assess human impact:

  • Developer satisfaction surveys
  • Tool adoption rates across team
  • Self-reported productivity assessments
  • Retention and recruitment metrics

Cost Analysis

Quantify financial impact:

  • Development time savings per feature
  • Reduced review cycle duration
  • Decreased debugging effort
  • Avoided defect remediation costs

Industry Benchmarks

Compare against standards:

  • Deployment frequency (high performers: multiple daily)
  • Lead time for changes (high performers: under one day)
  • Change failure rate (high performers: 0-15%)
  • Mean time to recovery (high performers: under one hour)

Measure AI Coding Adoption and Impact Analysis with Typo

Typo offers comprehensive AI coding adoption and impact analysis tools designed to help organizations understand and maximize the benefits of AI coding assistants. By tracking usage patterns, developer interactions, and productivity metrics, Typo provides actionable insights into how AI tools are integrated within development teams.

With Typo, engineering leaders gain deep insights into Git metrics that matter most for development velocity and quality. The platform tracks DORA metrics such as deployment frequency, lead time for changes, change failure rate, and mean time to recovery, enabling teams to benchmark performance over time and identify areas for improvement.

Typo also analyzes pull request (PR) characteristics, including PR size, review time, and merge frequency, providing a clear picture of development throughput and bottlenecks. By comparing AI-assisted PRs against non-AI PRs, Typo highlights the impact of AI coding assistants on velocity, code quality, and overall team productivity.

This comparison reveals trends such as reduced PR sizes, faster review cycles, and lower defect rates in AI-supported workflows. Typo’s data-driven approach empowers engineering leaders to quantify the benefits of AI coding assistants, optimize adoption strategies, and make informed decisions that accelerate software delivery while maintaining high code quality standards.

Key Performance Indicators Specific to AI Coding Assistants

Beyond standard development metrics, AI-specific measurements reveal tool effectiveness.

  • Suggestion Acceptance Rates: Track how often developers accept AI recommendations:
    • Overall acceptance percentage
    • Acceptance by code type (boilerplate vs complex logic)
    • Modification frequency before acceptance
    • Rejection patterns indicating quality issues
  • Time Saved on Routine Tasks: Measure automation impact:
    • Boilerplate generation time reduction
    • Documentation writing acceleration
    • Test creation speed improvements
    • Code review preparation efficiency
  • Error Reduction Rates: Quantify prevention value:
    • Bugs caught during development vs testing
    • Security issues prevented pre-commit
    • Performance problems identified early
    • Compliance violations avoided
  • Learning Acceleration: Track knowledge transfer:
    • Time to productivity in new languages
    • Framework adoption speed
    • Onboarding duration for new team members
    • Cross-functional capability development
  • Code Consistency Improvements: Measure standardization:
    • Style conformance across team
    • Pattern consistency in similar implementations
    • Naming convention adherence
    • Error handling uniformity
  • Context Switching Reduction: Assess flow state preservation:
    • Time spent searching documentation
    • Frequency of leaving editor for information
    • Interruption recovery time
    • Continuous coding session duration

Implementation Considerations and Best Practices

Successful deployment requires deliberate planning and change management.

Phased Rollout Strategy

  1. Pilot phase (2-4 weeks): Small team evaluation with intensive feedback collection
  2. Team expansion (1-2 months): Broader adoption with refined configuration
  3. Full deployment (3-6 months): Organization-wide rollout with established practices

Coding Standards Integration

Establish policies for:

  • AI usage guidelines and expectations
  • Review requirements for AI-generated code
  • Attribution and documentation practices
  • Quality gates for AI-assisted contributions

Training and Support

Enable effective adoption:

  • Initial training on capabilities and limitations
  • Best practice documentation for effective prompting
  • Regular tips and technique sharing
  • Power users mentoring less experienced team members

Monitoring and Optimization

Continuous improvement requires:

  • Usage pattern analysis for optimization
  • Issue identification and resolution processes
  • Configuration refinement based on feedback
  • Feature adoption tracking and encouragement

Realistic Timeline Expectations

Plan for:

  • Initial analytics and workflow improvements within weeks
  • Significant productivity gains in 2-3 months
  • Broader ROI and cultural integration over 6 months
  • Continuous optimization as capabilities evolve

What a Complete AI Coding Assistant Should Provide

Before evaluating vendors, establish clear expectations for complete capability.

  • Comprehensive Code Generation
    • Multi-language support covering your technology stack
    • Framework-aware generation with idiomatic patterns
    • Scalable from code snippets to entire functions
    • Customizable to organizational standards
  • Intelligent Code Completion
    • Real-time suggestions with minimal latency
    • Deep project context understanding
    • Own code pattern learning and application
    • Accurate prediction of developer intent
  • Automated Quality Assurance
    • Test generation for unit and integration testing
    • Coverage analysis and gap identification
    • Vulnerability scanning with remediation suggestions
    • Performance optimization recommendations
  • Documentation Assistance
    • Automatic comment and docstring generation
    • API documentation creation and maintenance
    • Technical writing support for architecture docs
    • Changelog and commit message generation
  • Debugging Support
    • Error analysis with root cause identification
    • Solution suggestions based on codebase context
    • Performance troubleshooting assistance
    • Regression investigation support
  • Collaboration Features
    • Team knowledge sharing and code sharing
    • Automated code review integration
    • Consistent pattern enforcement
    • Built-in support for pair programming workflows
  • Enterprise Security
    • Privacy protection with data controls
    • Access management and permissions
    • Compliance reporting and audit trails
    • Deployment flexibility including local options

Leading AI Coding Assistant Platforms: Feature Comparison

Platform Strengths / Advantages Considerations
GitHub Copilot Deep integration across major IDEs
Comprehensive programming language coverage
Large user community and extensive documentation
Continuous improvement from Microsoft/OpenAI investment
Natural language interaction through Copilot Chat
Cloud-only processing raises privacy concerns
Enterprise pricing at scale
Dependency on GitHub ecosystem
Amazon Q Developer Native AWS service integration
Enterprise security and access controls
Code transformation for modernization projects
Built-in compliance features
Best value within AWS ecosystem
Newer platform with evolving capabilities
Google Gemini Code Assist Large context window for extensive codebase understanding
Citation features for code provenance
Google Cloud integration
Strong multi-modal capabilities
Enterprise focus with pricing reflecting that
Integration maturity with non-Google tools
Open-Source Alternatives (Continue.dev, Cline) Full customization and transparency
Local model support for privacy
No vendor lock-in
Community support and contribution
Maintenance overhead
Feature gaps compared to commercial options
Support limited to community resources
Tabnine On-premises deployment options
Custom model training on proprietary code
Strong privacy controls
Flexible deployment models
Smaller ecosystem than major platforms
Training custom models requires investment
Cursor AI-first code editor with integrated agent mode
Supports goal-oriented multi-file editing and code generation
Deep integration with VS Code environment
Iterative code refinement and testing capabilities
Subscription-based with focus on power users<

How to Evaluate AI Coding Assistants During Trial Periods

Structured evaluation reveals capabilities that marketing materials don’t.

  • Code Suggestion Accuracy
    • Test with real projects
    • Generate code for actual current work
    • Evaluate modification required before use
    • Compare across different programming tasks
    • Assess consistency over extended use
  • Integration Quality
    • Test with your actual development environment
    • Evaluate responsiveness and performance impact
    • Check configuration synchronization
    • Validate CI/CD pipeline connections
  • Context Understanding
    • Challenge with complexity
    • Multi-file refactoring across dependencies
    • Complex code generation requiring project knowledge
    • Legacy code understanding and modernization
    • Cross-reference accuracy in suggestions
  • Learning Curve Assessment
    • Gather developer feedback
    • Time to productive use
    • Intuitive vs confusing interactions
    • Documentation quality and availability
    • Support responsiveness for issues
  • Security Validation
    • Verify claims
    • Data handling transparency
    • Access control effectiveness
    • Compliance capability verification
    • Audit logging completeness
  • Performance Analysis
    • Measure resource impact
    • IDE responsiveness with assistant active
    • Memory and CPU consumption
    • Network bandwidth requirements
    • Battery impact for mobile development

Frequently Asked Questions

What programming languages and frameworks do AI coding assistants support best?
Most major AI coding assistants excel with popular languages including Python, JavaScript, TypeScript, Java, C++, Go, and Rust. Support quality typically correlates with language prevalence in training data. Frameworks like React, Django, Spring, and Node.js receive strong support. Niche or proprietary languages may have limited assistance quality.

How do AI coding assistants protect sensitive code and intellectual property?
Protection approaches vary by vendor. Options include encryption in transit and at rest, data retention limits, opt-out from model training, on-premises deployment, and local models that process code without network transmission. Evaluate specific vendor policies against your security requirements.

Can AI coding assistants work with legacy codebases and older programming languages?
Effectiveness with legacy code depends on training data coverage. Common older languages like COBOL, Fortran, or older Java versions receive reasonable support. Proprietary legacy systems may have limited assistance. Modern assistants can help translate and modernize legacy code when provided sufficient context.

What is the learning curve for developers adopting AI coding assistance tools?
Most developers become productive within hours to days. Basic code completion requires minimal learning. Advanced features like natural language prompts for complex generation, multi-file operations, and workflow integration may take weeks to master. Organizations typically see full adoption benefits within 2-3 months.

How do AI coding assistants handle team coding standards and organizational policies?
Configuration options include custom prompts encoding standards, rule definitions, and training on organizational codebases. Enterprise platforms offer policy enforcement, style checking, and pattern libraries. Effectiveness depends on configuration investment and assistant capability depth.

What are the costs associated with implementing AI coding assistants across development teams?
Pricing ranges from free tier options for individuals to enterprise licenses at $20-50+ per developer monthly. Usage-based models charge by suggestions or compute. Consider total cost including administration, training, and productivity impact rather than subscription cost alone.

How do AI coding assistants integrate with existing code review and quality assurance processes?
Integration typically includes pull request commenting, automated review suggestions, and CI pipeline hooks. Assistants can pre-check code before submission, suggest improvements during review, and automate routine review tasks. Integration depth varies by platform and toolchain.

Can AI coding assistants work offline or do they require constant internet connectivity?
Most cloud-based assistants require internet connectivity. Some platforms offer local models that run entirely offline with reduced capability. On-premises enterprise deployments can operate within internal networks. Evaluate connectivity requirements against your development environment constraints.

What metrics should teams track to measure the success of AI coding assistant implementation?
Key metrics include suggestion acceptance rates, time saved on routine tasks, code quality improvements (bug rates, test coverage), developer satisfaction scores, and velocity improvements. Establish baselines before implementation and track trends over 3-6 months for meaningful assessment.

How do AI coding assistants compare to traditional development tools and manual coding practices?
AI assistants complement rather than replace traditional tools. They excel at generating boilerplate, suggesting implementations, and accelerating routine work. Complex architectural decisions, novel algorithm design, and critical system code still require human expertise. Best results come from AI pair programming where developers guide and review AI contributions.

ai coding impact

AI Coding: Impact, Metrics, and Best Practices

AI-assisted coding is revolutionizing the software development landscape, and understanding how to use these tools effectively is now essential for engineering leaders, software developers, and technical decision-makers. This comprehensive guide covers actionable best practices, the impact of AI coding tools, and the key metrics for measuring their effectiveness. As AI coding tools become mainstream and critical for engineering excellence, it is vital to understand not only how to leverage them for productivity but also how to maintain code quality, security, and team expertise.

Scope: This article explores AI coding tools best practices, their impact on software engineering, and the essential metrics for tracking their effectiveness.
Target Audience: Engineering leaders, software developers, and technical decision-makers.
Why It Matters: AI coding tools are now mainstream, and their effective use is critical for maintaining engineering excellence and a competitive edge.

Note: AI-assisted coding requires a basic knowledge of software engineering best practices and core AI concepts. Readers should be familiar with foundational development workflows to maximize the benefits of AI tools.

What Are AI Coding Tools?

AI coding tools are software applications that can produce code from natural language descriptions or existing codebases. These tools leverage artificial intelligence, including large language models and machine learning algorithms, to generate, auto-complete, and review code. They are designed to enhance developer productivity, automate repetitive tasks, and provide intelligent suggestions within the context of your project.

Effective use of AI coding tools requires treating them as pair programming assistants, not as replacements for human judgment. Human oversight remains essential for ensuring code quality, security, and alignment with business requirements.

AI Coding Tools Best Practices

To maximize the benefits and minimize the risks of AI coding tools, follow these actionable best practices:

  • Never copy-paste AI code blindly. Always perform manual line-by-line reviews to check for logical flaws and security vulnerabilities.
  • Always manually verify and test AI-generated code for security, logic, and efficiency before integrating it into your codebase.
  • Use AI coding tools for repetitive tasks, generating boilerplate code, unit tests, or documentation. Let AI handle routine work so you can focus on complex problem-solving.
  • Provide detailed, small-scope prompts with clear requirements to AI. The more specific and detailed your prompts, the better the code the AI will produce.
  • Never input sensitive data into public AI models. Use secure environments for sensitive work and never allow AI to handle API keys or confidential information directly.
  • Clearly disclose AI usage in commit messages and pull request documentation to maintain team transparency and accountability.
  • Implement strict review standards for AI-generated code, treating it as untrusted until thoroughly reviewed.
  • Break complex tasks into smaller, manageable components to improve AI accuracy and reduce errors.
  • Engage in a back-and-forth flow with AI, asking for explanations and refining prompts as needed.
  • Leverage AI-native IDEs and tools that provide real-time context and autocomplete for more effective integration.
  • Establish project-specific rules in your IDE to ensure consistent styling and patterns across AI sessions.
  • Commit code more frequently when using AI tools to allow for quick reversals if needed.
  • Maintain a human-in-the-loop approach for code reviews and critical decision points.
  • Document the codebase and context early to help AI tools generate higher-quality output.
  • Plan your project and codebase before using AI tools to maintain control and improve maintainability.
  • Provide comprehensive training on AI tools to maximize their effectiveness and developer productivity.
  • Continuously learn and adapt your workflows to keep pace with evolving AI capabilities and best practices.

By following these best practices, teams can harness the power of AI coding tools while maintaining high standards for code quality, security, and collaboration.

Introduction to AI Coding

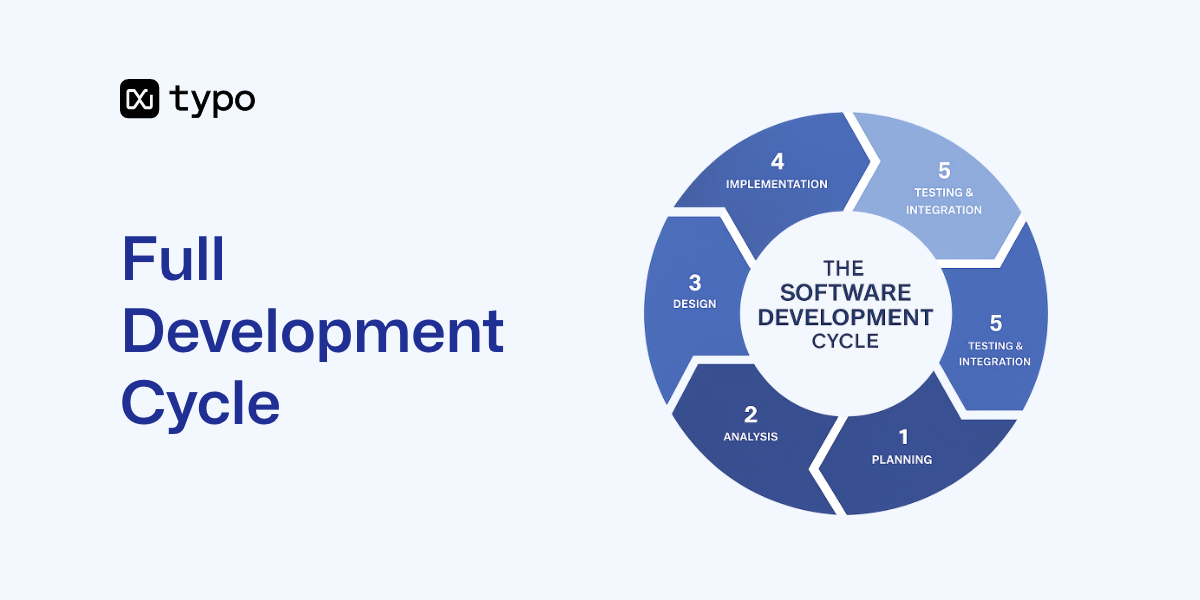
AI-driven coding is fundamentally transforming the Software Development Life Cycle (SDLC) by leveraging sophisticated artificial intelligence algorithms and machine learning models to assist developers across comprehensive development workflows. Contemporary AI-powered development tools, including intelligent coding assistants and AI-enhanced code completion systems, are meticulously engineered to streamline complex coding tasks, deliver context-aware code suggestions, and automate resource-intensive repetitive processes.

By integrating these advanced AI-driven solutions into established development methodologies, engineering teams can substantially amplify coding efficiency, minimize error-prone implementations, and elevate overall code quality standards through automated best practices enforcement and real-time vulnerability detection.

As organizational demand for rapid deployment cycles and robust software architecture intensifies, AI-powered coding methodologies have become indispensable for modern development operations. These sophisticated tools enable developers to concentrate on complex problem-solving initiatives and scalable architectural decisions, while routine code generation, automated testing, and bug remediation processes are seamlessly handled by machine learning algorithms.

The outcome is a dramatically optimized development pipeline, where high-quality, production-ready code is generated with enhanced velocity and superior accuracy metrics. Whether architecting innovative features or maintaining legacy system integration, AI-driven coding platforms now represent essential infrastructure for development teams committed to maintaining competitive market positioning and delivering enterprise-grade software solutions.

With this foundational understanding, let's explore the main use cases and benefits of AI coding tools.

Main Use Cases and Benefits of AI Coding Tools

AI coding tools are transforming the software development process by enabling developers to generate, auto-complete, and review code using natural language prompts. Here are the main use cases and benefits, organized by key areas:

Productivity Features

  • Enhanced Productivity: Automate repetitive tasks and provide intelligent code suggestions to significantly boost developer productivity.
  • AI Suggestions: Offer code completions, refactorings, and actionable insights, integrating smoothly into developer workflows.
  • Real-Time Code Suggestions: Deliver immediate code completions and live support during programming sessions.

Code Generation

  • Generating Code: Efficiently produce code snippets, functions, or complete solutions based on user prompts, while maintaining code quality through systematic review and automated testing.
  • Python Code Assistance: Assist with Python code generation, error detection, and productivity enhancements tailored for Python developers.
  • Boilerplate and Test Generation: Generate boilerplate code, write tests, fix bugs, and explain unfamiliar code to new developers.

Testing and Debugging

  • Writing and Verifying Code: Generate, test, and refine code snippets, ensuring the resulting code meets its intended functionality.
  • Debugging and Code Review: Assist with debugging, code formatting, complex code reviews, and architectural suggestions.
  • Automated Testing: Tools like TestSprite and Diffblue are examples of AI coding assistants that automatically generate unit, integration, and security tests.
  • Test Maintenance: Detect ‘flaky’ tests and automatically update them when code changes.

Collaboration and Support

  • Documentation Generation: Generate documentation to help maintain code quality and understanding.
  • Accelerated Development: Improve productivity and accelerate software development.
  • Focus on Complex Problems: Automate repetitive tasks, allowing developers to focus on more complex issues.
  • Automated Code Reviews: Automate code reviews to ensure consistent quality and adherence to coding standards.
  • Overcoming the ‘Blank Page Problem’: Provide initial code suggestions to help developers start new tasks.
  • Technical Debt Reduction: Autonomously refactor aging legacy code, reducing technical debt.
  • Seamless IDE Integration: Integrate seamlessly with popular IDEs for a smoother development experience.
  • Collaboration and Support: Offer code suggestions, explanations, test generation, and collaboration tools.
  • Developer Enablement: Enhance developers’ capabilities and efficiency without replacing them.
  • Rapid Adoption: 65% of developers use AI coding assistants at least weekly, according to recent surveys.

AI coding tools can analyze entire codebases, edit across files, fix bugs, and generate documentation based on natural language prompts. They also provide real-time feedback and suggestions, which can enhance the learning experience for new developers.

However, the use of AI coding assistants has led to an increase in copy-pasted code, indicating a rise in technical debt. Some developers have also expressed concerns that AI coding assistants may produce poorly designed code, complicating long-term maintenance.

To ensure code quality and security, always manually verify and test AI-generated code for security, logic, and efficiency. Never copy-paste AI code blindly; perform manual line-by-line reviews to check for logical flaws and security vulnerabilities, and confirm that the code aligns with its intended functionality.

With these use cases in mind, let's examine how AI coding adoption is impacting software engineering as a whole.

Overview of AI Coding Adoption and Its Effect on Software Engineering

Broad Summary of AI Coding Adoption

The software engineering landscape has undergone a seismic shift as AI coding tools transition from experimental technologies to essential development infrastructure. AI coding tools are now a core part of modern software engineering, with organizations seeking to optimize their development processes by evaluating and adopting the best AI coding tools to meet the demands of contemporary software projects.

Adoption Rates

According to recent industry research, 90% of developers now use AI tools in their workflows, representing a dramatic surge from just 25% adoption rates in early 2023. This widespread integration signals a fundamental change in how software is conceived, written, and maintained.

Integration with Workflows

AI-powered workflows are streamlining software development and enabling more complex project handling by automating repetitive tasks, improving collaboration, and integrating seamlessly with existing processes. Developers now dedicate a median of two hours daily to working with AI tools, demonstrating how deeply these technologies have become woven into everyday development tasks.

This isn’t merely about occasional code suggestions—AI has become an integral part of the development process, from initial architecture planning through deployment and maintenance. Integrating an AI code review tool into your workflow requires configuring repository hooks and defining review policies to ensure the tool fits your team's needs and enforces consistent standards.

AI Coding Assistants: Definition and Capabilities

AI coding assistants represent a category of artificial intelligence tools designed to enhance developer productivity through automated code generation, intelligent suggestions, and contextual programming assistance. AI coding assistants can help with boilerplate code, writing tests, fixing bugs, and explaining unfamiliar code to new developers.

These tools leverage large language models trained on vast codebases to understand programming patterns, suggest completions, and even generate entire functions or modules based on natural language descriptions.

A 'coding agent' is an advanced type of AI-powered tool that acts as an autonomous or semi-autonomous assistant within IDEs like VS Code and JetBrains. Coding agents can execute structured development tasks, plan steps, and automate entire workflows, including building applications based on high-level goals. In addition to coding tasks, AI agents can manage deployment gates and autonomously roll back failing releases, streamlining deployment and release management for engineering teams.

An AI coding assistant or AI assistant can provide relevant suggestions tailored to the project context and help maintain the same style as the existing codebase, ensuring consistency and efficiency. These assistants also help overcome the ‘blank page problem' by providing initial code suggestions, making it easier for developers to start new tasks.

Developer Experience and Tool Integration

Integration with development environments is critical for maximizing the benefits of AI coding. IDE integration, VS Code extension, and code extension support enable seamless workflow, allowing developers to access AI-powered features directly within their preferred tools.

Notably, Amazon Q Developer focuses on AWS-native architectures and integrates with IDEs, Tabnine uses deep learning to adapt to a developer's coding style, and Replit offers a browser-based AI coding platform with interactive development and AI-powered assistance.

Productivity and Code Quality Impacts of AI Coding Tools

The transformative effects extend beyond individual productivity gains. Teams report accelerated feature delivery cycles, reduced time-to-market for new products, and improved code consistency across projects.

However, this rapid adoption has also introduced new challenges around code quality assurance, security validation, and maintaining engineering standards when AI-generated code comprises significant portions of production systems. There is a growing need for robust error handling and error detection, as AI tools can assist in fixing bugs but require oversight to ensure software reliability and maintainability.

Code review and maintainability are also evolving as AI-generated code becomes more prevalent. Supporting multiple languages and ensuring programming language compatibility in AI coding tools is essential for teams working across diverse technology stacks.

When selecting AI coding tools, engineering leaders should consider the role of development tools, the capabilities of different AI models, and the significance of high-quality training data for accurate and context-aware code generation. The choice of an AI coding assistant should also take into account the team's size and the specific programming languages being used.

Developer experience is also shaped by the learning curve associated with adopting AI coding tools. Even experienced developers face challenges when working with an entire codebase and reviewing code generated by AI, requiring time and practice to fully leverage these technologies. Developers have reported mixed experiences with AI coding tools, with some finding them helpful for boilerplate code and others experiencing limitations in more complex scenarios. Developer productivity can be further enhanced with AI-native intelligence tools that offer actionable insights and metrics.

As developers create new workflows and approaches with the help of AI, AI chat features are increasingly integrated into coding environments to provide real-time assistance, answer contextual questions, and support debugging.

Engineering leaders must now navigate this new landscape, balancing the undeniable productivity benefits of AI tools with the responsibility of maintaining code quality, security, and team expertise. Many AI coding tools offer a free tier or free version, making them accessible for individual developers, while pricing varies widely across free, individual, and enterprise plans. The organizations that succeed will be those that develop sophisticated measurement frameworks to understand and optimize their AI coding impact.

With this context in mind, let's explore how AI-generated code is changing the development process in detail.

Understanding AI Generated Code

How AI Generates Code

AI generated code is fundamentally reshaping the software development landscape by introducing sophisticated algorithms that analyze vast datasets, predict optimal coding patterns, and deliver context-aware code generation at unprecedented scales.

Leveraging advanced AI coding tools powered by natural language processing (NLP) and machine learning (ML) algorithms, development teams can now generate high-quality code snippets, receive intelligent code suggestions, and benefit from advanced code completion capabilities that analyze project context, coding patterns, and historical data to deliver precise recommendations.

AI performs exceptionally well at generating code, documentation, and tests effectively, enhancing the development process and code comprehension. AI excels at routine and consistency tasks, such as enforcing coding standards and automating repetitive work, but human judgment remains essential for addressing more complex or nuanced issues.

Integration with IDEs

Modern AI coding assistants integrate seamlessly with popular Integrated Development Environments (IDEs) such as Visual Studio Code (VS Code), Visual Studio, IntelliJ IDEA, and PyCharm, making it increasingly straightforward to incorporate AI powered code completion into daily development workflows.

A crucial feature for effective code development is robust context management, which allows these tools to understand and adapt to project environments, ensuring that code suggestions are relevant and accurate.

Productivity Benefits

Benefits of AI Coding Tools:

  • Accelerate code generation and prototyping cycles
  • Enhance overall code quality with real-time suggestions and automated refactoring
  • Provide comprehensive code explanations and documentation
  • Reduce syntax errors and logical inconsistencies
  • Promote code consistency and maintainability
  • Support multiple programming languages and frameworks
  • Automate repetitive coding tasks, freeing developers for higher-level work

AI coding tools are transforming the software development process by enabling developers to generate, auto-complete, and review code using natural language prompts.

Challenges and Risks

Challenges and Risks of AI Coding Tools:

To better understand how AI tools can both benefit and challenge software teams, see our comprehensive guide to developer productivity tools.

  • May lack nuanced understanding of domain-specific business logic or legacy system constraints
  • Can introduce security vulnerabilities if not properly configured or reviewed
  • Potential for increased technical debt if generated code is not aligned with long-term architectural goals
  • Require comprehensive oversight, including code reviews and automated testing
  • Developers may face a learning curve in reviewing and integrating AI-generated code

Limitations of AI Coding Assistants

Understanding the limitations of AI coding assistants is crucial, as they may not always produce optimal solutions for complex problems. While these tools excel at automating routine tasks and providing initial code drafts, they may struggle with highly specialized algorithms, intricate architectural decisions, or unique business requirements.

In these cases, human reviewers play an essential role in handling complex, judgment-based aspects of the code review process, such as architectural decisions and logic validation. A human-in-the-loop approach is essential for the most effective AI code review implementations, ensuring quality and context are maintained.

Quality Assurance and Oversight

To maximize benefits and minimize operational risks, it becomes essential to systematically select AI coding tools that align precisely with your development team's technical requirements, preferred technology stack, and established development environment configurations.

Implementing systematic practices for regularly reviewing, testing, and validating AI generated code against established organizational standards is critical. Even the most sophisticated AI coding assistants require comprehensive oversight mechanisms to guarantee that generated code meets stringent organizational standards for security, performance, scalability, and readability.

With a clear understanding of how AI generates code and its associated challenges, let's move on to the expanding ecosystem of AI tools for coding.

Overview of AI Tools for Coding

The Expanding Ecosystem

The contemporary ecosystem of AI-driven development platforms demonstrates unprecedented expansion, delivering sophisticated algorithmic solutions meticulously engineered to address diverse computational development paradigms. These advanced AI coding tools and frameworks are especially valuable for managing multiple files during larger migration projects and incremental development work, streamlining complex tasks that span across extensive codebases.

Industry-leading intelligent coding frameworks such as GitHub Copilot, Tabnine, and Augment Code have established foundational benchmarks for advanced code synthesis and automated completion mechanisms, achieving seamless architectural integration with extensively utilized development environments including Visual Studio Code (VS Code) and JetBrains IDEs.

Key Features and Capabilities

These AI-powered coding assistants harness sophisticated natural language processing algorithms to interpret and analyze natural language prompts, empowering development teams to synthesize comprehensive code snippets and intricate functional implementations through descriptive intent articulation.

Common Features of AI Coding Tools:

  • Automated code generation and completion
  • Intelligent code suggestions and refactoring
  • Automated code review and bug detection
  • Security vulnerability analysis
  • Documentation generation
  • Integration with popular IDEs and version control systems
  • Analyzing and refactoring existing code, enabling seamless adoption within current IDEs and version control systems

Advanced Operational Features

Transcending fundamental code generation capabilities, contemporary AI-enhanced development platforms now orchestrate advanced operational features including:

  • Automated code review systems
  • Predictive bug detection algorithms
  • Comprehensive security vulnerability analysis frameworks

Many AI code review and generation tools process code on external servers, raising important considerations around data security and privacy. It is crucial for engineering teams to understand whether their code is being processed on external servers or internal infrastructure, as each deployment model carries different security implications. Evaluating where code is handled helps organizations mitigate risks associated with sensitive information exposure and comply with internal security policies.

This multifaceted approach not only optimizes code quality metrics but simultaneously accelerates development lifecycle velocity by implementing proactive issue identification protocols during early development phases.

Selecting the Right Tool

When strategically evaluating optimal AI toolchain selection for organizational deployment, critical consideration parameters encompass compatibility matrices with preferred programming language ecosystems, the comprehensive capability spectrum of tools within your development environment architecture, and the specific technical requirements governing your project portfolios.

Prompt engineering is a key strategy for improving the quality and relevance of AI interactions. Developers should prioritize prompt engineering to ensure AI tools understand their requirements clearly.

Through strategic implementation of appropriate AI coding platforms, development teams can achieve enhanced precision-driven code suggestions, maintain elevated code quality standards, and systematically optimize their software development workflow architectures.

With a solid grasp of the available tools, let's now focus on how to measure the impact of AI coding in your organization.

Key Metrics for Measuring AI Coding Impact

Developer Velocity and Productivity Metrics

Measuring the velocity impact of AI coding tools requires a multifaceted approach that captures both quantitative output and qualitative improvements in developer experience. The most effective metrics combine traditional productivity indicators with AI-specific measurements that reflect the new realities of assisted development.

  • Code Generation Speed: Track the time from task assignment to first working implementation, comparing pre-AI and post-AI adoption periods while controlling for task complexity.
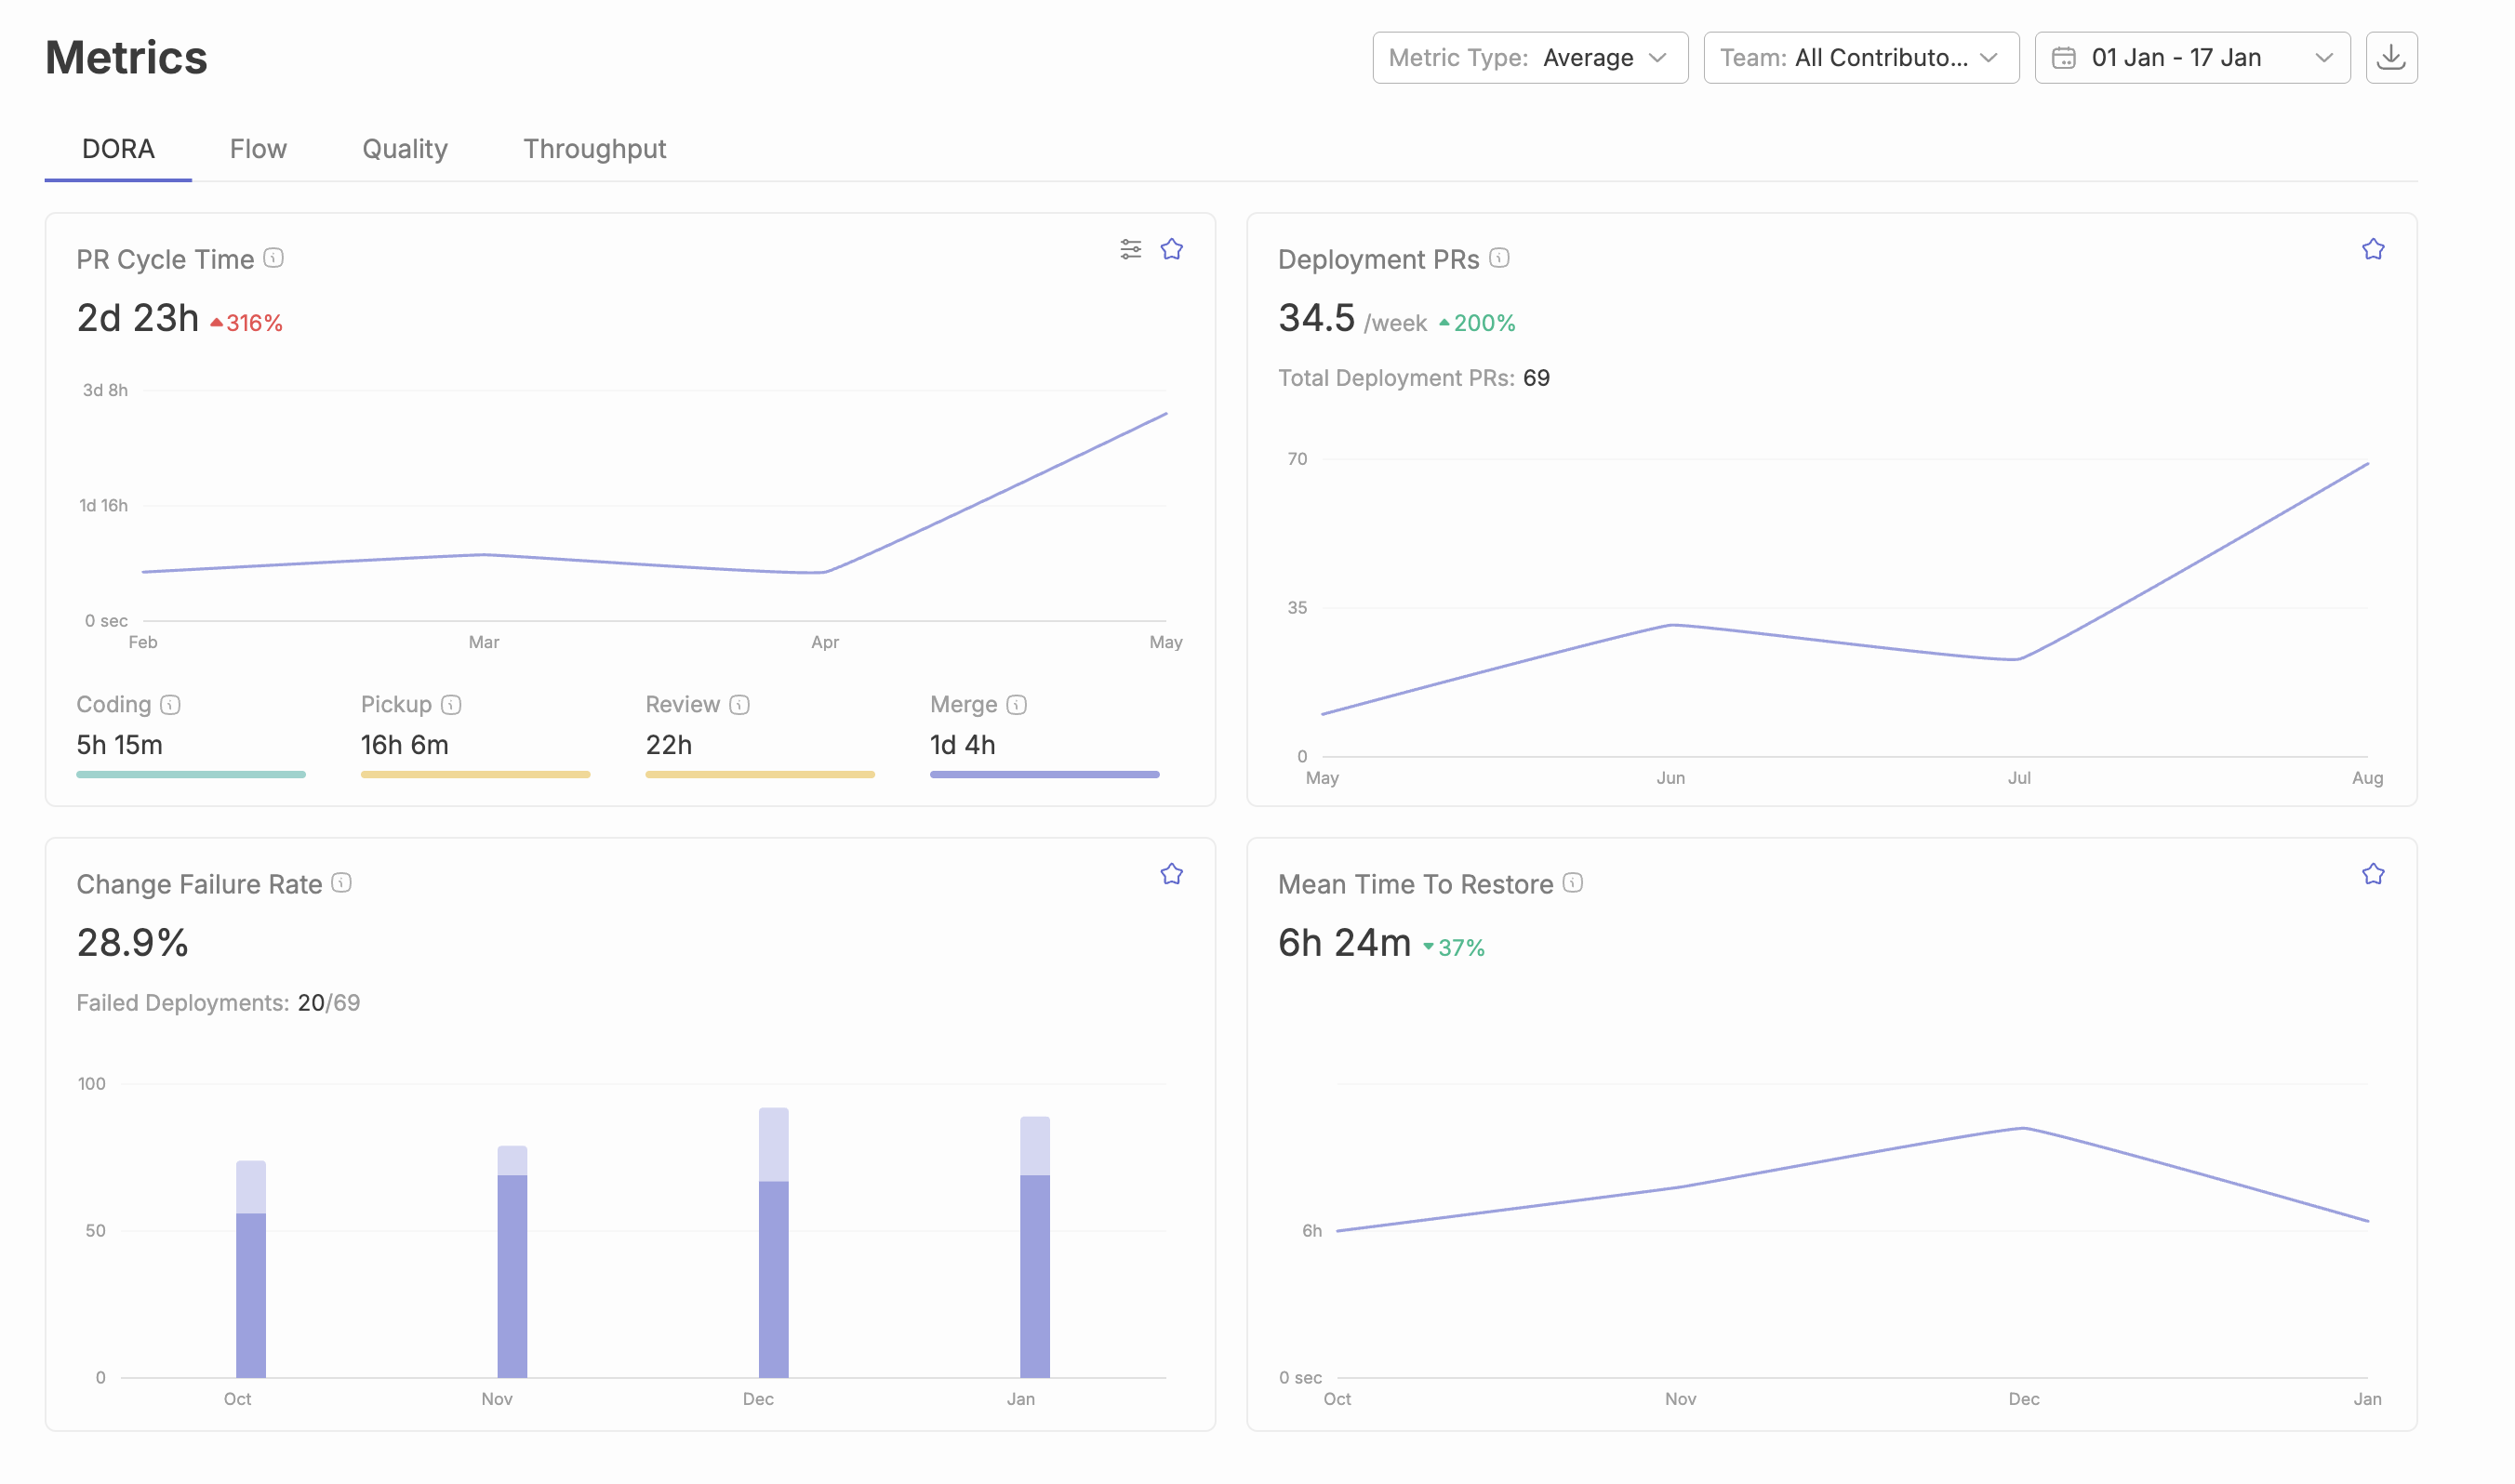
  • Feature Delivery Velocity: PR cycle time, measure story points completed per sprint, features shipped per quarter, or time-to-market for new capabilities.
  • Developer Flow State Preservation: Measure context switching frequency, time spent in deep work sessions, and developer-reported satisfaction with their ability to maintain concentration.
  • Task Completion Rates: Analyze completion rates across different complexity levels to reveal where AI tools provide the most value.

Code Quality and Reliability Improvements

Quality metrics must evolve to account for the unique characteristics of AI-generated code while maintaining rigorous standards for production systems.

  • Defect Density Analysis: Compare AI-assisted versus human-only code for bug rates and logic errors.
  • Security Vulnerability Detection: Use automated security scanning tools to monitor for vulnerabilities in AI-generated code.
  • Code Review Efficiency: Measure review cycle time, comments per review, and reviewer confidence ratings.
  • Pull Requests Transparency: Clearly disclose AI usage in commit messages and pull request documentation to maintain team transparency.
  • Technical Debt Accumulation: Track code maintainability scores, architectural compliance ratings, and refactoring frequency.

Team Performance and Developer Experience

  • Skill Development Trajectories: Monitor junior developer progression rates, knowledge transfer effectiveness, and skill acquisition.
  • Collaboration Quality Indicators: Track code review engagement levels, knowledge sharing session frequency, and cross-team collaboration effectiveness.
  • Developer Satisfaction and Retention: Survey developers about their experience with AI tools, focusing on perceived value and impact on job satisfaction.
  • Cognitive Load Assessment: Use surveys and focus groups to assess changes in mental workload and stress levels.

Learn more about key performance indicators for software development teams.

With these metrics in place, organizations can better understand the ROI and business impact of AI coding tools.

ROI and Business Impact Analysis

Cost-Benefit Framework for AI Coding Tools

Establishing a comprehensive cost-benefit framework for AI coding tools requires careful consideration of both direct financial impacts and indirect organizational benefits.

  1. Direct Cost Analysis: Account for tool licensing fees, infrastructure requirements, and integration expenses.
  2. Productivity Value Calculation: Translate time savings into financial impact based on developer salaries and team size.
  3. Quality Impact Monetization: Calculate cost savings from reduced bug rates and technical debt remediation.
  4. Competitive Advantage Quantification: Assess the strategic value of faster time-to-market and improved innovation capacity.

Long-term Strategic Value

  • Talent Acquisition and Retention Benefits: Organizations offering modern AI-enhanced development environments attract higher-quality candidates and experience reduced turnover rates.
  • Innovation Acceleration Capacity: AI tools free developers from routine tasks, enabling focus on creative problem-solving and experimental projects.
  • Scalability and Growth Enablement: AI tools help smaller teams achieve output levels previously requiring larger headcounts.
  • Technical Debt Management: AI tools generate more consistent, well-documented code that aligns with established patterns.

With a clear understanding of ROI, let's move on to best practices for implementing and measuring AI coding tools in your organization.

Implementation Best Practices and Measurement Frameworks

Establishing Baseline Metrics

To measure the impact of AI coding tools, follow these steps:

  1. Pre-Implementation Data Collection: Collect data for 3-6 months on developer velocity, code quality, and developer satisfaction.
  2. Metric Standardization Protocols: Define clear criteria for AI-assisted vs. traditional development work and implement automated tooling.
  3. Control Group Establishment: Maintain teams using traditional methods alongside AI-assisted teams for comparison.
  4. Measurement Cadence Planning: Implement weekly, monthly, and quarterly reviews to capture both short-term and long-term impacts.

Monitoring and Optimization Strategies

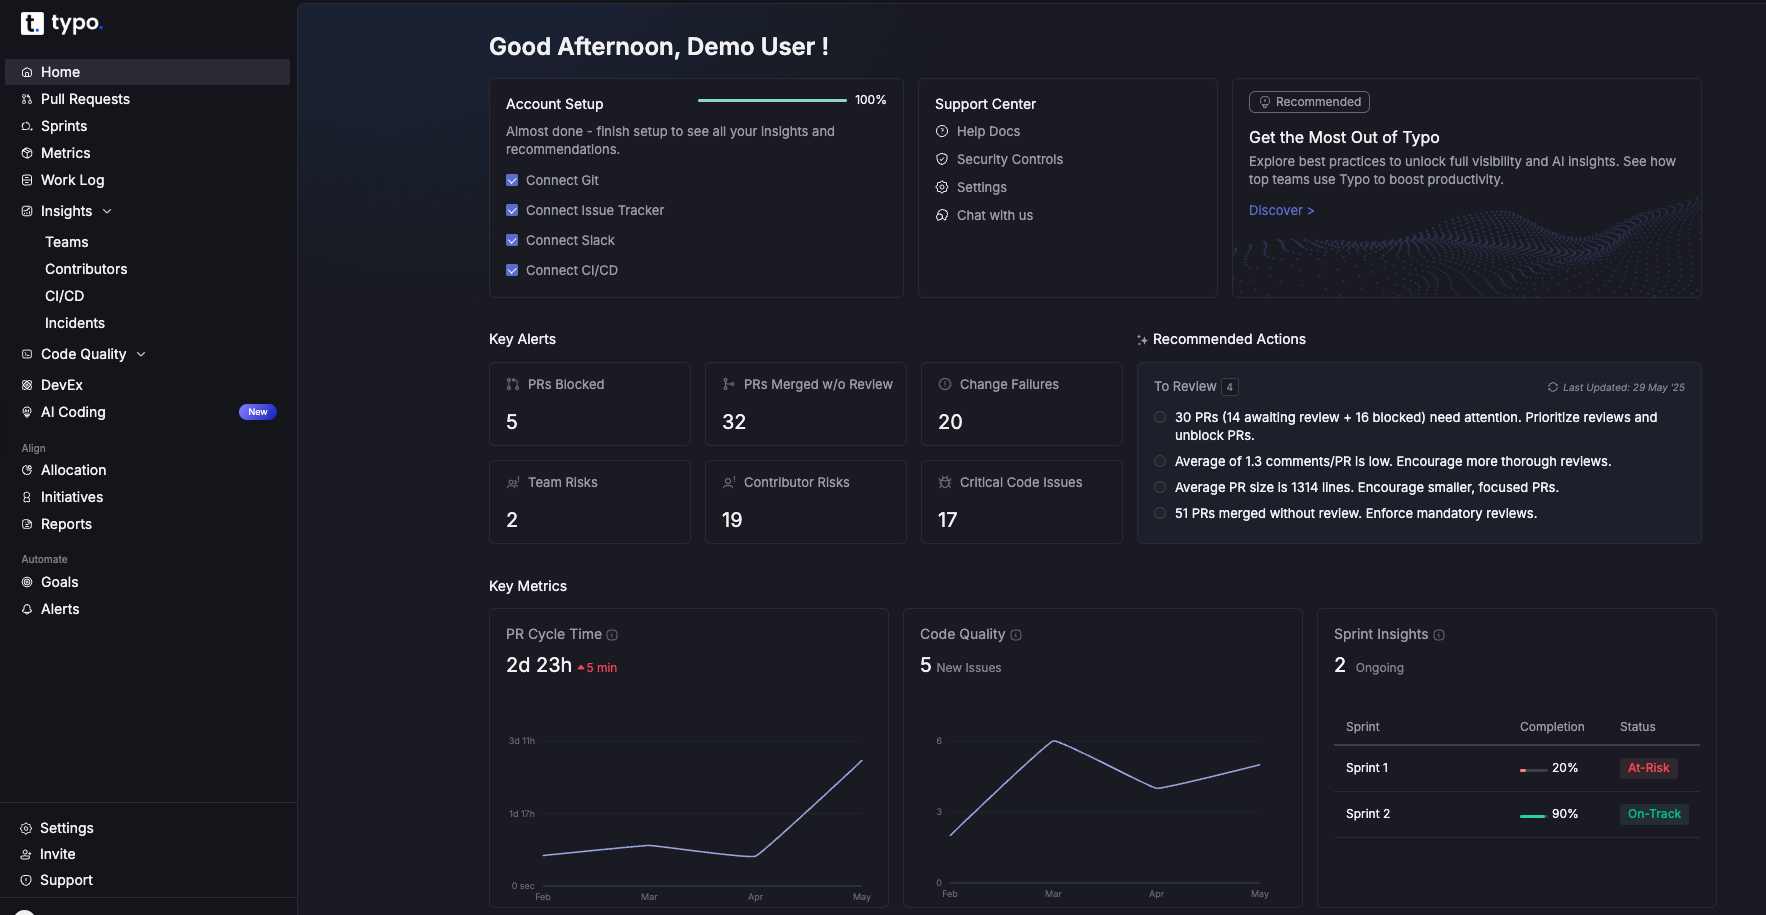
  1. Real-time Dashboard Implementation: Track daily metrics including AI tool engagement rates and code generation volumes.
  2. Regular Assessment Cycles: Combine quantitative analysis with qualitative feedback collection in retrospectives and business reviews.
  3. Optimization Feedback Loops: Analyze patterns in successful AI-assisted development and document best practices.
  4. Adaptation and Scaling Protocols: Regularly evaluate new AI coding tools and features, and develop frameworks for scaling successful implementations.

The measurement and optimization of AI coding impact represents an ongoing journey rather than a destination. Organizations that invest in comprehensive measurement frameworks, maintain focus on both quantitative and qualitative outcomes, and continuously adapt their approaches will maximize the transformative potential of AI-assisted development while maintaining the engineering excellence that drives long-term success.

With implementation best practices in place, let's discuss how to integrate AI coding tools with your existing development ecosystem.

Integration with Existing Tools

Seamless Integration with Development Ecosystems

The seamless integration of AI-driven coding solutions with established development ecosystems and sophisticated workflow architectures represents a fundamental paradigm shift in maximizing computational efficiency and developer productivity across enterprise-scale software development initiatives.

Key Integration Features:

  • Extension frameworks and plugin architectures for IDEs (e.g., Visual Studio Code, IntelliJ IDEA)
  • Context-aware code completion algorithms and real-time intelligent code suggestion engines
  • Integration with distributed version control systems (e.g., Git, Mercurial, Subversion)
  • Automated code review processes and intelligent merge conflict resolution

Through strategic embedding of AI-powered development tools into established daily workflow patterns, organizations can systematically enhance coding efficiency metrics, accelerate code review cycles, optimize quality assurance processes, and ensure consistent application of industry best practices.

With integration strategies in mind, let's examine how AI-powered code review and feedback can further improve your workflows.

Code Review and Feedback in AI Coding Workflows

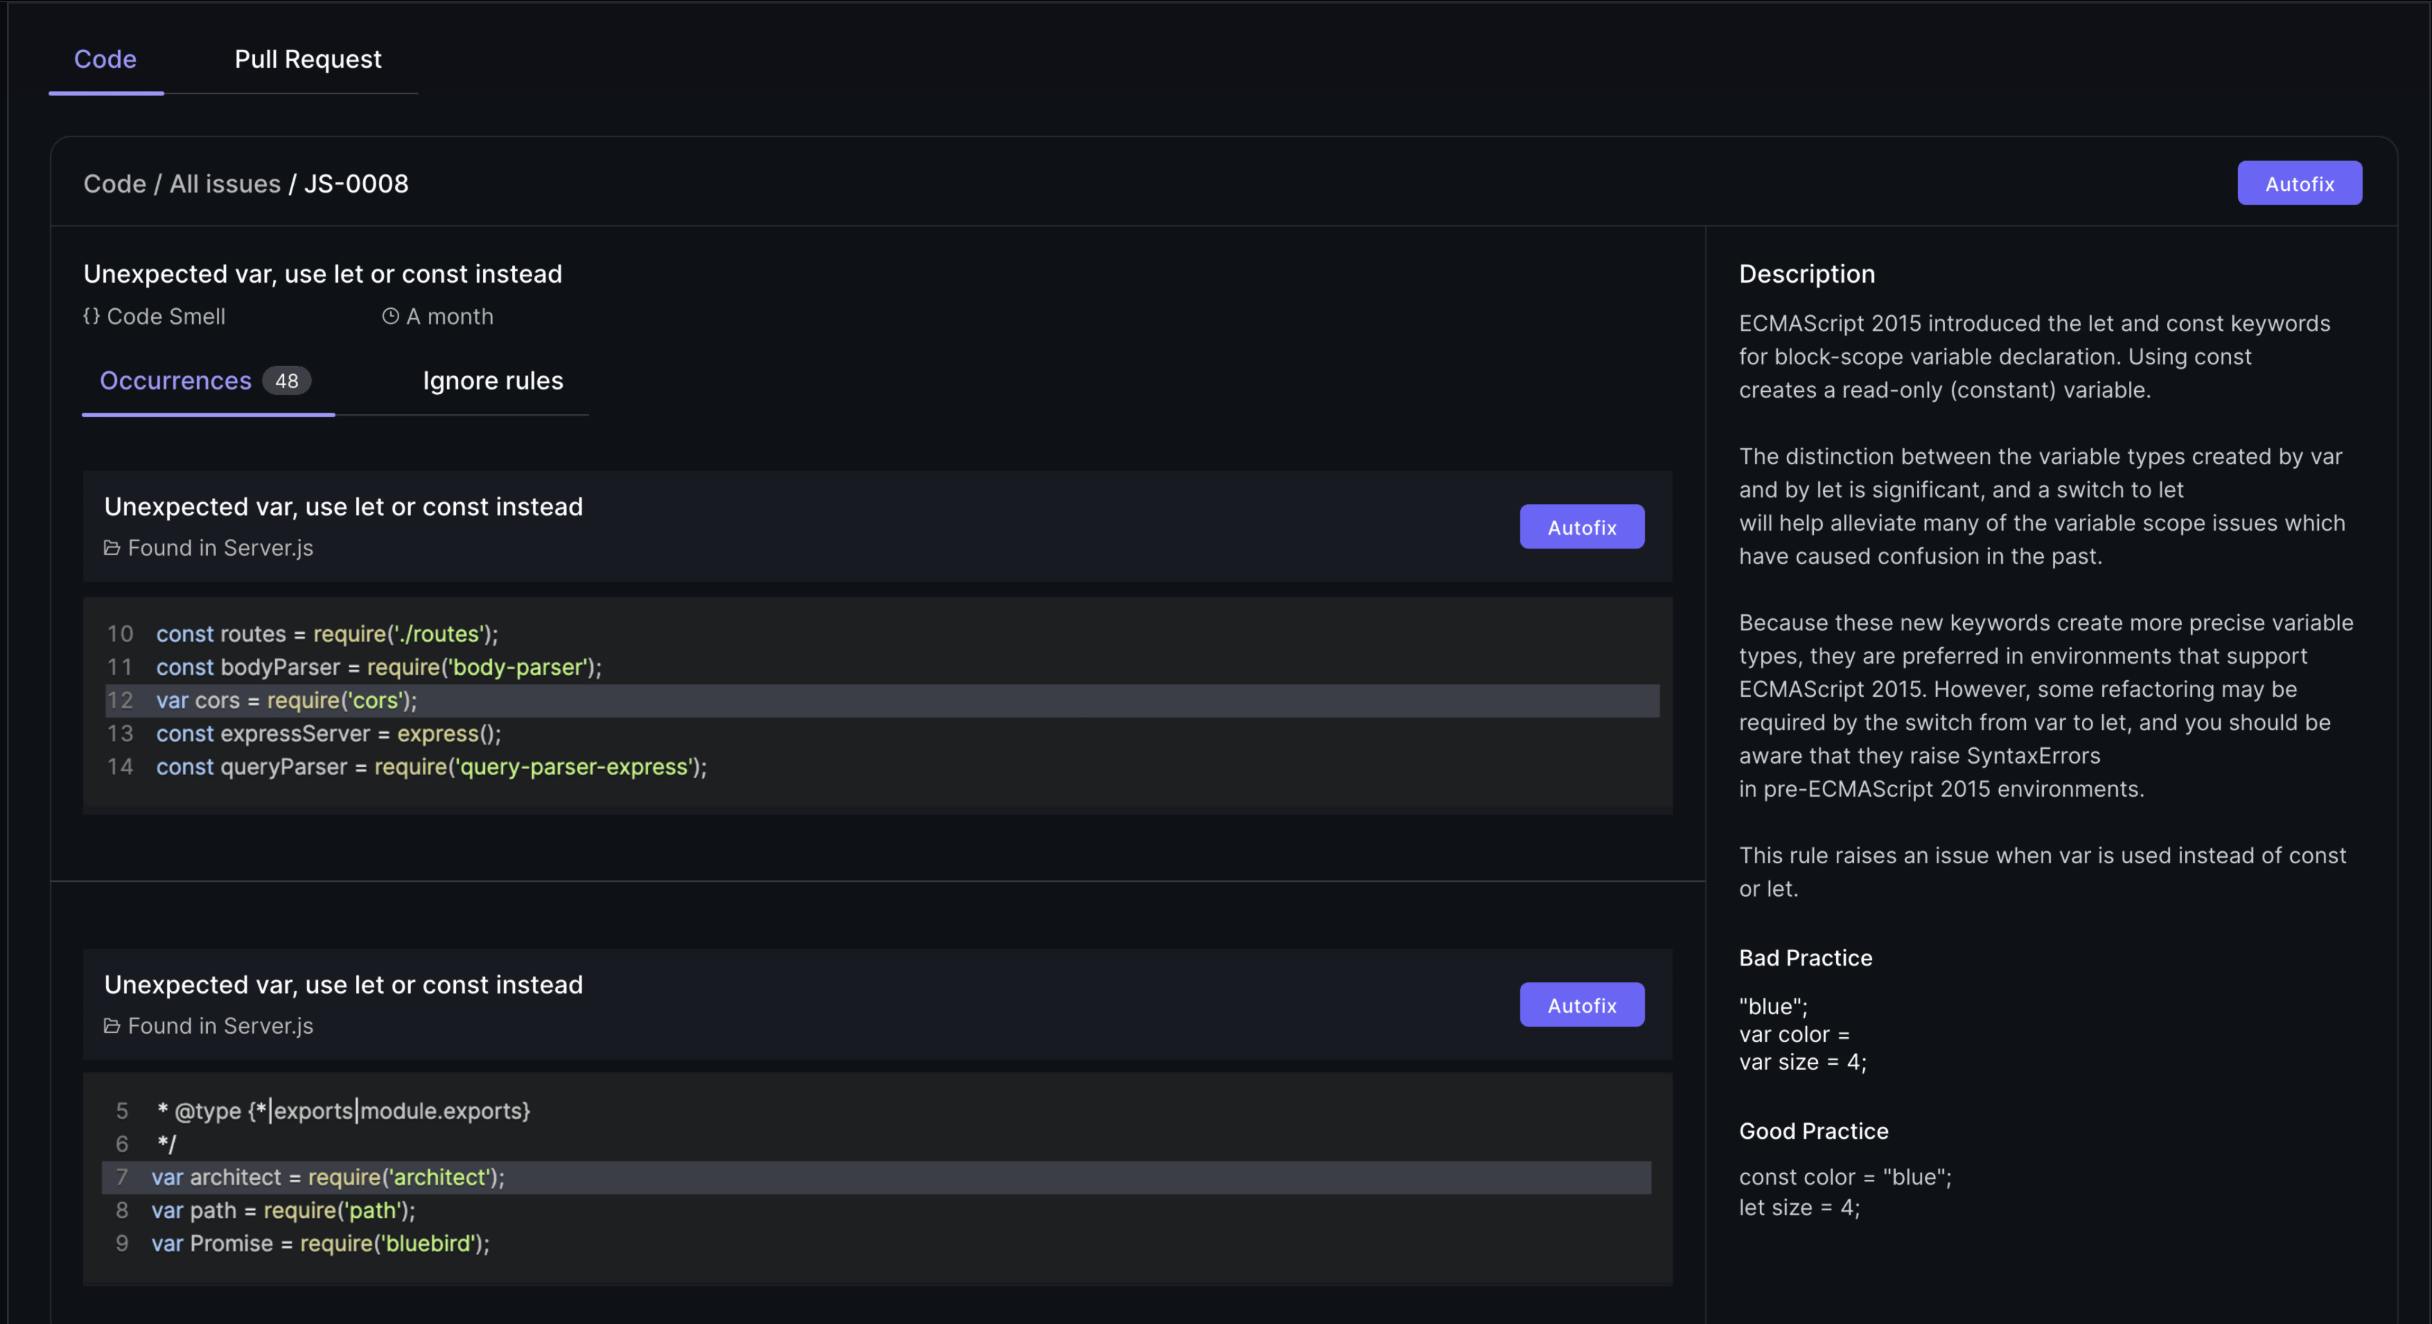
AI-Powered Code Review and Feedback

Incorporating AI-powered coding tools and automated code analysis systems into code review and feedback processes is fundamentally transforming how development teams ensure code quality standards, maintainability, and security compliance throughout the comprehensive Software Development Life Cycle (SDLC).

Benefits of AI-Driven Code Review:

  • Automated detection of syntax errors, logical inconsistencies, and security vulnerabilities
  • Actionable code suggestions and best practice recommendations
  • Real-time optimization insights within IDEs
  • Reduced reliance on manual reviews and accelerated CI/CD pipeline efficiency

By leveraging AI-powered code review systems and intelligent static analysis tools, development teams can maintain a consistently high level of code quality, architectural integrity, and security posture, even as the pace of agile development iterations increases.

With robust code review processes in place, let's address the security considerations unique to AI-generated code.

Security Considerations in AI Generated Code

Security Challenges and Best Practices

AI-generated code transforms development workflows by delivering remarkable efficiency gains and reducing human error rates across software projects. However, this technological advancement introduces a complex landscape of security challenges that development teams must navigate carefully.

Security Best Practices:

  • Establish comprehensive code review processes and rigorous testing protocols for AI-generated code
  • Leverage advanced security-focused capabilities embedded within modern AI coding platforms
  • Implement multiple layers of protection, including penetration testing, static code analysis, and code auditing
  • Continuously monitor AI-generated code against baseline security metrics

By integrating security considerations into every stage of the AI-assisted development process, organizations can effectively harness the transformative power of AI-generated code while maintaining the robust security posture and reliability that modern software solutions demand.

With security addressed, let's look at how code snippets can be used strategically in AI coding workflows.

Using Code Snippets in AI Coding Workflows

Code snippets have become a strategic asset in modern AI-driven software development, enabling engineering teams to accelerate coding tasks while maintaining high standards of code quality and consistency. These reusable fragments of code are intelligently generated and adapted by AI coding assistants based on the project's historical data, architectural context, and team-specific coding practices.

For engineering leaders, leveraging AI-powered code snippet management translates into measurable productivity gains by reducing repetitive manual coding, minimizing integration errors, and enforcing organizational coding standards across diverse teams and projects.

Leading AI coding platforms such as GitHub Copilot and Tabnine employ advanced machine learning models that analyze extensive codebases and developer interactions to deliver precise, context-aware code suggestions within popular integrated development environments (IDEs) like Visual Studio Code and JetBrains. These tools continuously refine their recommendation engines by learning from ongoing developer feedback, ensuring that the generated snippets align with both project-specific requirements and broader enterprise coding guidelines.

By embedding AI-enhanced snippet workflows into the development lifecycle, organizations can shift engineering efforts from routine code creation toward solving complex architectural challenges, optimizing system performance, and advancing innovation. This approach also fosters improved collaboration through standardized code sharing and version control integration, ensuring that teams operate with a unified codebase and adhere to best practices.

Ultimately, the adoption of AI-assisted code snippet management supports accelerated delivery timelines, higher code reliability, and enhanced developer satisfaction—key metrics for engineering leaders aiming to drive competitive advantage in software delivery.

With code snippet strategies in place, let's compare the leading AI coding assistants available today.

Comparative Analysis of AI Coding Assistants

AI Coding Assistant Key Strengths Deployment Options Programming Language Support Integration & IDE Support Unique Features Ideal Use Cases Considerations for Engineering Leaders
GitHub Copilot Advanced neural network-based code completion; seamless GitHub and VS Code integration Cloud-based Wide language support including Python, JavaScript, TypeScript, and more Visual Studio Code, Visual Studio, JetBrains IDEs Real-time code suggestions, PR summaries, code explanations Rapid prototyping, teams prioritizing speed and ease of adoption Limited context window can challenge large or legacy codebases; best suited for modern codebases
Tabnine Privacy-focused; adapts to individual and team coding styles; supports deep learning models Cloud and self-hosted Supports multiple programming languages VS Code, JetBrains, other popular IDEs Intelligent code refactoring, code explanation, customizable models Organizations with stringent security requirements, regulated industries Slightly slower response times; self-hosting requires infrastructure investment
Augment Code Architectural context engine; semantic dependency graph for large codebases Cloud-based Supports large, complex repositories with multiple languages VS Code, JetBrains Multi-file refactoring; deep architectural understanding; advanced AI code review Enterprises managing legacy systems and distributed architectures Initial indexing time required; cloud-based processing may raise security concerns and impact developer productivity
Amazon Q Developer AWS-native architecture understanding; integrated security scanning Cloud-based Focus on AWS services and common programming languages VS Code, JetBrains, AWS Console Security vulnerability detection; CloudFormation and CDK troubleshooting Teams heavily using AWS infrastructure Limited value outside AWS ecosystem; weaker understanding of custom architectures
Claude Code Advanced reasoning and autonomous coding capabilities; multi-agent workflows Cloud-based Supports multiple popular programming languages VS Code, JetBrains, other IDEs, and software engineering intelligence platforms Autonomous coding agents; enhanced context management; planning mode Complex projects requiring extended context and autonomous coding Newer platform with evolving features; teams must adapt to agent-based workflows
JetBrains AI Assistant Deep IDE integration; AST-aware code understanding; test generation Cloud-based Java, Kotlin, Python, Go, JavaScript, and other major languages JetBrains IDEs only Refactoring guidance, debugging assistance, pattern-based test generation Teams standardized on JetBrains IDEs; regulated environments No VS Code support; moderate autocomplete speed; limited repo-wide architectural context
Cursor Fast autocomplete; targeted context queries via @mentions Cloud-based (standalone VS Code fork) with integration options for generative AI developer tools Supports multiple programming languages Standalone VS Code fork Fast response times; multi-file editing; targeted questions Solo developers and small teams working on modern codebases No repository-wide semantic understanding; requires switching editors

This comparative table provides engineering leaders with a holistic view of top AI coding assistants, highlighting strengths, deployment models, integration capabilities, and considerations to guide informed decision-making aligned with organizational needs and project complexity.

With a comparison of leading tools complete, let's explore the emerging trends and technologies shaping the future of AI coding.

Emerging Trends and Technologies in AI Coding

The software development landscape is undergoing a profound transformation driven by emerging AI technologies that reshape how teams generate, review, and maintain code. Among the most significant trends is the adoption of local large language models (LLMs), which enable AI-powered coding assistance to operate directly within on-premises infrastructure. This shift addresses critical concerns around data privacy, security compliance, and latency, making AI coding tools more accessible for organizations with stringent regulatory requirements.

Natural language processing advancements now allow AI tools to translate plain-language business specifications into high-quality, production-ready code without requiring deep expertise in programming languages. This democratizes software development, accelerates onboarding, and fosters collaboration between technical and non-technical stakeholders.

AI-driven code quality optimization is becoming increasingly sophisticated, with models capable of analyzing entire codebases to identify security vulnerabilities, enforce coding standards, and predict failure-prone areas. Integration with continuous integration and continuous deployment (CI/CD) pipelines enables automated generation of comprehensive test cases, ensuring functional and non-functional requirements are met while maintaining optimal performance.

For engineering leaders, embracing these AI innovations means investing in platforms that not only enhance coding efficiency but also proactively manage technical debt and security risks. Teams that adopt AI-enhanced development workflows position themselves to achieve superior software quality, faster delivery cycles, and sustainable scalability in an increasingly competitive market.

With an eye on the future, let's discuss how to customize AI coding workflows for your team's unique needs.

Customizing AI Coding Workflows

Customizing AI coding workflows is essential for software engineers and engineering leaders who want to unlock the full potential of AI-assisted coding. By tailoring AI tools to fit the unique needs of your team and development process, you can significantly enhance code quality, streamline repetitive tasks, and accelerate delivery timelines.

AI coding assistants like Claude Code can be seamlessly integrated into existing development workflows, providing real-time AI assistance for everything from generating boilerplate code to reviewing code for style violations and complex logic errors. To get the most value from AI-assisted coding, start by identifying the stages in your workflow where AI tools can have the greatest impact—such as automating repetitive coding tasks, flagging style inconsistencies, or offering feedback on intricate business logic.

Custom workflows might include configuring AI tools to align with your team’s coding standards, setting up automated code review triggers, or using AI to generate documentation and tests for new features. By leveraging AI coding assistants in a way that complements human expertise, software engineers can focus on higher-value problem solving while AI handles routine or time-consuming tasks. This synergy not only improves code quality but also fosters a more efficient and effective development process.

Ultimately, the key to successful AI-assisted coding lies in continuous refinement: regularly review how AI tools are performing within your workflows, gather feedback from your team, and adjust configurations to ensure that AI assistance is always aligned with your evolving business needs and technical goals.

With customized workflows in place, staying up-to-date with AI advancements is the next step to maintaining a competitive edge.

Staying Up-to-Date with AI Advancements

In the fast-moving world of AI-assisted coding, staying up-to-date with the latest AI tools, models, and best practices is critical for software engineers who want to leverage AI effectively in their development workflows. The landscape of AI coding is constantly evolving, with new AI models and features emerging that can dramatically improve productivity, code quality, and the overall development process.

To keep pace, developers should actively participate in online forums, join AI and software engineering communities, and attend industry conferences or webinars focused on AI-assisted development. Engaging with peers and thought leaders provides valuable insights into how others are integrating AI tools into their workflows and overcoming common challenges.

Experimentation is equally important—try out new AI tools and features as they become available, and evaluate how they fit into your team’s specific use cases. By continuously learning and adapting, you can ensure that your development workflows remain optimized and that you are leveraging AI to its fullest potential.

Staying informed about the latest advancements in AI-assisted coding not only helps you maintain a competitive edge but also empowers you to adopt best practices that drive better performance, security, and code quality across your projects.

With a commitment to continuous learning, let's conclude with a summary of the key takeaways for AI-assisted coding.

Conclusion

AI-assisted coding is a powerful tool that is transforming the software development landscape. By leveraging advanced AI tools such as Claude Code, software engineers can dramatically improve code quality, accelerate the development process, and boost overall productivity. To fully realize these benefits, it’s essential to customize your AI coding workflows, stay current with the latest AI advancements, and commit to continuous learning and improvement.

Embracing AI-assisted coding and following best practices enables teams to create better software, faster and more efficiently. Whether you’re an experienced software engineer or just beginning your journey, integrating AI into your development process is now an essential skill for success in today’s dynamic software development environment.

Additional Resources

For those looking to deepen their expertise in AI-assisted coding and make the most of AI tools in their development workflows, a wealth of resources is available. Online courses from providers like DeepLearning.AI offer comprehensive introductions to AI-assisted coding and the latest AI tools. Industry conferences and local meetups provide opportunities to network, share experiences, and learn about emerging best practices.

Active participation in online communities such as GitHub and Stack Overflow can help you stay informed about new developments, troubleshoot challenges, and exchange ideas with other developers leveraging AI. Exploring popular AI tools like GitHub Copilot, Cursor, and Claude Code can also provide hands-on experience with AI-assisted coding, code review, and the generation of boilerplate code.

By taking advantage of these resources and continuously refining your approach, you can stay at the forefront of AI-assisted development, ensuring your skills and workflows remain aligned with industry best practices and the latest technological advancements.

Software Product Metrics

Essential Software Product Metrics Explained

Software product metrics measure quality, performance, and user satisfaction, aligning with business goals to improve your software. This article explains essential metrics and their role in guiding development decisions.

Key Takeaways

  • Software product metrics are essential for evaluating quality, performance, and user satisfaction, guiding development decisions and continuous improvement.
  • Key metrics such as defect density, code coverage, and maintainability index are critical for assessing software reliability and enhancing overall product quality. Performance/Quality metrics also include Deployment Frequency, Lead Time for Changes, Change Failure Rate, Mean Time to Recovery (MTTR), and Test Coverage, which provide a comprehensive view of software health.
  • Selecting the right metrics aligned with business objectives and evolving them throughout the product lifecycle is crucial for effective software development management.

Understanding Software Product Metrics

Software product metrics are quantifiable measurements that assess various characteristics and performance aspects of software products. These metrics are designed to align with business goals, add user value, and ensure the proper functioning of the product. Tracking these critical metrics ensures your software meets quality standards, performs reliably, and fulfills user expectations. User Satisfaction metrics include Net Promoter Score (NPS), Customer Satisfaction Score (CSAT), and Customer Effort Score (CES), which provide valuable insights into user experiences and satisfaction levels. User Engagement metrics include Active Users, Session Duration, and Feature Usage, which help teams understand how users interact with the product. Additionally, understanding software metric product metrics in software is essential for continuous improvement.

Evaluating quality, performance, and effectiveness, software metrics guide development decisions and align with user needs. They provide insights that influence development strategies, leading to enhanced product quality and improved developer experience and productivity. These metrics help teams identify areas for improvement, assess project progress, and make informed decisions to enhance product quality.

Quality software metrics reduce maintenance efforts, enabling teams to focus on developing new features and enhancing user satisfaction. Comprehensive insights into software health help teams detect issues early and guide improvements, ultimately leading to better software. These metrics serve as a compass, guiding your development team towards creating a robust and user-friendly product.

Key Software Quality Metrics

Software quality metrics are essential quantitative indicators that evaluate the quality, performance, maintainability, and complexity of software products. These quantifiable measures enable teams to monitor progress, identify challenges, and adjust strategies in the software development process. Additionally, metrics in software engineering play a crucial role in enhancing overall software product’s quality.

By measuring various aspects such as functionality, reliability, and usability, quality metrics ensure that software systems meet user expectations and performance standards. The following subsections delve into specific key metrics that play a pivotal role in maintaining high code quality and software reliability.

Defect Density

Defect density is a crucial metric that helps identify problematic areas in the codebase by measuring the number of defects per a specified amount of code. Typically measured in terms of Lines of Code (LOC), a high defect density indicates potential maintenance challenges and higher defect risks. Pinpointing areas with high defect density allows development teams to focus on improving those sections, leading to a more stable and reliable software product and enhancing defect removal efficiency.

Understanding and reducing defect density is essential for maintaining high code quality. It provides a clear picture of the software’s health and helps teams prioritize bug fixes and software defects. Consistent monitoring allows teams to proactively address issues, enhancing the overall quality and user satisfaction of the software product.

Code Coverage

Code coverage is a metric that assesses the percentage of code executed during testing, ensuring adequate test coverage and identifying untested parts. Static analysis tools like SonarQube, ESLint, and Checkstyle play a crucial role in maintaining high code quality by enforcing consistent coding practices and detecting potential vulnerabilities before runtime. These tools are integral to the software development process, helping teams adhere to code quality standards and reduce the likelihood of defects.

Maintaining high code quality through comprehensive code coverage leads to fewer defects and improved code maintainability. Software quality management platforms that facilitate code coverage analysis include:

  • SonarQube
  • Codacy
  • Coverity These platforms help improve the overall quality of the software product. Ensuring significant code coverage helps development teams deliver more reliable and robust software systems.

Maintainability Index

The Maintainability Index is a metric that provides insights into the software’s complexity, readability, and documentation, all of which influence how easily a software system can be modified or updated. Metrics such as cyclomatic complexity, which measures the number of linearly independent paths in code, are crucial for understanding the complexity of the software. High complexity typically suggests there may be maintenance challenges ahead. It also indicates a greater risk of defects.

Other metrics like the Length of Identifiers, which measures the average length of distinct identifiers in a program, and the Depth of Conditional Nesting, which measures the depth of nesting of if statements, also contribute to the Maintainability Index. These metrics help identify areas that may require refactoring or documentation improvements, ultimately enhancing the maintainability and longevity of the software product.

Performance and Reliability Metrics

Performance and reliability metrics are vital for understanding the software’s ability to perform under various conditions over time. These metrics provide insights into the software’s stability, helping teams gauge how well the software maintains its operational functions without interruption. By implementing rigorous software testing and code review practices, teams can proactively identify and fix defects, thereby improving the software’s performance and reliability.

The following subsections explore specific essential metrics that are critical for assessing performance and reliability, including key performance indicators and test metrics.

Mean Time Between Failures (MTBF)

Mean Time Between Failures (MTBF) is a key metric used to assess the reliability and stability of a system. It calculates the average time between failures, providing a clear indication of how often the system can be expected to fail. A higher MTBF indicates a more reliable system, as it means that failures occur less frequently.

Tracking MTBF helps teams understand the robustness of their software and identify potential areas for improvement. Analyzing this metric helps development teams implement strategies to enhance system reliability, ensuring consistent performance and meeting user expectations.

Mean Time to Repair (MTTR)

Mean Time to Repair (MTTR) reflects the average duration needed to resolve issues after system failures occur. This metric encompasses the total duration from system failure to restoration, including repair and testing times. A lower MTTR indicates that the system can be restored quickly, minimizing downtime and its impact on users. Additionally, Mean Time to Recovery (MTTR) is a critical metric for understanding how efficiently services can be restored after a failure, ensuring minimal disruption to users.

Understanding MTTR is crucial for evaluating the effectiveness of maintenance processes. It provides insights into how efficiently a development team can address and resolve issues, ultimately contributing to the overall reliability and user satisfaction of the software product.

Response Time

Response time measures the duration taken by a system to react to user commands, which is crucial for user experience. A shorter response time indicates a more responsive system, enhancing user satisfaction and engagement. Measuring response time helps teams identify performance bottlenecks that may negatively affect user experience.

Ensuring a quick response time is essential for maintaining high user satisfaction and retention rates. Performance monitoring tools can provide detailed insights into response times, helping teams optimize their software to deliver a seamless and efficient user experience.

User Engagement and Satisfaction Metrics

User engagement and satisfaction metrics are vital for assessing how users interact with a product and can significantly influence its success. These metrics provide critical insights into user behavior, preferences, and satisfaction levels, helping teams refine product features to enhance user engagement.

Tracking these metrics helps development teams identify areas for improvement and ensures the software meets user expectations. The following subsections explore specific metrics that are crucial for understanding user engagement and satisfaction.

Net Promoter Score (NPS)

Net Promoter Score (NPS) is a widely used gauge of customer loyalty, reflecting how likely customers are to recommend a product to others. It is calculated by subtracting the percentage of detractors from the percentage of promoters, providing a clear metric for customer loyalty. A higher NPS indicates that customers are more satisfied and likely to promote the product.

Tracking NPS helps teams understand customer satisfaction levels and identify areas for improvement. Focusing on increasing NPS helps development teams enhance user satisfaction and retention, leading to a more successful product.

Active Users

The number of active users reflects the software’s ability to retain user interest and engagement over time. Tracking daily, weekly, and monthly active users helps gauge the ongoing interest and engagement levels with the software. A higher number of active users indicates that the software is effectively meeting user needs and expectations.

Understanding and tracking active users is crucial for improving user retention strategies. Analyzing user engagement data helps teams enhance software features and ensure the product continues to deliver value.

Feature Usage

Tracking how frequently specific features are utilized can inform development priorities based on user needs and feedback. Analyzing feature usage reveals which features are most valued and frequently utilized by users, guiding targeted enhancements and prioritization of development resources.

Monitoring specific feature usage helps development teams gain insights into user preferences and behavior. This information helps identify areas for improvement and ensures that the software evolves in line with user expectations and demands.

Financial Metrics in Software Development

Financial metrics are essential for understanding the economic impact of software products and guiding business decisions effectively. These metrics help organizations evaluate the economic benefits and viability of their software products. Tracking financial metrics helps development teams make informed decisions that contribute to the financial health and sustainability of the software product. Tracking metrics such as MRR helps Agile teams understand their product's financial health and growth trajectory.

The following subsections explore specific financial metrics that are crucial for evaluating software development.

Customer Acquisition Cost (CAC)

Customer Acquisition Cost (CAC) represents the total cost of acquiring a new customer, including marketing expenses and sales team salaries. It is calculated by dividing total sales and marketing costs by the number of new customers acquired. A high customer acquisition costs (CAC) shows that targeted marketing strategies are necessary. It also suggests that enhancements to the product’s value proposition may be needed.

Understanding CAC is crucial for optimizing marketing efforts and ensuring that the cost of acquiring new customers is sustainable. Reducing CAC helps organizations improve overall profitability and ensure the long-term success of their software products.

Customer Lifetime Value (CLV)

Customer lifetime value (CLV) quantifies the total revenue generated from a customer. This measurement accounts for the entire duration of their relationship with the product. It is calculated by multiplying the average purchase value by the purchase frequency and lifespan. A healthy ratio of CLV to CAC indicates long-term value and sustainable revenue.

Tracking CLV helps organizations assess the long-term value of customer relationships and make informed business decisions. Focusing on increasing CLV helps development teams enhance customer satisfaction and retention, contributing to the financial health of the software product.

Monthly Recurring Revenue (MRR)

Monthly recurring revenue (MRR) is predictable revenue from subscription services generated monthly. It is calculated by multiplying the total number of paying customers by the average revenue per customer. MRR serves as a key indicator of financial health, representing consistent monthly revenue from subscription-based services.

Tracking MRR allows businesses to forecast growth and make informed financial decisions. A steady or increasing MRR indicates a healthy subscription-based business, while fluctuations may signal the need for adjustments in pricing or service offerings.

Choosing the Right Metrics for Your Project

Selecting the right metrics for your project is crucial for ensuring that you focus on the most relevant aspects of your software development process. A systematic approach helps identify the most appropriate product metrics that can guide your development strategies and improve the overall quality of your software. Activation rate tracks the percentage of users who complete a specific set of actions consistent with experiencing a product's core value, making it a valuable metric for understanding user engagement.

The following subsections provide insights into key considerations for choosing the right metrics.

Align with Business Objectives

Metrics selected should directly support the overarching goals of the business to ensure actionable insights. By aligning metrics with business objectives, teams can make informed decisions that drive business growth and improve customer satisfaction. For example, if your business aims to enhance user engagement, tracking metrics like active users and feature usage will provide valuable insights.

A data-driven approach ensures that the metrics you track provide objective data that can guide your marketing strategy, product development, and overall business operations. Product managers play a crucial role in selecting metrics that align with business goals, ensuring that the development team stays focused on delivering value to users and stakeholders.

Balance Vanity and Actionable Metrics

Clear differentiation between vanity metrics and actionable metrics is essential for effective decision-making. Vanity metrics may look impressive but do not provide insights or drive improvements. In contrast, actionable metrics inform decisions and strategies to enhance software quality. Vanity Metrics should be avoided; instead, focus on actionable metrics tied to business outcomes to ensure meaningful progress and alignment with organizational goals.

Using the right metrics fosters a culture of accountability and continuous improvement within agile teams. By focusing on actionable metrics, development teams can track progress, identify areas for improvement, and implement changes that lead to better software products. This balance is crucial for maintaining a metrics focus that drives real value.

Evolve Metrics with the Product Lifecycle

As a product develops, the focus should shift to metrics that reflect user engagement and retention in line with our development efforts. Early in the product lifecycle, metrics like user acquisition and activation rates are crucial for understanding initial user interest and onboarding success.

As the product matures, metrics related to user satisfaction, feature usage, and retention become more critical. Metrics should evolve to reflect the changing priorities and challenges at each stage of the product lifecycle.

Continuous tracking and adjustment of metrics ensure that development teams remain focused on the most relevant aspects of project management in the software, leading to sustained tracking product metrics success.

Tools for Tracking and Visualizing Metrics

Having the right tools for tracking and visualizing metrics is essential for automatically collecting raw data and providing real-time insights. These tools act as diagnostics for maintaining system performance and making informed decisions.

The following subsections explore various tools that can help track software metrics and visualize process metrics and software metrics effectively.

Static Analysis Tools

Static analysis tools analyze code without executing it, allowing developers to identify potential bugs and vulnerabilities early in the development process. These tools help improve code quality and maintainability by providing insights into code structure, potential errors, and security vulnerabilities. Popular static analysis tools include Typo, SonarQube, which provides comprehensive code metrics, and ESLint, which detects problematic patterns in JavaScript code.

Using static analysis tools helps development teams enforce consistent coding practices and detect issues early, ensuring high code quality and reducing the likelihood of software failures.

Dynamic Analysis Tools

Dynamic analysis tools execute code to find runtime errors, significantly improving software quality. Examples of dynamic analysis tools include Valgrind and Google AddressSanitizer. These tools help identify issues that may not be apparent in static analysis, such as memory leaks, buffer overflows, and other runtime errors.

Incorporating dynamic analysis tools into the software engineering development process helps ensure reliable software performance in real-world conditions, enhancing user satisfaction and reducing the risk of defects.

Performance Monitoring Tools

Performance monitoring tools track performance, availability, and resource usage. Examples include:

  • New Relic
  • Datadog
  • AppDynamics

Insights from performance monitoring tools help identify performance bottlenecks and ensure adherence to SLAs. By using these tools, development teams can optimize system performance, maintain high user engagement, and ensure the software meets user expectations, providing meaningful insights.

AI Coding Reviews

AI coding assistants do accelerate code creation, but they also introduce variability in style, complexity, and maintainability. The bottleneck has shifted from writing code to understanding, reviewing, and validating it.

Effective AI-era code reviews require three things:

  1. Risk-Based Routing
    Not every PR should follow the same review path.
    Low-risk, AI-heavy refactors may be auto-reviewed with lightweight checks.
    High-risk business logic, security-sensitive changes, and complex flows require deeper human attention.
  2. Metrics Beyond Speed
    Measuring “time to first review” and “time to merge” is not enough.
    Teams must evaluate:
    • Review depth
    • Addressed rate
    • Reopen or rollback frequency
    • Rework on AI-generated lines
      These metrics help separate stable long-term quality from short-term velocity.
  3. AI-Assisted Reviewing, Not Blind Approval
    Tools like Typo can summarize PRs, flag anomalies in changed code, detect duplication, or highlight risky patterns.
    The reviewer’s job becomes verifying whether AI-origin code actually fits the system’s architecture, boundaries, and long-term maintainability expectations.

AI coding reviews are not “faster reviews.” They are smarter, risk-aligned reviews that help teams maintain quality without slowing down the flow of work.

Summary

Understanding and utilizing software product metrics is crucial for the success of any software development project. These metrics provide valuable insights into various aspects of the software, from code quality to user satisfaction. By tracking and analyzing these metrics, development teams can make informed decisions, enhance product quality, and ensure alignment with business objectives.

Incorporating the right metrics and using appropriate tools for tracking and visualization can significantly improve the software development process. By focusing on actionable metrics, aligning them with business goals, and evolving them throughout the product lifecycle, teams can create robust, user-friendly, and financially successful software products. Using tools to automatically collect data and create dashboards is essential for tracking and visualizing product metrics effectively, enabling real-time insights and informed decision-making. Embrace the power of software product metrics to drive continuous improvement and achieve long-term success.

Frequently Asked Questions

What are software product metrics?

Software product metrics are quantifiable measurements that evaluate the performance and characteristics of software products, aligning with business goals while adding value for users. They play a crucial role in ensuring the software functions effectively.

Why is defect density important in software development?

Defect density is crucial in software development as it highlights problematic areas within the code by quantifying defects per unit of code. This measurement enables teams to prioritize improvements, ultimately reducing maintenance challenges and mitigating defect risks.

How does code coverage improve software quality?

Code coverage significantly enhances software quality by ensuring that a high percentage of the code is tested, which helps identify untested areas and reduces defects. This thorough testing ultimately leads to improved code maintainability and reliability.

What is the significance of tracking active users?

Tracking active users is crucial as it measures ongoing interest and engagement, allowing you to refine user retention strategies effectively. This insight helps ensure the software remains relevant and valuable to its users. A low user retention rate might suggest a need to improve the onboarding experience or add new features.

How do AI coding reviews enhance the software development process?

AI coding reviews enhance the software development process by optimizing coding speed and maintaining high code quality, which reduces human error and streamlines workflows. This leads to improved efficiency and the ability to quickly identify and address bottlenecks.

Top Developer Experience Tools 2026

Top Developer Experience Tools 2026

TL;DR

Developer Experience (DevEx) is now the backbone of engineering performance. AI coding assistants and multi-agent workflows increased raw output, but also increased cognitive load, review bottlenecks, rework cycles, code duplication, semantic drift, and burnout risk. Modern CTOs treat DevEx as a system design problem, not a cultural initiative. High-quality software comes from happy, satisfied developers, making their experience a critical factor in engineering success.

This long-form guide breaks down:

  • The modern definition of DevEx
  • Why DevEx matters more in 2026 than any previous era
  • The real AI failure modes degrading DevEx
  • Expanded DORA and SPACE metrics for AI-first engineering
  • The key features that define the best developer experience platforms
  • A CTO-evaluated list of the top developer experience tools in 2026, helping you identify the best developer tools for your team
  • A modern DevEx mental model: Flow, Clarity, Quality, Energy, Governance
  • Rollout guidance, governance, failure patterns, and team design
If you lead engineering in 2026, DevEx is your most powerful lever.Everything else depends on it.

Introduction

Software development in 2026 is unrecognizable compared to even 2022. Leading developer experience platforms in 2024/25 fall primarily into Internal Developer Platforms (IDPs)/Portals or specialized developer tools. Many developer experience platforms aim to reduce friction and siloed work while allowing developers to focus more on coding and less on pipeline or infrastructure management. These platforms help teams build software more efficiently and with higher quality. The best developer experience platforms enable developers by streamlining integration, improving security, and simplifying complex tasks. Top platforms prioritize seamless integration with existing tools, cloud providers, and CI/CD pipelines to unify the developer workflow. Qovery, a cloud deployment platform, simplifies the process of deploying and managing applications in cloud environments, further enhancing developer productivity.

AI coding assistants like Cursor, Windsurf, and Copilot turbocharge code creation. Each developer tool is designed to boost productivity by streamlining the development workflow, enhancing collaboration, and reducing onboarding time. GitHub Copilot, for instance, is an AI-powered code completion tool that helps developers write code faster and with fewer errors. Collaboration tools are now a key part of strategies to improve teamwork and communication within development teams, with collaborative features like preview environments and Git integrations playing a crucial role in improving workflow efficiency. These tools encourage collaboration and effective communication, helping to break down barriers and reduce isolated workflows. Tools like Cody enhance deep code search. Platforms like Sourcegraph help developers quickly search, analyze, and understand code across multiple repositories and languages, making it easier to comprehend complex codebases. CI/CD tools optimize themselves. Planning tools automate triage. Modern platforms also automate tedious tasks such as documentation, code analysis, and bug fixing, further streamlining developer workflows. Documentation tools write themselves. Testing tools generate tests, all contributing to a more efficient development workflow. Integrating new features into existing tools can further streamline development workflows and improve efficiency. These platforms also integrate seamlessly with existing workflows to optimize productivity and analysis within teams.

The rise of cloud-based dev environments that are reproducible, code-defined setups supports rapid onboarding and collaboration, making it easier for teams to start new projects or tasks quickly.

Platforms like Vercel are designed to support frontend developers by streamlining deployment, automation, performance optimization, and collaborative features that enhance the development workflow for web applications. A cloud platform is a specialized infrastructure for web and frontend development, offering deployment automation, scalability, integration with version control systems, and tools that improve developer workflows and collaboration. Cloud platforms enable teams to efficiently build, deploy, and manage web applications throughout their lifecycle. Amazon Web Services (AWS) complements these efforts by providing a vast suite of cloud services, including compute, storage, and databases, with a pay-as-you-go model, making it a versatile choice for developers.

AI coding assistants like Copilot also help developers learn and code in new programming languages by suggesting syntax and functions, accelerating development and reducing the learning curve. These tools are designed to increase developer productivity by enabling faster coding, reducing errors, and facilitating collaboration through AI-powered code suggestions.

So why are engineering leaders reporting:

Because production speed without system stability creates drag faster than teams can address it.

DevEx is the stabilizing force.It converts AI-era capability into predictable, sustainable engineering performance.

This article reframes DevEx for the AI-first era and lays out the top developer experience tools actually shaping engineering teams in 2026.

What Developer Experience Means in 2026

The old view of DevEx focused on:

  • tooling
  • onboarding
  • documentation
  • environments
  • culture

The productivity of software developers is heavily influenced by the tools they use.

  • tooling
  • onboarding
  • documentation
  • environments
  • culture

All still relevant, but DevEx now includes workload stability, cognitive clarity, AI-governance, review system quality, streamlined workflows, and modern development environments. Many modern developer tools automate repetitive tasks, simplifying complex processes, and providing resources for debugging and testing, including integrated debugging tools that offer real-time feedback and analytics to speed up issue resolution. Platforms that handle security, performance, and automation tasks help maintain developers focus on core development activities, reducing distractions from infrastructure or security management. Open-source platforms generally have a steeper learning curve due to the required setup and configuration, while commercial options provide a more intuitive user experience out-of-the-box. Humanitec, for instance, enables self-service infrastructure, allowing developers to define and deploy their own environments through a unified dashboard, further reducing operational overhead.

A good DevEx means not only having the right tools and culture, but also optimized developer workflows that enhance productivity and collaboration. The right development tools and a streamlined development process are essential for achieving these outcomes.

Modern Definition (2026)

Developer Experience is the quality, stability, and sustainability of a developer's daily workflow across:

  • flow time
  • cognitive load
  • review friction
  • AI-origin code complexity
  • toolchain integration cost
  • clarity of system behavior
  • psychological safety
  • long-term sustainability of work patterns
  • efficiency across the software development lifecycle
  • fostering a positive developer experience

Good DevEx = developers understand their system, trust their tools, can get work done without constant friction, and benefit from a positive developer experience. When developers can dedicate less time to navigating complex processes and more time to actual coding, there's a noticeable increase in overall productivity.

Bad DevEx compounds into:

  • slow reviews
  • high rework
  • poor morale
  • inconsistent quality
  • fragile delivery
  • burnout cycles

Failing to enhance developer productivity leads to these negative outcomes.

Why DevEx Matters in the AI Era

1. Onboarding now includes AI literacy

New hires must understand:

  • internal model guardrails
  • how to review AI-generated code
  • how to handle multi-agent suggestions
  • what patterns are acceptable or banned
  • how AI-origin code is tagged, traced, and governed
  • how to use self service capabilities in modern developer platforms to independently manage infrastructure, automate routine tasks, and maintain compliance

Without this, onboarding becomes chaotic and error-prone.

2. Cognitive load is now the primary bottleneck

Speed is no longer limited by typing. It's limited by understanding, context, and predictability

AI increases:

  • number of diffs
  • size of diffs
  • frequency of diffs
  • number of repetitive tasks that can contribute to cognitive load

which increases mental load.

3. Review pressure is the new burnout

In AI-native teams, PRs come faster. Reviewers spend longer inspecting them because:

  • logic may be subtly inconsistent
  • duplication may be hidden
  • generated tests may be brittle
  • large diffs hide embedded regressions

Good DevEx reduces review noise and increases clarity, and effective debugging tools can help streamline the review process.

4. Drift becomes the main quality risk

Semantic drift—not syntax errors—is the top source of failure in AI-generated codebases.

5. Flow fragmentation kills productivity

Notifications, meetings, Slack chatter, automated comments, and agent messages all cannibalize developer focus.

AI Failure Modes That Break DevEx

CTOs repeatedly see the same patterns:

  • Overfitting to training data
  • Lack of explainability
  • Data drift
  • Poor integration with existing systems

Ensuring seamless integrations between AI tools and existing systems is critical to reducing friction and preventing these failure modes, as outlined in the discussion of Developer Experience (DX) and the SPACE Framework. Compatibility with your existing tech stack is essential to ensure smooth adoption and minimal disruption to current workflows.

Automating repetitive tasks can help mitigate some of these issues by reducing human error, ensuring consistency, and freeing up time for teams to focus on higher-level problem solving. Effective feedback loops provide real-time input to developers, supporting continuous improvement and fostering efficient collaboration.

1. AI-generated review noise

AI reviewers produce repetitive, low-value comments. Signal-to-noise collapses. Learn more about efforts to improve engineering intelligence.

2. PR inflation

Developers ship larger diffs with machine-generated scaffolding.

3. Code duplication

Different assistants generate incompatible versions of the same logic.

4. Silent architectural drift

Subtle, unreviewed inconsistencies compound over quarters.

5. Ownership ambiguity

Who authored the logic — developer or AI?

6. Skill atrophy

Developers lose depth, not speed.

7. Notification overload

Every tool wants attention.

If you're interested in learning more about the common challenges every engineering manager faces, check out this article.

The right developer experience tools address these failure modes directly, significantly improving developer productivity.

Expanded DORA & SPACE for AI Teams

DORA (2026 Interpretation)

  • Lead Time: split into human vs AI-origin
  • Deployment Frequency: includes autonomous deploys
  • Change Failure Rate: attribute failures by origin
  • MTTR: fix pattern must identify downstream AI drift

SPACE (2026 Interpretation)

  • Satisfaction: trust in AI, clarity, noise levels
  • Performance: flow stability, not throughput
  • Activity: rework cycles and cognitive fragmentation
  • Communication: review signal quality and async load
  • Efficiency: comprehension cost of AI-origin code

Modern DevEx requires tooling that can instrument these.

Features of a Developer Experience Platform

A developer experience platform transforms how development teams approach the software development lifecycle, creating a unified environment where workflows become streamlined, automated, and remarkably efficient. These platforms dive deep into what developers truly need—the freedom to solve complex problems and craft exceptional software—by eliminating friction and automating those repetitive tasks that traditionally bog down the development process. CodeSandbox, for example, provides an online code editor and prototyping environment that allows developers to create, share, and collaborate on web applications directly in a browser, further enhancing productivity and collaboration.

Key features that shape modern developer experience platforms include:

  • Automation Capabilities & Workflow Automation: These platforms revolutionize developer productivity by automating tedious, repetitive tasks that consume valuable time. Workflow automation takes charge of complex processes—code reviews, testing, and deployment—handling them with precision while reducing manual intervention and eliminating human error risks. Development teams can now focus their energy on core innovation and problem-solving.
  • Integrated Debugging Tools & Code Intelligence: Built-in debugging capabilities and intelligent code analysis deliver real-time insights on code changes, empowering developers to swiftly identify and resolve issues. Platforms like Sourcegraph provide advanced search and analysis features that help developers quickly understand code across large, complex codebases, improving efficiency and reducing onboarding time. This acceleration doesn’t just speed up development workflows—it elevates code quality and systematically reduces technical debt accumulation over time.
  • Seamless Integration with Existing Tools: Effective developer experience platforms excel at connecting smoothly with existing tools, version control systems, and cloud infrastructure. Development teams can adopt powerful new capabilities without disrupting their established workflows, enabling fluid integration that supports continuous integration and deployment practices across the board.
  • Unified Platform for Project Management & Collaboration: By consolidating project management, API management, and collaboration features into a single, cohesive interface, these platforms streamline team communication and coordination. Features like pull requests, collaborative code reviews, and real-time feedback loops foster knowledge sharing while reducing developer frustration and enhancing team dynamics.
  • Support for Frontend Developers & Web Applications: Frontend developers benefit from cloud platforms specifically designed for building, deploying, and managing web applications efficiently. This approach reduces infrastructure management burden and enables businesses to deliver enterprise-grade applications quickly and reliably, regardless of programming language or technology stack preferences.
  • API Management & Automation: API management becomes streamlined through unified interfaces that empower developers to create, test, and monitor APIs with remarkable efficiency. Automation capabilities extend throughout API testing and deployment processes, ensuring robust and scalable integrations across the entire software development ecosystem.
  • Optimization of Processes & Reduction of Technical Debt: These platforms enable developers to automate routine tasks and optimize workflows systematically, helping software development teams maintain peak productivity while minimizing technical debt accumulation. Real-time feedback and comprehensive analytics support continuous improvement initiatives and promote sustainable development practices.
  • Code Editors: Visual Studio Code is a lightweight editor known for extensive extension support, making it ideal for a variety of programming languages.
  • Superior Documentation: Port, a unified developer portal, is known for quick onboarding and superior documentation, ensuring developers can access the resources they need efficiently.

Ultimately, a developer experience platform transcends being merely a collection of developer tools—it serves as an essential foundation that enables developers, empowers teams, and supports the complete software development lifecycle. By delivering a unified, automated, and collaborative environment, these platforms help organizations deliver exceptional software faster, streamline complex workflows, and cultivate positive developer experiences that drive innovation and ensure long-term success.

Below is the most detailed, experience-backed list available.

This list focuses on essential tools with core functionality that drive developer experience, ensuring efficiency and reliability in software development. The list includes a variety of code editors supporting multiple programming languages, such as Visual Studio Code, which is known for its versatility and productivity features.

Every tool is hyperlinked and selected based on real traction, not legacy popularity.

Time, Flow & Schedule Stability Tools

1. Reclaim.ai

The gold standard for autonomous scheduling in engineering teams.

What it does:
Reclaim rebuilds your calendar around focus, review time, meetings, and priority tasks. It dynamically self-adjusts as work evolves.

Why it matters for DevEx:
Engineers lose hours each week to calendar chaos. Reclaim restores true flow time by algorithmically protecting deep work sessions based on your workload and habits, helping maximize developer effectiveness.

Key DevEx Benefits:

  • Automatic focus block creation
  • Auto-scheduled code review windows
  • Meeting load balancing
  • Org-wide fragmentation metrics
  • Predictive scheduling based on workload trends

Who should use it:
Teams with high meeting overhead or inconsistent collaboration patterns.

2. Motion

Deterministic task prioritization for developers drowning in context switching.

What it does:
Motion replans your day automatically every time new work arrives. For teams looking for flexible plans to improve engineering productivity, explore Typo's Plans & Pricing.

DevEx advantages:

  • Reduces prioritization fatigue
  • Ensures urgent work is slotted properly
  • Keeps developers grounded when priorities change rapidly

Ideal for:
IC-heavy organizations with shifting work surfaces.

3. Clockwise

Still relevant for orchestrating cross-functional meetings.

Strengths:

  • Focus time enhancement
  • Meeting optimization
  • Team calendar alignment

Best for:
Teams with distributed or hybrid work patterns.

AI Coding, Code Intelligence & Context Tools

4. Cursor

The dominant AI-native IDE of 2026.

Cursor changed the way engineering teams write and refactor code. Its strength comes from:

  • Deep understanding of project structure
  • Multi-file reasoning
  • Architectural transformations
  • Tight conversational loops for iterative coding
  • Strong context retention
  • Team-level configuration policies

DevEx benefits:

  • Faster context regain
  • Lower rework cycles
  • Reduced cognitive load
  • Higher-quality refactors
  • Fewer review friction points

If your engineers write code, they are either using Cursor or competing with someone who does.

5. Windsurf

Best for large-scale transformations and controlled agent orchestration.

Windsurf is ideal for big codebases where developers want:

  • Multi-agent execution
  • Architectural rewrites
  • Automated module migration
  • Higher-order planning

DevEx value:
It reduces the cognitive burden of large, sweeping changes.

6. GitHub Copilot Enterprise

Enterprise governance + AI coding.

Copilot Enterprise embeds policy-aware suggestions, security heuristics, codebase-specific patterns, and standardization features.

DevEx impact:
Consistency, compliance, and safe usage across large teams.

7. Sourcegraph Cody

Industry-leading semantic code intelligence.

Cody excels at:

  • Navigating monorepos
  • Understanding dependency graphs
  • Analyzing call hierarchies
  • Performing deep explanations
  • Detecting semantic drift

Sourcegraph Cody helps developers quickly search, analyze, and understand code across multiple repositories and languages, making it easier to comprehend complex codebases.

DevEx benefit:Developers spend far less time searching or inferring.

8. Continue.dev

Open-source AI coding assistant.

Ideal for orgs that need:

  • Local inference
  • Self-hosting
  • Fully private workflows
  • Custom model routing

9. JetBrains AI

Advanced refactors + consistent transformations.

If your org uses JetBrains IDEs, this adds:

  • Architecture-aware suggestions
  • Pattern-consistent modifications
  • Safer refactors

Planning, Execution & Workflows

10. Linear

The fastest, lowest-friction issue tracker for engineering teams.

Why it matters for DevEx:
Its ergonomics reduce overhead. Its AI features trim backlog bloat, summarize work, and help leads maintain clarity.

Strong for:

  • High-velocity product teams
  • Early-stage startups
  • Mid-market teams focused on speed and clarity

11. Height

Workflow intelligence and automation-first project management.

Height offers:

  • AI triage
  • Auto-assigned tasks
  • Cross-team orchestration
  • Automated dependency mapping

DevEx benefit:
Reduces managerial overhead and handoff friction.

12.Coda


A flexible workspace that combines docs, tables, automations, and AI-powered workflows. Great for engineering orgs that want documents, specs, rituals, and team processes to live in one system.

Why it fits DevEx:

  • Keeps specs and decisions close to work
  • Reduces tool sprawl
  • Works as a living system-of-record
  • Highly automatable

Testing, QA & Quality Assurance

Testing and quality assurance are essential for delivering reliable software. Automated testing is a key component of modern engineering productivity, helping to improve code quality and detect issues early in the software development lifecycle. This section covers tools that assist teams in maintaining high standards throughout the development process.

13. Trunk

Unified CI, linting, testing, formatting, and code quality automation.

Trunk detects:

  • Flaky tests
  • CI instability
  • Consistency gaps
  • Code hygiene deviations

DevEx impact:
Less friction, fewer broken builds, cleaner code.

14. QA Wolf

End-to-end testing as a service.

Great for teams that need rapid coverage expansion without hiring a QA team.

15. Reflect

AI-native front-end testing.

Reflect generates maintainable tests and auto-updates scripts based on UI changes.

16. Codium AI

Test generation + anomaly detection for complex logic.

Especially useful for understanding AI-generated code that feels opaque or for gaining insights into DevOps and Platform Engineering distinctions in modern software practices.

CI/CD, Build Systems & Deployment

These platforms help automate and manage CI/CD, build systems, and deployment. They also facilitate cloud deployment by enabling efficient application rollout across cloud environments, and streamline software delivery through automation and integration.

17. GitHub Actions

Still the most widely adopted CI/CD platform.

2026 enhancements:

  • AI-driven pipeline optimization
  • Automated caching heuristics
  • Dependency risk detection
  • Dynamic workflows

18. Dagger

Portable, programmable pipelines that feel like code.

Excellent DevEx because:

  • Declarative pipelines
  • Local reproducibility
  • Language-agnostic DAGs
  • Cleaner architecture

19. BuildJet

Fast, cost-efficient runners for GitHub Actions.

DevEx boost:

  • Predictable build times
  • Less CI waiting
  • Lower compute cost
  • Improve your workflow with code quality tools

20. Railway

A modern PaaS for quick deploys.

Great for:

Knowledge, Documentation & Organizational Memory

Effective knowledge management is crucial for any team, especially when it comes to documentation and organizational memory. Some platforms allow teams to integrate data from multiple sources into customizable dashboards, enhancing data accessibility and collaborative analysis. These tools also play a vital role in API development by streamlining the design, testing, and collaboration process for APIs, ensuring teams can efficiently build and maintain robust API solutions. Additionally, documentation and API development tools facilitate sending, managing, and analyzing API requests, which improves development efficiency and troubleshooting. Gitpod, a cloud-based IDE, provides automated, pre-configured development environments, further simplifying the setup process and enabling developers to focus on their core tasks.

21. Notion AI

The default knowledge base for engineering teams.

Unmatched in:

  • Knowledge synthesis
  • Auto-documentation
  • Updating stale docs
  • High-context search

22. Mintlify

Documentation for developers, built for clarity.

Great for API docs, SDK docs, product docs.

23. Swimm

Continuous documentation linked directly to code.

Key DevEx benefit: Reduces onboarding time by making code readable.

Communication, Collaboration & Context Sharing

Effective communication and context sharing are crucial for successful project management. Engineering managers use collaboration tools to gather insights, improve team efficiency, and support human-centered software development. These tools not only streamline information flow but also facilitate team collaboration and efficient communication among team members, leading to improved project outcomes. Additionally, they enable developers to focus on core application features by streamlining communication and reducing friction.

24. Slack

Still the async backbone of engineering.

New DevEx features include:

For guidance on running effective and purposeful engineering team meetings, see 8 must-have software engineering meetings - Typo.

  • AI summarization
  • Thread collapsing
  • PR digest channels
  • Contextual notifications

25. Loom

Rapid video explanations that eliminate long review comments.

DevEx value:

  • Reduces misunderstandings
  • Accelerates onboarding
  • Cuts down review time

26. Arc Browser

The browser engineers love.

Helps with:

  • Multi-workspace layouts
  • Fast tab grouping
  • Research-heavy workflows

Engineering Intelligence & DevEx Measurement Tools

This is where DevEx moves from intuition to intelligence, with tools designed for measuring developer productivity as a core capability. These tools also drive operational efficiency by providing actionable insights that help teams streamline processes and optimize workflows.

27. Typo

Typo is an engineering intelligence platform that helps teams understand how work actually flows through the system and how that affects developer experience. It combines delivery metrics, PR analytics, AI-impact signals, and sentiment data into a single DevEx view.

What Typo does for DevEx

  1. Delivery & Flow Metrics
    Typo provides clear, configurable views across DORA and SPACE-aligned metrics, including cycle-time percentiles, review latency, deployment patterns, and quality signals. These help leaders understand where the system slows developers down.
  2. PR & Review Analytics
    Deeper visibility into how pull requests move: idle time, review wait time, reviewer load, PR size patterns, and rework cycles. This highlights root causes of slow reviews and developer frustration.
  3. AI-Origin Code & Rework Insights
    Typo surfaces where AI-generated code lands, how often it changes, and when AI-assisted work leads to downstream fixes or churn. This helps leaders measure AI's real impact rather than assuming benefit.
  4. Burnout & Risk Indicators
    Typo does not “diagnose” burnout but surfaces early patterns—sustained out-of-hours activity, heavy review queues, repeated spillover—that often precede morale or performance dips.
  5. Benchmarks & Team Comparisons
    Side-by-side team patterns show which practices reduce friction and which workflows repeatedly break DevEx.
Typo serves as the control system of modern engineering organizations. Leaders use Typo to understand how the team is actually working, not how they believe they're working.

28. GetDX

The research-backed DevEx measurement platform

GetDX provides:

  • High-quality DevEx surveys
  • Deep organizational breakdowns
  • Persona-based analysis
  • Benchmarking across 180,000+ samples
  • Actionable, statistically sound insights

Why CTOs use it:
GetDX provides the qualitative foundation — Typo provides the system signals. Together, they give leaders a complete picture.

Internal Developer Experience

Internal Developer Experience (IDEx) serves as the cornerstone of engineering velocity and organizational efficiency for development teams across enterprises. In 2026, forward-thinking organizations recognize that empowering developers to achieve optimal performance extends far beyond mere repository access—it encompasses architecting comprehensive ecosystems where internal developers can concentrate on delivering high-quality software solutions without being encumbered by convoluted operational overhead or repetitive manual interventions that drain cognitive resources. OpsLevel, designed as a uniform interface for managing services and systems, offers extensive visibility and analytics, further enhancing the efficiency of internal developer platforms.

Contemporary internal developer platforms, sophisticated portals, and bespoke tooling infrastructures are meticulously engineered to streamline complex workflows, automate tedious and repetitive operational tasks, and deliver real-time feedback loops with unprecedented precision. Through seamless integration of disparate data sources and comprehensive API management via unified interfaces, these advanced systems enable developers to minimize time allocation toward manual configuration processes while maximizing focus on creative problem-solving and innovation. This paradigm shift not only amplifies developer productivity metrics but also significantly reduces developer frustration and cognitive burden, empowering engineering teams to innovate at accelerated velocities and deliver substantial business value with enhanced efficiency.

A meticulously architected internal developer experience enables organizations to optimize operational processes, foster cross-functional collaboration, and ensure development teams can effortlessly manage API ecosystems, integrate complex data pipelines, and automate routine operational tasks with machine-learning precision. The resultant outcome is a transformative developer experience that supports sustainable organizational growth, cultivates collaborative engineering cultures, and allows developers to concentrate on what matters most: building robust software solutions that align with strategic organizational objectives and drive competitive advantage. By strategically investing in IDEx infrastructure, companies empower their engineering talent, reduce operational complexity, and cultivate environments where high-quality software delivery becomes the standard operational paradigm rather than the exception.

  • Cursor: AI-native IDE that provides multi-file reasoning, high-quality refactors, and project-aware assistance for internal services and platform code.
  • Windsurf: AI-enabled IDE focused on large-scale transformations, automated migrations, and agent-assisted changes across complex internal codebases.
  • JetBrains AI: AI capabilities embedded into JetBrains IDEs that enhance navigation, refactoring, and code generation while staying aligned with existing project structures. JetBrains offers intelligent code completion, powerful debugging, and deep integration with various frameworks for languages like Java and Python.

API Development and Management

API development and management have emerged as foundational pillars within modern Software Development Life Cycle (SDLC) methodologies, particularly as enterprises embrace API-first architectural paradigms to accelerate deployment cycles and foster technological innovation. Modern API management platforms enable businesses to accept payments, manage transactions, and integrate payment solutions seamlessly into applications, supporting a wide range of business operations. Contemporary API development frameworks and sophisticated API gateway solutions empower development teams to architect, construct, validate, and deploy APIs with remarkable efficiency and precision, enabling engineers to concentrate on core algorithmic challenges rather than becoming encumbered by repetitive operational overhead or mundane administrative procedures.

These comprehensive platforms revolutionize the entire API lifecycle management through automated testing orchestration, stringent security protocol enforcement, and advanced analytics dashboards that deliver real-time performance metrics and behavioral insights. API management platforms often integrate with cloud platforms to provide deployment automation, scalability, and performance optimization. Automated testing suites integrated with continuous integration/continuous deployment (CI/CD) pipelines and seamless version control system synchronization ensure API robustness and reliability across distributed architectures, significantly reducing technical debt accumulation while supporting the delivery of enterprise-grade applications with enhanced scalability and maintainability. Through centralized management of API request routing, response handling, and comprehensive documentation generation within a unified dev environment, engineering teams can substantially enhance developer productivity metrics while maintaining exceptional software quality standards across complex microservices ecosystems and distributed computing environments.

API management platforms facilitate seamless integration with existing workflows and major cloud infrastructure providers, enabling cross-functional teams to collaborate more effectively and accelerate software delivery timelines through optimized deployment strategies. By supporting integration with existing workflows, these platforms improve efficiency and collaboration across teams. Featuring sophisticated capabilities that enable developers to orchestrate API lifecycles, automate routine operational tasks, and gain deep insights into code behavior patterns and performance characteristics, these advanced tools help organizations optimize development processes, minimize manual intervention requirements, and empower engineering teams to construct highly scalable, security-hardened, and maintainable API architectures. Ultimately, strategic investment in modern API development and management solutions represents a critical imperative for organizations seeking to empower development teams, streamline comprehensive software development workflows, and deliver exceptional software quality at enterprise scale.

  • Postman AI: AI-powered capabilities in Postman that help design, test, and automate APIs, including natural-language driven flows and agent-based automation across collections and environments.
  • Hoppscotch AI features: Experimental AI features in Hoppscotch that assist with renaming requests, generating structured payloads, and scripting pre-request logic and test cases to simplify API development workflows. +1
  • Insomnia AI: AI support in Insomnia that enhances spec-first API design, mocking, and testing workflows, including AI-assisted mock servers and collaboration for large-scale API programs.

Real Patterns Seen in AI-Era Engineering Teams

Across 150+ engineering orgs from 2024–2026, these patterns are universal:

  • PR counts rise 2–5x after AI adoption
  • Review bottlenecks become the #1 slowdown
  • Semantic drift becomes the #1 cause of incidents
  • Developers report higher stress despite higher output
  • Teams with fewer tools but clearer workflows outperform larger teams
  • DevEx emerges as the highest-leverage engineering investment

Good DevEx turns AI-era chaos into productive flow, enabling software development teams to benefit from improved workflows. This is essential for empowering developers, enabling developers, and ensuring that DevEx empowers developers to manage their workflows efficiently. Streamlined systems allow developers to focus on core development tasks and empower developers to deliver high-quality software.

Instrumentation & Architecture Requirements for DevEx

A CTO cannot run an AI-enabled engineering org without instrumentation across:

  • PR lifecycle transitions
  • Review wait times
  • Review quality
  • Rework and churn
  • AI-origin code hotspots
  • Notification floods
  • Flow fragmentation
  • Sentiment drift
  • Meeting load
  • WIP ceilings
  • Bottleneck transitions
  • System health over time
  • Automation capabilities for monitoring and managing workflows
  • The adoption of platform engineering practices and an internal developer platform to automate and streamline workflows, ensuring efficient software delivery.
  • Leveraging self service infrastructure to enable developers to independently provision and manage resources, increasing productivity and reducing operational bottlenecks.

Internal developer platforms provide a unified environment for managing infrastructure, infrastructure management, and providing self service capabilities to development teams. These platforms simplify the deployment, monitoring, and scaling of applications across cloud environments by integrating with cloud native services and cloud infrastructure. Internal Developer Platforms (IDPs) empower developers by providing self-service capabilities for tasks such as configuration, deployment, provisioning, and rollback. Many organizations use IDPs to allow developers to provision their own environments without delving into infrastructure's complexity. Backstage, an open-source platform, functions as a single pane of glass for managing services, infrastructure, and documentation, further enhancing the efficiency and visibility of development workflows.

It is essential to ensure that the platform aligns with organizational goals, security requirements, and scaling needs. Integration with major cloud providers further facilitates seamless deployment and management of applications. In 2024, leading developer experience platforms focus on providing a unified, self-service interface to abstract away operational complexity and boost productivity. By 2026, it is projected that 80% of software engineering organizations will establish platform teams to streamline application delivery.

A Modern DevEx Mental Model (2026)

Flow
Can developers consistently get uninterrupted deep work? These platforms consolidate the tools and infrastructure developers need into a single, self-service interface, focusing on autonomy, efficiency, and governance.

Clarity
Do developers understand the code, context, and system behavior quickly?

Quality
Does the system resist drift or silently degrade?

Energy
Are work patterns sustainable? Are developers burning out?

Governance
Does AI behave safely, predictably, and traceably?

This is the model senior leaders use.

Wrong vs. Right DevEx Mindsets

Wrong

  • “DevEx is about happiness.”
  • “AI increases productivity automatically.”
  • “More tools = better experience.”
  • “Developers should just adapt.”

Right

  • DevEx is about reducing systemic friction.
  • AI amplifies workflow quality — good or bad.
  • Fewer, integrated tools outperform sprawling stacks.
  • Leaders must design sustainable engineering systems.

Governance & Ethical Guardrails

Strong DevEx requires guardrails:

  • Traceability for AI-generated code
  • Codebase-level governance policies
  • Model routing rules
  • Privacy and security controls
  • Infrastructure configuration management
  • Clear ownership of AI outputs
  • Change attribution
  • Safety reviews

Governance isn't optional in AI-era DevEx.

How CTOs Should Roll Out DevEx Improvements

  1. Instrument everything with Typo or GetDX.You cannot fix what you cannot see.
  2. Fix foundational flow issues.PR size, review load, WIP, rework cycles.
  3. Establish clear AI coding and review policies.Define acceptable patterns.
  4. Consolidate the toolchain.Eliminate redundant tools.
  5. Streamline workflows to improve efficiency and automation. Optimize software development processes to remove complexity and increase efficiency, reducing manual effort and enhancing productivity.
  6. Train tech leads on DevEx literacy.Leaders must understand system-level patterns.
  7. Review DevEx monthly at the org level and weekly at the team level.

Developer Experience in 2026 determines the durability of engineering performance. AI enables more code, more speed, and more automation — but also more fragility.

The organizations that thrive are not the ones with the best AI models. They are the ones with the best engineering systems.

Strong DevEx ensures:

  • stable flow
  • predictable output
  • consistent architecture
  • reduced rework
  • sustainable work patterns
  • high morale
  • durable velocity
  • enables innovative solutions

The developer experience tools listed above — Cursor, Windsurf, Linear, Trunk, Notion AI, Reclaim, Height, Typo, GetDX — form the modern DevEx stack for engineering leaders in 2026.

If you treat DevEx as an engineering discipline, not a perk, your team's performance compounds.

Conclusion

As we analyze upcoming trends for 2026, it's evident that Developer Experience (DevEx) platforms have become mission-critical components for software engineering teams leveraging Software Development Life Cycle (SDLC) optimization to deliver enterprise-grade applications efficiently and at scale. By harnessing automated CI/CD pipelines, integrated debugging and profiling tools, and seamless API integrations with existing development environments, these platforms are fundamentally transforming software engineering workflows—enabling developers to focus on core objectives: architecting innovative solutions and maximizing Return on Investment (ROI) through accelerated development cycles.

The trajectory of DevEx platforms demonstrates exponential growth potential, with rapid advancements in AI-powered code completion engines, automated testing frameworks, and real-time feedback mechanisms through Machine Learning (ML) algorithms positioned to significantly enhance developer productivity metrics and minimize developer experience friction. The continued adoption of Internal Developer Platforms (IDPs) and low-code/no-code solutions will empower internal development teams to architect enterprise-grade applications with unprecedented velocity and microservices scalability, while maintaining optimal developer experience standards across the entire development lifecycle.

For organizations implementing digital transformation initiatives, the strategic approach involves optimizing the balance between automation orchestration, tool integration capabilities, and human-driven innovation processes. By investing in DevEx platforms that streamline CI/CD workflows, facilitate cross-functional collaboration, and provide comprehensive development toolchains for every phase of the SDLC methodology, enterprises can maximize the performance potential of their engineering teams and maintain competitive advantage in increasingly dynamic market conditions through Infrastructure as Code (IaC) and DevOps integration.

Ultimately, prioritizing developer experience optimization transcends basic developer enablement or organizational perks—it represents a strategic imperative that accelerates innovation velocity, reduces technical debt accumulation, and ensures consistent delivery of high-quality software through automated quality assurance and continuous integration practices. As the technological landscape continues evolving with AI-driven development tools and cloud-native architectures, organizations that embrace this strategic vision and invest in comprehensive DevEx platform ecosystems will be optimally positioned to spearhead the next generation of digital transformation initiatives, empowering their development teams to architect software solutions that define future industry standards.

FAQ

1. What's the strongest DevEx tool for 2026?

Cursor for coding productivity, Trunk for stability, Linear for clarity, Typo for measurement, and code review

2. How often should we measure DevEx?

Weekly signals + monthly deep reviews.

3. How do AI tools impact DevEx?

AI accelerates output but increases drift, review load, and noise. DevEx systems stabilize this.

4. What's the biggest DevEx mistake organizations make?

Thinking DevEx is about perks or happiness rather than system design.

5. Are more tools better for DevEx?

Almost always no. More tools = more noise. Integrated workflows outperform tool sprawl.

View All