For agile teams, tracking productivity can quickly become overwhelming, especially when too many metrics clutter the process. Agile metrics are quantitative tools used by agile software development teams to assess productivity, track team performance, and monitor progress. Many teams feel they’re working hard without seeing the progress they expect. By focusing on a handful of high-impact JIRA metrics, teams can gain clear, actionable insights that streamline decision-making and help them stay on course.
Delivery speed is a key metric for Agile teams, measuring how quickly teams can release software and playing a crucial role in supporting continuous delivery.
Selecting 3-5 key metrics that align with project objectives helps avoid data overload and ensures clarity.
These five essential metrics highlight what truly drives productivity, enabling teams to make informed adjustments that propel their work forward.
Agile teams often face missed deadlines, unclear priorities, and resource management issues. Key performance indicators (KPIs) are essential metrics for evaluating project success and progress, helping teams measure whether they are meeting their goals. Without effective metrics, these issues remain hidden, leading to frustration. JIRA metrics provide clarity on team performance, enabling early identification of bottlenecks and allowing teams to stay agile and efficient. By tracking just a few high-impact metrics, teams can make informed, data-driven decisions that improve workflows and outcomes.
However, metrics can be a double-edged sword, as they can either provide valuable insights or create a toxic environment if misused. If used punitively, teams may inflate metrics to appear better without achieving actual program goals.
Excessive focus on performance metrics can lead to tunnel vision, neglecting qualitative aspects of development.
It’s equally important to balance quantitative metrics with qualitative feedback, as both are essential for enhancing team performance in an agile environment and fostering a healthy team culture. Additionally, metrics should align with the program and portfolio’s goals to be effective and meaningful.
In today's rapidly evolving agile development ecosystems, data-driven decision-making frameworks serve as the foundational architecture for successful project orchestration and delivery optimization. JIRA empowers agile development teams with comprehensive analytics capabilities and key performance indicators (KPIs) that facilitate intelligent, metrics-based strategic choices throughout every phase of the software development lifecycle. By implementing consistent performance tracking methodologies through critical metrics such as story points velocity, cycle time optimization, and lead time analysis, development teams establish clear visibility into their operational efficiency and can execute tactical adjustments to maximize project outcomes and delivery throughput.
Consider the strategic implementation of story points completion tracking across sprint iterations—this approach enables development teams to evaluate whether their sprint capacity planning aligns with actual execution capabilities, thereby facilitating enhanced estimation accuracy and optimal resource distribution strategies. Deep-dive analysis of cycle time patterns and lead time metrics delivers actionable intelligence regarding workflow velocity from initial requirement inception through final deployment completion, enabling teams to pinpoint process bottlenecks and implement streamlined workflow optimizations. When development teams detect anomalous spikes in cycle time performance, they can initiate comprehensive root cause analysis—examining potential process inefficiencies, resource allocation constraints, or dependency management issues—and deploy targeted remediation strategies to resolve performance degradation.
Through strategic metrics leverage and comprehensive data analysis, agile development teams can systematically identify optimization opportunities, implement intelligent resource allocation algorithms, and maintain strict alignment with project objectives and delivery timelines. This data-driven operational approach not only accelerates continuous improvement initiatives but also enhances customer satisfaction metrics by ensuring predictable delivery schedules and superior quality deliverables. Ultimately, leveraging JIRA's comprehensive analytics platform empowers development teams to execute informed strategic decisions that drive both immediate operational progress and sustainable long-term project success across the entire development ecosystem.
Work In Progress (WIP) measures the number of tasks actively being worked on. Setting WIP limits, which are commonly applied on a kanban board, encourages teams to complete existing tasks before starting new ones. This reduces task-switching, increases focus, and improves overall workflow efficiency.
When identifying bottlenecks, teams can use metrics such as wait times to measure delays in workflow stages and pinpoint where issues are accumulating. These metrics help teams identify areas in the process that require attention and improvement.
A Cumulative Flow Diagram (CFD) is a useful tool for visualizing WIP. CFDs show how work items move through different stages such as ‘To Do’, ‘In Progress’, ‘In Review’, and ‘Done’, helping teams monitor workflow progress and identify bottlenecks. If the CFD widens in a specific status, it indicates a bottleneck where work is accumulating.
Setting WIP limits: On JIRA Kanban boards, the development team can set WIP limits for each stage, like “In Progress” or “Review.” This helps the development team manage workload, prevents overloading, and maintains steady productivity without overwhelming team members.
Identifying bottlenecks: WIP metrics highlight bottlenecks in real time. If tasks accumulate in a specific stage (e.g., “In Review”), it signals a need to address delays, such as availability of reviewers or unclear review standards.
Using cumulative flow diagrams: JIRA’s cumulative flow diagrams visualize WIP across stages, showing where tasks are getting stuck and helping teams keep workflows balanced. WIP metrics in these diagrams also help track team performance by providing insights into workflow efficiency.
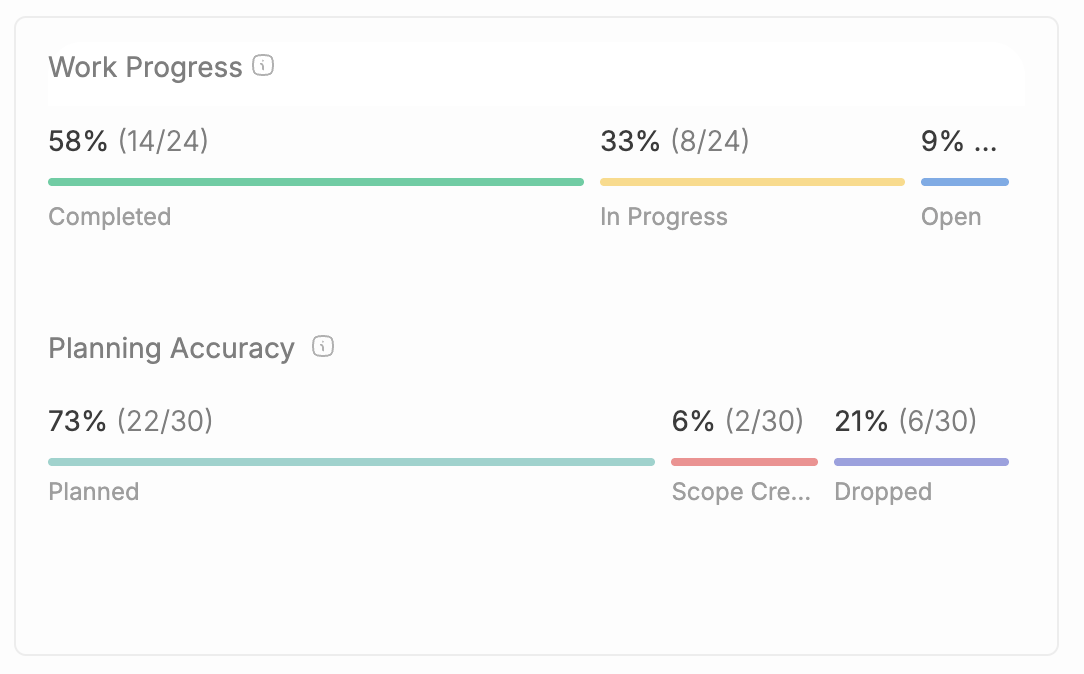
Planning plays a vital role in helping agile teams maintain a clear overview of how work is distributed, manage scope creep effectively, and keep track of dropped tasks. Breaking down planned work into Epics, Stories, and backlog items provides clarity on resource allocation and ensures all project components receive the right attention. Monitoring scope creep is essential to avoid timeline disruptions and resource overload; by tracking scope changes and their impact in JIRA, teams can make informed decisions to stay on course. Additionally, keeping an eye on dropped work allows teams to understand shifting priorities and adjust plans accordingly. This comprehensive planning approach helps maintain balanced workloads, supports sprint goals, and keeps projects aligned with overall objectives.
Epic and Story breakdown: Use JIRA to structure work hierarchically by creating Epics and breaking them down into Stories and backlog items. This helps visualize the scope and allocate resources effectively.
Scope change tracking: Leverage JIRA’s issue history and custom fields to monitor changes in scope during sprints or releases. Setting up alerts for scope modifications helps teams react promptly to potential scope creep.
Dropped work monitoring: Track tasks that are removed or deprioritized using JIRA filters and reports to understand shifting priorities and their impact on sprint goals.
Resource allocation dashboards: Configure dashboards displaying workload distribution across Epics and Stories to ensure balanced assignment and prevent overloading team members.
Sprint reports and burndown charts: Utilize sprint reports and sprint burndown charts within JIRA to monitor progress against planned work, helping teams stay on track with sprint goals and identify any deviations early.
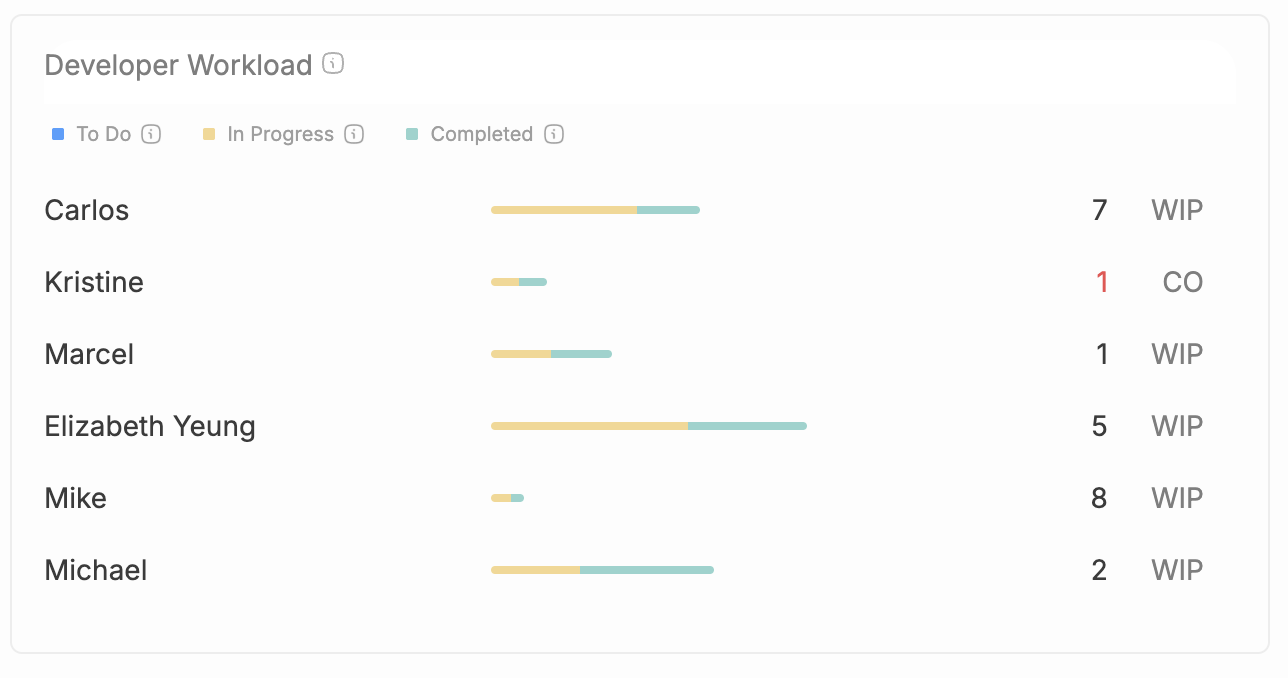
Developer Workload monitors the task volume and complexity assigned to each developer. By tracking developer workload, teams can use Jira metrics to analyze and improve the overall effectiveness of the team's work by moving beyond surface-level data to identify bottlenecks and root causes. Jira metrics provide actionable insights to measure and improve the team’s work, supporting greater productivity and efficiency. This metric ensures balanced workload distribution, preventing burnout and optimizing each developer’s capacity. Support tickets are also part of the workload that needs to be tracked and managed to ensure assignments remain balanced.
JIRA workload reports: Workload reports aggregate task counts, hours estimated, and priority levels for each developer. This helps project managers reallocate tasks if certain team members are overloaded. Additionally, tracking bug counts provides insight into the workload related to issue resolution and helps assess product quality over time.
Time tracking and estimation: JIRA allows developers to log actual time spent on tasks, making it possible to compare against estimates for improved workload planning. Tracking automated tests and their results is also important for monitoring software quality alongside workload.
Capacity-based assignment: Project managers can analyze workload data to assign tasks based on each developer’s availability and capacity, ensuring sustainable productivity.
Team Velocity measures the average amount of work completed by scrum teams in each sprint, establishing a baseline for sprint planning and setting realistic goals. Velocity is the average amount of work a scrum team completes during a sprint, measured in either story points or hours. By tracking velocity and using tools like burndown charts, teams can effectively monitor and visualize the team's progress toward sprint goals in real-time. Average velocity is calculated over several sprints to guide planning and forecasting, helping teams predict future performance and improve accuracy in release planning.
Velocity chart: JIRA’s Velocity Chart displays work completed versus planned work, helping teams gauge their performance trends and establish realistic goals for future sprints. Velocity reports provide visual analytics of completed work over time, allowing teams to assess consistency and predictability in their delivery.
Estimating story points: Story points assigned to tasks allow teams to calculate velocity and capacity more accurately, improving sprint planning and goal setting.
Historical analysis for planning: Historical velocity data enables teams to look back at performance trends, helping identify factors that impacted past sprints and optimizing future planning

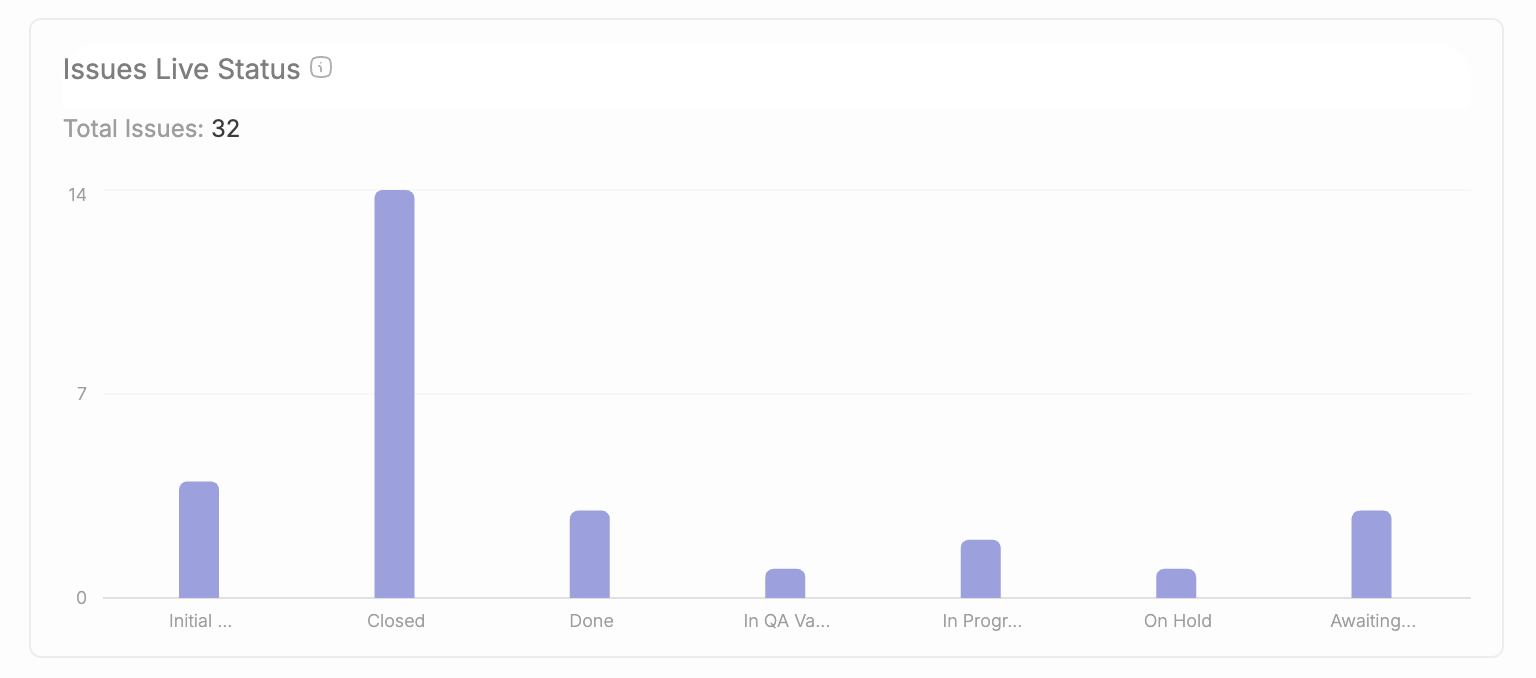
I.ssue Live Status is a crucial Jira metric that provides real-time visibility into where issues are currently stalled or progressing within your workflow stages, such as "In Progress," "In Development," "In QA," or any custom statuses defined in your issue tracker. By monitoring the live status of issues, teams can quickly identify bottlenecks and understand at which workflow stage work items are accumulating, enabling prompt intervention to maintain smooth delivery.
An essential aspect of Issue Live Status is the ageing graph, which visualizes how long issues have remained in a particular status. This helps teams detect stalled tasks and prioritize resolving blockers to prevent delays. Tracking issue ageing ensures that no task remains unattended for too long, improving overall workflow efficiency and predictability.
By integrating Issue Live Status monitoring into your Jira metrics strategy, teams gain actionable insights that drive continuous workflow optimization, reduce cycle times, and enhance delivery predictability.
Cycle Time tracks how long tasks take from start to completion, highlighting process inefficiencies. In software development, Jira Software is widely used to track cycle time and other key jira metrics, providing teams with valuable insights into their workflow. Shorter cycle times generally mean faster delivery.
Lead Time is another important metric, measuring the total time from request to delivery. It helps teams identify overall process gaps, handoffs, and communication issues. Lead time measures the total time elapsed from the moment an issue is created until it is marked as fully completed.
Control chart: Jira's Control Chart report is a key jira metric for visualizing lead times for completed issues, displaying how long tasks spend in each stage and helping to identify where delays occur. Monitoring issue aging is also important to ensure that work keeps moving and nothing falls through the cracks.
Custom workflows and time tracking: Customizable workflows allow teams to assign specific time limits to each stage, identifying areas for improvement and reducing Cycle Time.
SLAs for timely completion: For teams with service-level agreements, setting cycle-time goals can help track SLA adherence, providing benchmarks for performance.
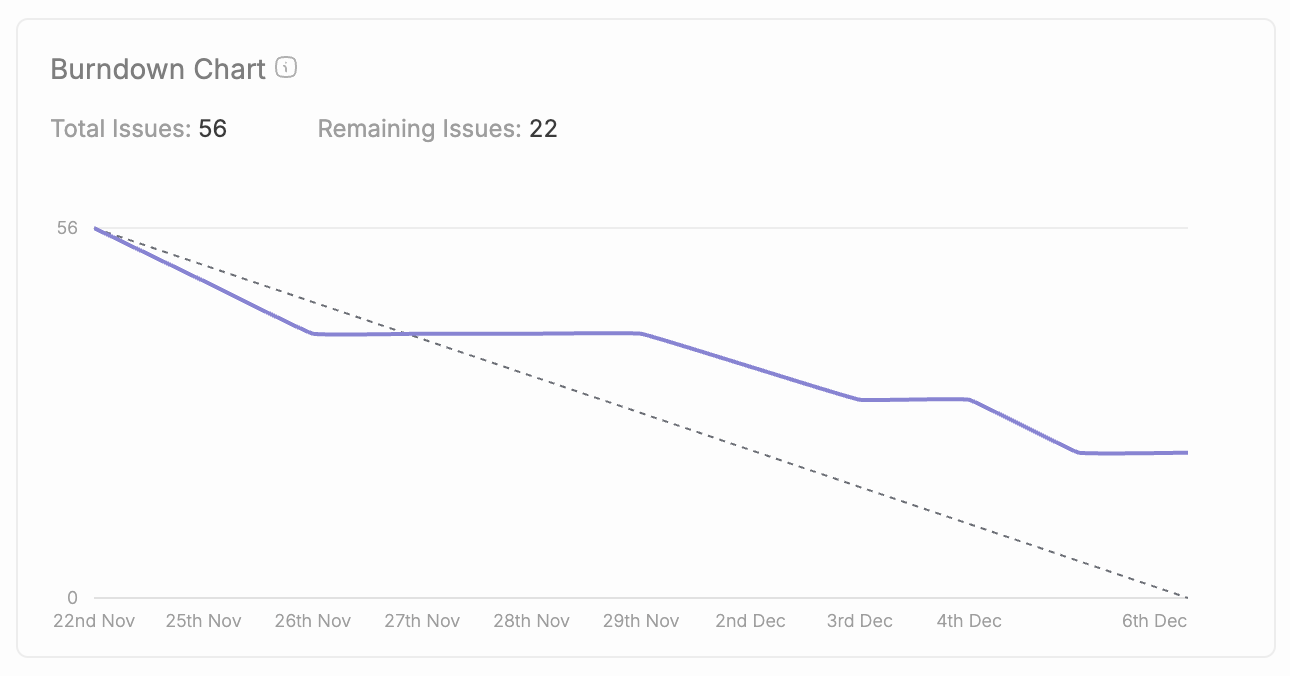
A Burndown Chart is a fundamental agile metric that visually represents the amount of work remaining in a sprint backlog over time. It helps agile teams monitor progress toward sprint goals by showing how quickly tasks are being completed and whether the team is on track to finish all planned work within the sprint duration. The chart typically plots time on the x-axis and remaining work (measured in story points, hours, or task count) on the y-axis, providing a clear, real-time overview of sprint progress.
Burndown charts are especially valuable for Scrum teams, enabling product owners, scrum masters, and development teams to identify scope creep, adjust workload, and forecast the likelihood of meeting sprint commitments. By analyzing the chart's slope and deviations, teams can detect potential bottlenecks early and take corrective actions to maintain steady progress.
By effectively leveraging burndown charts, agile teams gain actionable insights that improve sprint predictability, enhance transparency, and support continuous improvement in their delivery processes.
Cumulative Flow Diagrams (CFDs) represent a transformative agile metric that empowers teams to harness comprehensive insights into their workflow dynamics and operational efficiency. These sophisticated visualization tools elegantly capture the flow of work across distinct process stages—including backlog, in progress, review, and completion phases—while tracking temporal progressions with unprecedented clarity. By leveraging this advanced tracking methodology, agile teams can track progress and swiftly pinpoint bottlenecks and detect work accumulation patterns, whether they manifest in development cycles, review processes, or testing phases.
Analyzing cumulative flow patterns enables teams to orchestrate data-driven strategic decisions regarding resource optimization and process enhancement initiatives. When the “in progress” segment of the diagram exhibits sustained growth trajectories, it signals the necessity to investigate and remediate underlying systemic issues. This might encompass rebalancing team workload distribution, clarifying priority frameworks, or streamlining handoff mechanisms between sequential process stages to achieve optimal workflow efficiency.
CFDs also empower teams to maintain laser focus on sprint objectives by delivering comprehensive, visual intelligence regarding work progression through established processes. Through systematic cumulative flow analysis, teams can identify critical areas requiring intervention, ensure harmonized workflow distribution, and maintain project momentum on predetermined trajectories. Ultimately, CFDs transform teams’ capability to monitor progress, detect operational bottlenecks, and continuously refine their processes using real-time data intelligence that drives sustained performance improvements.
For engineering leaders who aim to establish and drive high-performance software delivery capabilities, DORA metrics provide a comprehensive, data-driven methodology for measuring, analyzing, and systematically improving software delivery processes. These four fundamental metrics—deployment frequency, lead time for changes, mean time to recovery (MTTR), and change failure rate (CFR)—collectively constitute a holistic framework that enables development organizations to gain unprecedented visibility into their team's operational effectiveness and delivery capabilities.
Through the systematic and consistent tracking of these comprehensive DORA metrics, engineering leaders gain the analytical capabilities necessary to identify specific optimization opportunities, such as streamlining lead time reduction initiatives or implementing strategies to increase deployment frequency cadence. This data-driven analytical approach facilitates evidence-based decision making processes, supports continuous improvement methodologies, and enables development teams to deliver high-quality software solutions with enhanced reliability and consistency. DORA metrics prove invaluable for engineering leaders who seek to systematically optimize team performance outcomes and ensure strategic alignment with broader organizational business objectives and operational goals.
To optimize the strategic value derived from JIRA metrics implementation, agile development teams must establish a comprehensive framework of sophisticated practices that ensure precision in data collection, meaningful analytical insights, and actionable outcomes that drive organizational efficiency. How can teams achieve this level of sophistication? Tracking relevant metrics, such as defect data, helps teams monitor defect trends, improve code quality, and prioritize testing and process improvements. The foundation lies in leveraging automated data aggregation mechanisms for critical performance indicators—including lead time calculations, cycle time measurements, and defect density tracking—through JIRA’s native automation capabilities and integrated testing frameworks. This systematic approach eliminates manual data collection overhead while maintaining real-time data integrity and ensuring continuous availability of accurate performance metrics.
The strategic utilization of velocity reporting mechanisms serves as a cornerstone for informed sprint planning methodologies and establishes realistic performance benchmarks derived from comprehensive historical performance analysis. These analytical reports provide development teams with deep insights into their delivery throughput patterns and enable sophisticated adjustments to future sprint configurations for optimal resource allocation and outcome optimization. Similarly, the continuous monitoring of cumulative flow diagram analytics proves equally critical, as these visualization tools deliver comprehensive overviews of work distribution patterns across development pipelines and facilitate real-time identification of process bottlenecks and workflow inefficiencies.
Continuous process improvement methodologies should constitute the fundamental core of your metrics-driven strategy framework. How does this translate into practical implementation? Organizations must establish regular analytical review cycles for key performance indicators and leverage the derived insights to systematically refine development processes, address operational inefficiencies, and celebrate milestone achievements. The integration of DORA metrics frameworks—encompassing deployment frequency analytics and lead time optimization—can significantly enhance organizational understanding of software delivery performance characteristics and support sophisticated data-driven decision-making processes across development lifecycles.
Through the systematic implementation of these advanced practices, development teams can effectively transform raw performance data into valuable strategic insights, facilitate informed decision-making processes, and cultivate a culture of continuous improvement that maintains project trajectory alignment and ensures teams operate at peak performance levels across all development phases.
Effectively setting up and using JIRA metrics requires strategic configuration and the right tools to turn raw data into actionable insights. Here's a practical, step-by-step guide to configuring these metrics in JIRA for optimal tracking and collaboration. With Typo's integration, teams gain additional capabilities for managing, analyzing, and discussing metrics collaboratively.
Setting up dashboards in JIRA for metrics like Cycle Time, Developer Workload, and Team Velocity allows for quick access to critical data.
How to set up:
Typo’s sprint analysis offers an in-depth view of your team’s progress throughout a sprint, enabling engineering managers and developers to better understand performance trends, spot blockers, and refine future planning. Typo integrates seamlessly with JIRA sprint insights to provide real-time sprint insights, including data on team velocity, task distribution, and completion rates.
Key features of Typo’s sprint analysis:
Detailed sprint performance summaries: Typo automatically generates sprint performance summaries, giving teams a clear view of completed tasks, WIP, and uncompleted items.
Sprint progress tracking: Typo visualizes your team’s progress across each sprint phase, making it easy to monitor how the team is advancing toward sprint goals and quickly identify any impediments or bottlenecks. Sprint burndown charts are used to visualize the team's progress and the amount of work remaining in the sprint backlog over time, providing transparency and helping teams stay on track.
Velocity trend analysis: Track velocity over multiple sprints to understand performance patterns. Typo’s charts display average, maximum, and minimum velocities, helping teams make data-backed decisions for future sprint planning.
Typo enables engineering teams to go beyond JIRA’s native reporting by offering customizable reports. These reports allow teams to focus on specific metrics that matter most to them, creating targeted views that support sprint retrospectives and help track ongoing improvements.
Key benefits of Typo reports:
Customized metrics views: Typo’s reporting feature allows you to tailor reports by sprint, team member, or task type, enabling you to create a focused analysis that meets team objectives. These customized reports can also help teams predict and manage project timelines more accurately. One example is a custom dashboard that visualizes project predictability by tracking sprint velocity and scope changes over time, helping teams identify patterns and improve future planning.
Sprint performance comparison: Easily compare current sprint performance with past sprints to understand progress trends and potential areas for optimization.
Collaborative insights: Typo’s centralized platform allows team members to add comments and insights directly into reports, facilitating discussion and shared understanding of sprint outcomes.
Typo's Velocity Trend Analysis provides a comprehensive view of team capacity and productivity over multiple sprints, allowing managers to set realistic goals and adjust plans according to past performance data.
How to use:
Setting up automated alerts in JIRA and Typo helps teams stay on top of metrics without manual checking, ensuring that critical changes are visible in real-time.
How to set up:
Typo’s integration makes retrospectives more effective by offering a shared space for reviewing metrics and discussing improvement opportunities as a team, including metrics related to customer satisfaction.
How to use:
Read more: Moving beyond JIRA Sprint Reports
Scope creep - when a project’s scope expands beyond its original objectives—can disrupt project timelines, strain resources, and lead to project overruns. Monitoring scope creep is essential for agile teams that need to stay on track without sacrificing quality. The impact of scope creep may also vary depending on the team's specific goals and project type.
In JIRA, tracking scope creep involves setting clear boundaries for task assignments, monitoring changes, and evaluating their impact on team workload and sprint goals.
By closely monitoring and managing scope creep, agile teams can keep their projects within boundaries, maintain productivity, and make adjustments only when they align with strategic objectives.
JIRA stands as a transformative catalyst that reshapes agile team workflows far beyond conventional project management boundaries. By leveraging systematic tracking of critical metrics like cycle time, lead time, bug counts, and specifically how many defects are identified during and after development, teams can dive into vast datasets to uncover actionable trends and patterns that reveal unprecedented opportunities for process optimization. Tracking how many defects occur provides valuable insight into software development performance and helps assess the effectiveness of quality assurance processes. When lead time metrics demonstrate consistent increases across multiple sprint cycles, this signals potential bottlenecks that demand immediate strategic intervention and resource reallocation.
This data-driven analysis empowers teams to pinpoint specific optimization targets, whether streamlining handoff processes, facilitating dynamic resource redistribution, or refining workflow architectures for enhanced efficiency. JIRA’s comprehensive reporting capabilities automate progress monitoring toward planned release milestones, ensuring teams maintain strategic alignment with project timelines while generating actionable insights that guide focused effort allocation and decision-making processes.
Continuous improvement thrives through AI-enhanced commitment to regularly analyze and act on performance metrics that drive operational excellence. By harnessing JIRA’s advanced tracking capabilities to monitor progress trajectories, analyze emerging trends, and dynamically adjust strategic approaches, teams can optimize their workflows, deliver superior-quality products, and exceed customer expectations consistently. This intelligent, data-driven methodology not only supports sustainable organizational growth but also empowers teams to adapt swiftly within dynamic development environments that demand agility and precision.
While JIRA metrics serve as sophisticated analytics instruments that unlock comprehensive insights into team performance dynamics, development teams frequently encounter multifaceted implementation challenges that require systematic analysis and strategic resolution. The primary obstacle involves establishing robust data integrity frameworks that ensure metric accuracy and reliability across complex development workflows. This necessitates meticulous configuration of workflow schemas, custom field mappings, and user interface screens, coupled with comprehensive data validation protocols that guarantee the tracked information authentically represents the team's development lifecycle activities. Organizations must implement stringent data governance practices, including automated validation rules, field dependency configurations, and workflow transition validations that maintain data consistency across different project contexts and team structures.
Another prevalent challenge emerges from metric proliferation—the systematic tracking of excessive performance indicators creates analytical paralysis and diminishes strategic focus, making it increasingly difficult to identify critical performance drivers and actionable insights. To mitigate this complexity, development teams should implement focused metric frameworks that concentrate on strategically aligned key performance indicators, utilizing data-driven approaches to select metrics that directly correlate with organizational objectives and facilitate continuous improvement methodologies. This approach requires comprehensive team capability development, ensuring that team members possess advanced analytical skills to interpret complex metric patterns, derive meaningful insights from performance data, and leverage these analytics for informed decision-making processes rather than merely accumulating data repositories without strategic purpose.
By implementing focused metric selection strategies and utilizing comprehensive analytics frameworks to guide actionable performance improvements, development teams can systematically overcome these implementation challenges and transform JIRA metrics into sophisticated performance intelligence systems that drive measurable progress and organizational excellence. This transformation requires continuous monitoring of metric effectiveness, regular calibration of measurement approaches, and adaptive refinement of analytical processes to ensure sustained value delivery and strategic alignment with evolving organizational objectives.
Building a data-driven culture goes beyond tracking metrics; it's about engaging the entire team in understanding and applying these insights to support shared goals. By fostering collaboration and using metrics as a foundation for continuous improvement, teams can align more effectively and adapt to challenges with agility.
Regularly revisiting and refining metrics ensures they stay relevant and actionable as team priorities evolve. To see how Typo can help you create a streamlined, data-driven approach, schedule a personalized demo today and unlock your team's full potential.
JIRA metrics constitute a fundamental framework that empowers agile development teams to systematically analyze performance patterns, optimize workflow efficiency, and achieve strategic project objectives through data-driven methodologies. By diving into critical performance indicators such as cycle time analysis, lead time optimization, and velocity measurements, development teams gain unprecedented insights into their operational workflows, enabling them to implement evidence-based decisions that facilitate systematic process enhancement and continuous improvement cycles. These sophisticated metrics serve as powerful analytical tools that enable teams to identify workflow bottlenecks, streamline development processes, and maintain precise tracking mechanisms for monitoring progress toward sprint deliverables and comprehensive project milestones.
Nevertheless, development teams must navigate carefully around prevalent implementation challenges, including metric saturation scenarios and data integrity inconsistencies that can compromise analytical accuracy. By strategically focusing on a carefully curated selection of key performance indicators and leveraging these metrics to guide informed decision-making processes, agile teams can effectively transform raw performance data into actionable strategic momentum that drives operational excellence. Whether you function as a scrum master orchestrating team dynamics, a product owner defining strategic direction, or an engineering leader managing technical implementation, effectively leveraging JIRA metrics through systematic analysis will enable your development team to deliver superior software solutions with enhanced speed and reliability, while fostering an organizational culture centered on continuous improvement and operational optimization.
To comprehensively enhance your organization's proficiency in JIRA metrics implementation and optimization, a robust ecosystem of advanced resources and analytical tools is strategically available across multiple domains. Atlassian's comprehensive official documentation repository and structured learning modules provide systematic, step-by-step implementation guides for configuring JIRA's advanced reporting infrastructure and leveraging its sophisticated analytics capabilities for continuous process improvement and performance optimization. Enterprise-grade third-party integrations and specialized plugins significantly extend JIRA's native analytical capabilities, delivering advanced data visualization, real-time performance insights, predictive analytics, and customized dashboard configurations specifically tailored to address your development team's unique operational requirements and KPI tracking objectives.
Strategic engagement with specialized online communities and professional networks, particularly the Atlassian Community ecosystem and industry-specific user groups, enables development teams to systematically exchange proven methodologies, collaborate on complex technical challenges, and assimilate lessons learned from other agile development organizations' implementation experiences and performance metrics. By strategically leveraging these comprehensive resource networks and knowledge-sharing platforms, your development organization can systematically deepen its technical expertise, maintain alignment with emerging trends in agile project management methodologies, and maximize the operational impact and ROI of your metrics-driven development approach through data-informed decision-making processes.
Cumulative flow algorithms and issue count metrics serve as foundational analytical systems in agile development environments, delivering comprehensive workflow intelligence and throughput optimization capabilities to development teams. By implementing cumulative flow visualization systems, engineering teams can algorithmically monitor task progression across defined workflow states—including backlog repositories, active development queues, and completion stages—throughout project execution cycles. These analytical frameworks not only facilitate performance tracking mechanisms but also generate predictive insights regarding work accumulation patterns, enabling systematic identification of process bottlenecks that may compromise delivery velocity and system throughput.
Implementing issue count monitoring systems alongside cumulative flow analytics enables development teams to quantify task ingress and egress rates across individual workflow stages with mathematical precision. Anomalous spikes in issue count distributions at specific workflow nodes indicate potential process bottlenecks, triggering automated investigation protocols and systematic root cause analysis procedures. This data-driven methodology empowers engineering teams to execute informed resource allocation strategies, implement workflow configuration adjustments, and deploy process optimization algorithms, all of which represent critical components for sustaining high-performance development operations and maintaining optimal system throughput.
Through consistent monitoring of these analytical metrics, agile development teams can detect performance trends, predict workflow degradation patterns, and implement targeted optimization algorithms to enhance process efficiency. The resulting system delivers enhanced delivery pipeline predictability and operational efficiency, enabling development teams to achieve project execution objectives and deliver stakeholder value with improved reliability metrics. Ultimately, cumulative flow analytics and issue count monitoring systems function as essential technological components for any development organization committed to continuous process improvement and high-performance software delivery execution.


Implement engineering metrics, gather SDLC insights & set continuous improvement goals in your dev teams.
Try Live Demo
We're on a mission to build engaged, productive tech teams. Try it out for free!


Follow us on:


