
Sprint reports are a crucial part of the software development process. They help in gaining visibility into the team’s progress, how much work is completed, and the remaining tasks.
While there are many tools available for sprint reports, the JIRA sprint report stands out to be the most reliable one. Thousands of development teams use it on a day-to-day basis. However, as the industry shifts towards continuous improvement, JIRA’s limitations may impact outcomes.
So, what can be the right alternative for sprint reports? And what factors to be weighed when choosing a sprint reports tool?
Importance of analyzing sprint reports
Sprints are the core of agile and scrum frameworks. It represents defined periods for completing and reviewing specific work.
Sprint allows developers to focus on pushing out small, incremental changes over large sweeping changes. Note that, they aren’t meant to address every technical issue or wishlist improvement. It lets the team members outline the most important issues and how to address them during the sprint.
Analyzing progress through sprint reports is crucial for several reasons:
Transparency
Analyzing sprint reports ensures transparency among the team members. It includes an entire scrum or agile team that has a clear and shared view of work being done and pending tasks. There is no duplication of work since everything is visible to them.
Higher quality work
Sprint reports allow software development teams to have a clear understanding and requirements about their work. This allows them to focus on prioritized tasks first, fix bottlenecks in the early stages and develop the right solutions for the problems. For engineering leaders, these reports give them valuable insights into their performance and progress.
Higher productivity
Sprint reports eliminate unnecessary work and overcommitment for the team members. This allows them to allocate time more efficiently to the core tasks and let them discuss potential issues, risks and dependencies which further encourages continuous improvement. Hence, increasing the developers’ productivity and efficiency.
Optimize workflow
The sprint reports give team members a visual representation of how work is flowing through the system. It allows them to identify slowdowns or blockers and take corrective actions. Moreover, it allows them to make adjustments to their processes and workflow and prioritize tasks based on importance and dependencies to maximize efficiency.
JIRA sprint reports tick all of the benefits stated above. Here’s more to JIRA sprint reports:
JIRA sprint reports
Out of many sprint reporting software, JIRA Sprint Report stands out to be the out-of-the-box solution that is being used by many software development organizations. It is a great way to analyze team progress, keep everyone on track, and complete the projects on time.
You can easily create simple reports from the range of reports that can be generated from the scrum board:
Projects > Reports > Sprint report
There are many types of JIRA reports available for sprint analysis for agile teams. Some of them are:
- Sprint burndown charts: Burndown chart measures daily completed work, monitors the total work to be done, and sets intended deadlines.
- Burnup charts: It displays a sprint’s completed work in relation to its total scope.
- Velocity chart: Velocity chart shows a Scrum team’s average work completed per sprint.
- Cumulative flow diagram: It visually represents a Kanban team’s project progress over time.
- Control chart: It maps the Cycle Time or Lead Time of each issue over a specified period.
JIRA sprint reports are built into JIRA software, convenient and are easy to use. It helps developers understand the sprint goals, organize and coordinate their work and retrospect their performance.
However, few major problems make it difficult for the team members to rely solely on these reports.
What’s missing in JIRA sprint reports?
Measures through story points
JIRA sprint reports measure progress predominantly via story points. For teams who are not working with story points, JIRA reports aren’t of any use. Moreover, it sidelines other potential metrics as well. This makes it challenging to understand team velocities and get the complete picture.
Can be misinterpreted in different ways
Another limitation is that the team has to read between the lines since it presents the raw data to team members. This doesn’t give accurate insights of what truly happening in the organization. Rather every individual can come with slightly different conclusions and can be misunderstood and misinterpreted in different ways.
Limited capabilities
JIRA add-ons need installation and have a steep learning curve which may require training or technical expertise. They are also restricted to the JIRA system making it challenging to share with external stakeholders or clients.
So, what can be done instead? Either the JIRA sprint report can be supplemented with another tool or a better alternative that considers all of its limitations. The latter option proves to be the right option since a sprint dashboard that shows all the data and reports at a single place saves time and effort.
How does Typo leverage the sprint analysis reports?
Typo’s sprint analysis is a valuable tool for any team that is using an agile development methodology. It allows you to track and analyze your team’s progress throughout a sprint. It helps you gain visual insights into how much work has been completed, how much work is still in progress, and how much time is left in the sprint. This information can help you to identify any potential problems early on and take corrective action.
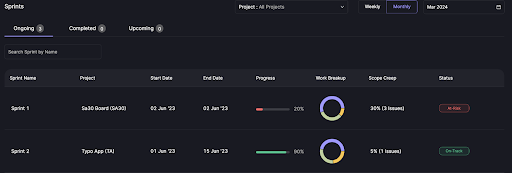
Our sprint analysis feature uses data from Git and issue management tools to provide insights into how your team is working. You can see how long tasks are taking, how often they’re being blocked, and where bottlenecks are occurring. This information can help you identify areas for improvement and make sure your team is on track to meet their goals.
It is easy to use and can be integrated with existing Git and Jira/Linear/Clickup workflows.
Key components of sprint analysis tool
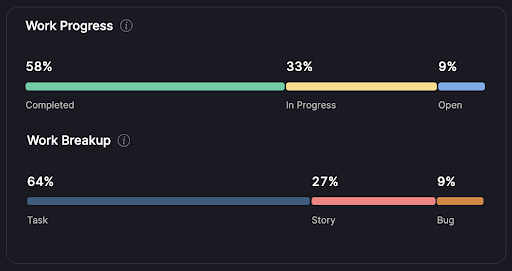
Work progress
Work progress represents the percentage breakdown of issue tickets or story points in the selected sprint according to their current workflow status.
How is it calculated?
Typo considers all the issues in the sprint and categorizes them based on their current status category, using JIRA status category mapping. It shows three major categories by default:
- Open
- In Progress
- Done
These can be configured as per your custom processes. In the case of a closed sprint, Typo only shows the breakup of work on a ‘Completed’ & ‘Not Completed’ basis.
Work breakup
Work breakup represents the percentage breakdown of issue tickets in the current sprint according to their issue type or labels. This helps in understanding the kind of work being picked in the current sprint and plan accordingly.
How is it calculated?
Typo considers all the issue tickets in the selected sprint and sums them up based on their issue type.
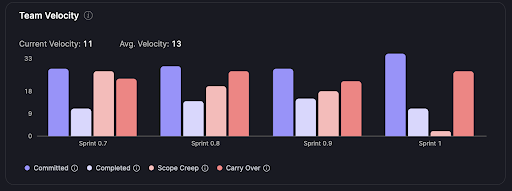
Team velocity
Team Velocity represents the average number of completed issue tickets or story points across each sprint.
How is it calculated?
Typo calculates Team Velocity for each sprint in two ways :
- For Issue Tickets: Typo calculates the sum of all the issue tickets completed in the sprint
- For Story Points: Typo calculates the sum of story Points for all the issue tickets completed in the sprint
To calculate the average velocity, the total number of completed issue tickets or story points are divided by the total number of allocated issue tickets or story points for each sprint.
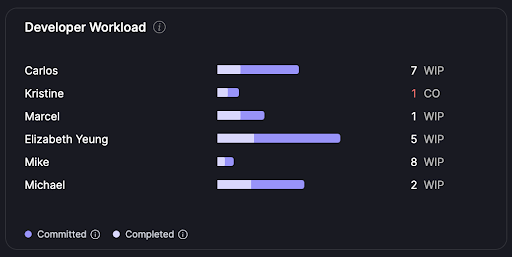
Developer workload
Developer Workload represents the count of issue tickets or story points completed by each developer against the total issue tickets/story points assigned to them in the current sprint.
Once the sprint is marked as ‘Closed’, it starts reflecting the count of Issue tickets/Story points that were not completed and were moved to later sprints as ‘Carry Over’.
How is it calculated?
Typo calculates the Developer Workload by considering all the issue tickets/story points assigned to each developer in the selected sprint and identifying the ones that have been marked as ‘Done’/’Completed’. Typo categorizes these issues based on their current workflow status that can be configured as per your custom processes.
The assignee of a ticket is considered in either of the two ways as a default:
- The developer assigned to the ticket at the time it was moved to ‘In Progress’
- Any custom field that represents the developer of that ticket
This logic is also configurable as per your custom processes.
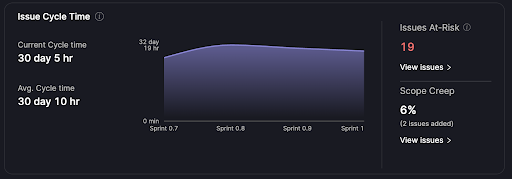
Issue cycle time
Issue cycle time represents the average time it takes for an issue ticket to transition from the ‘In Progress’ state to the ‘Completion’ state.
How is it calculated?
For all the ‘Done’/’Completed’ tickets in a sprint, Typo measures the time spent by each ticket to transition from ‘In Progress’ state to ‘Completion’ state.
By default, Typo considers 24 hours in a day and 7 day work week. This can be configured as per your custom processes.
Scope creep
Scope creep is one of the common project management risks. It represents the new project requirements that are added to a project beyond what was originally planned.
Typo’s sprint analysis tool monitors it to quantify its impact on the team’s workload and deliverables.
Conclusion
Sprint analysis tool is important for sprint planning, optimizing team performance and project outcomes in agile environments. By offering comprehensive insights into progress and task management, it empowers teams to focus on sprint goals, make informed decisions and drive continuous improvement.
To learn more about this tool, visit our website!