In the rapidly evolving world of DevOps, a DevOps metrics dashboard is essential to comprehend and improve your development and delivery workflows. This guide is intended for DevOps engineers, engineering managers, and operations teams seeking to implement or improve a DORA metrics dashboard using Typo. To evaluate and enhance the efficiency of these workflows, the DevOps Research and Assessment (DORA) metrics serve as a crucial tool.
This blog, specifically designed for Typo, offers a comprehensive guide on creating a DORA metrics dashboard that will help you optimize your DevOps performance.
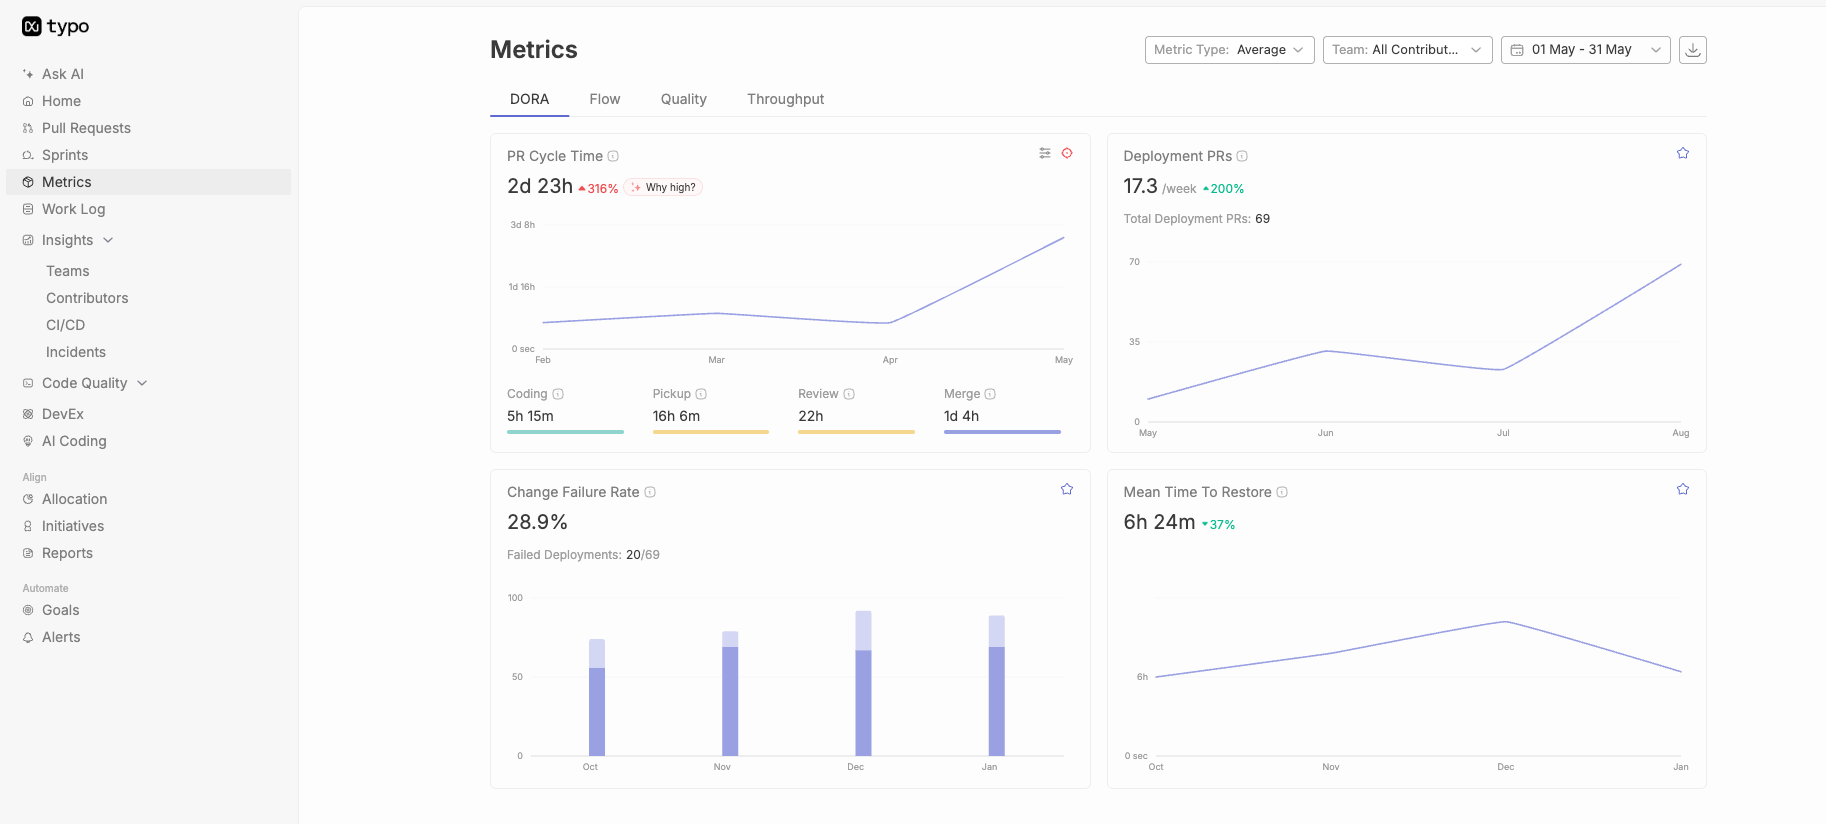
The DORA metrics consist of four key metrics:
DevOps metrics are essential for measuring the performance and effectiveness of your software delivery process. They help teams identify bottlenecks, track progress, and drive continuous improvement. A good devops dashboard serves as a centralized, real-time visual interface that consolidates key metrics, logs, and alerts from multiple sources to provide actionable insights and key insights. Organizations often use multiple dashboards to monitor different aspects of their DevOps ecosystem, such as CI/CD, infrastructure, security, incident response, and business metrics. This enables teams to monitor and optimize their DevOps workflows efficiently.
While there are many metrics you can track, the most impactful DevOps metrics focus on deployment frequency, lead time for changes, mean time to recovery, and change failure rate. The key elements of effective DevOps dashboards include integrating data from multiple sources, supporting the entire devops lifecycle, and surfacing actionable insights that empower teams to make informed decisions. Not all devops dashboards serve the same purpose or provide the same features—different dashboards are tailored for specific functions. Built in dashboards provided by DevOps platforms can often be customized to fit the unique needs of each team. A DevOps dashboard acts as a single source of truth for monitoring deployments, system uptime, and costs, ensuring comprehensive visibility across the pipeline.
A well-designed DevOps dashboard provides real-time insights into system health, application performance, and CI/CD processes, enabling teams to optimize workflows without switching between platforms. The ability to track metrics through dashboards and scorecards is crucial for effective engineering management and continuous improvement.
DevOps metrics are data points that reveal the performance of a DevOps software development pipeline and help identify bottlenecks in the process. DevOps metrics are the backbone of modern software delivery, providing organizations with the data needed to measure and enhance their DevOps performance. By systematically tracking key DevOps metrics such as deployment frequency and lead time for changes, teams gain critical visibility into their entire DevOps pipeline. It is especially important to track DORA metrics within CI/CD pipelines, and in some cases, this requires recording deployment events using APIs or custom integrations when standard deployment records are not available. These metrics help engineering managers and operations teams quickly identify performance bottlenecks, monitor the health of their deployment process, and ensure that business objectives are being met.
The most impactful DevOps metrics—deployment frequency, lead time for changes, change failure rate, and mean time to recovery—offer a comprehensive view of how efficiently and reliably a team deploys code to production. By analyzing these metrics, teams can pinpoint areas for improvement, reduce technical debt, and accelerate the delivery of high-quality software. Ultimately, tracking DevOps metrics empowers organizations to make data-driven decisions, optimize resource usage, and drive continuous improvement across the entire development lifecycle.
Deployment frequency measures the frequency of deployment of code to production or releases to end-users in a given time frame. Deployment frequency is a key metric for DevOps success, as it indicates how often a team achieves successful deployments to the production environment. It is calculated as the average number of successful deployments to production over a specified time period, such as daily or weekly, and deployment status updates in the devops metrics dashboard help track this metric in real time. High-performing teams achieve high deployment frequency, often deploying on demand multiple times a day, while lower-performing teams may only deploy weekly or monthly. Using industry benchmarks, you can compare your team's deployment frequency against broader standards to assess your DevOps maturity and responsiveness.
This metric measures the time between a commit being made and that commit making it to production. Lead time for changes is defined as the length of time between when a code change is committed to the trunk branch and when it is in a deployable state, such as passing all necessary pre-release tests. Tracking lead time allows teams to track performance and visualize the efficiency of their CI/CD pipelines, helping to identify bottlenecks and accelerate delivery. Over time, as team performance increases, lead time should decrease. High-performing teams typically measure lead times in hours, while medium and low-performing teams measure lead times in days, weeks, or even months.
Change failure rate measures the proportion of deployments to production that result in degraded services. The change failure rate is defined as the percentage of code changes that require hot fixes or other remediation after production, excluding failures caught by testing before deployment. Tracking DORA metrics like change failure rate is essential for understanding the reliability of your CI/CD processes. High-performing teams typically have change failure rates in the 0-15 percent range, reflecting effective deployment processes and automated testing. A high change failure rate may indicate issues such as lack of automated testing, poor change control, or brittle infrastructure.
This metric is also known as the mean time to restore. MTTR measures how long it takes to restore service after a partial service interruption or total system failure, making it a critical metric for incident management. High-performing teams typically recover from system failures in less than an hour, while lower-performing teams may take up to a week to restore service. The focus on MTTR, rather than the historical mean time between failures (MTBF), reflects the increased complexity of modern applications and the expectation that system failures will occur. Effective incident management processes help reduce MTTR and improve overall system reliability. It measures the time required to solve the incident i.e. service incident or defect impacting end-users.
These metrics provide valuable insights into the performance of your software development pipeline. By creating a well-designed dashboard, you can visualize these metrics and make informed decisions to improve your development process continuously.
Before you choose a platform for your DORA Metrics Dashboard, it's important to first define clear and measurable objectives. Consider the Key Performance Indicators (KPIs) that align with your organizational goals. Whether it's improving deployment speed, reducing failure rates, or enhancing overall efficiency, having a well-defined set of objectives will help guide your implementation of the dashboard.
When searching for a platform, it’s important to consider your goals and requirements, as well as the technical capabilities of the platform, such as its ability to integrate with existing tools and support your organization’s infrastructure. Look for a platform that is easy to integrate, scalable, and customizable. Different platforms, such as Typo, have unique features, so choose the one that best suits your organization’s needs and preferences. Some platforms offer built in dashboards that can be quickly implemented and customized to fit your team's requirements.
Gain a deeper understanding of the DevOps Research and Assessment (DORA) metrics by exploring the nuances of Deployment Frequency, Lead Time, Change Failure Rate, and MTTR. Engineering teams play a crucial role in understanding, organizing, and acting on DORA metrics to drive continuous improvement. Then, connect each of these metrics with your organization’s DevOps goals to have a comprehensive understanding of how they contribute towards improving overall performance and efficiency.
After choosing a platform, it's important to follow specific guidelines to properly configure your dashboard. Customize the widgets to accurately represent important metrics and personalize the layout to create a clear and intuitive visualization of your data. This ensures that your team can easily interpret the insights provided by the dashboard and take appropriate actions.
To ensure the accuracy and reliability of your DORA Metrics, it is important to establish strong data collection mechanisms. Configure your dashboard to collect real-time data from relevant sources, so that the metrics reflect the current state of your DevOps processes. This step is crucial for making informed decisions based on up-to-date information.
To optimize the performance of your DORA Metrics Dashboard, you can integrate automation tools. Integrating automation tools helps standardize and streamline development operations, making deployment processes more efficient. By utilizing automation for data collection, analysis, and reporting processes, you can streamline routine tasks. This will free up your team’s time and allow them to focus on making strategic decisions and improvements, instead of spending time on manual data handling.
To get the most out of your well-configured DORA Metrics Dashboard, use the insights gained to identify bottlenecks, streamline processes, and improve overall DevOps efficiency. Analyze the dashboard data regularly to drive continuous improvement initiatives and make informed decisions that will positively impact your software development lifecycle.
Aggregating diverse data sources into a unified dashboard is one of the biggest hurdles while building the DORA metrics dashboard.
For example, if the metrics to be calculated is ‘Lead time for changes’ and sources include a version control system in GIT, Issue tracking in Jira, and a Build server in Jenkins. The timestamps recorded in Git, Jira, and Jenkins may not be synchronized or standardized and they may capture data at different levels of granularity. Incident management dashboards often consolidate logs, error messages, deployment history, and infrastructure metrics to facilitate quicker root cause analysis and post-mortem investigations.
Another challenge is whether the dashboard effectively communicates the insights derived from the metrics.
Suppose, you want to get visualized insights for deployment frequency. You choose a line chart for the same. However, if the frequency is too high, the chart might become cluttered and difficult to interpret. Moreover, displaying deployment frequency without additional information can lead to misinterpretation of the metric. Visualizing system performance metrics, such as CPU usage, can be particularly challenging due to the volume and granularity of the data, making it harder to present clear and actionable insights. Resource utilization metrics, such as memory and storage usage, also present similar visualization challenges due to their complexity and data density.
Teams may fear that the DORA dashboard will be used for blame rather than the improvement. Moreover, if there's a lack of trust in the organization, they question the motives behind implementing metrics and doubt the fairness of the process.
Successfully implementing DevOps metrics requires a strategic approach that goes beyond simply collecting raw data. Start by identifying the key metrics that align with your organization’s business outcomes and DevOps goals.
Use multiple tools to pull data from various stages of your DevOps pipeline, ensuring comprehensive coverage of your entire tech stack. Integrating data from cloud infrastructure is essential for monitoring server uptime, resource utilization, and overall cloud health metrics. Integrating these data sources into a centralized visual interface—such as a well-designed DevOps dashboard—enables teams to display data in a way that is both actionable and easy to interpret.
To maximize the value of your metrics, prioritize automated testing, continuous integration, and continuous deployment. These practices not only improve the accuracy of your metrics but also help reduce cloud costs and streamline the deployment process.
Establish clear objectives for metrics collection and analysis, and regularly review your metrics to track progress and drive continuous improvement. By following these best practices, DevOps teams can measure DevOps performance effectively, gain insights into system health, and ensure that their efforts are directly contributing to improved business outcomes.
Typo, as a dynamic platform, provides a user-friendly interface and robust features tailored for DevOps excellence. Security teams can also leverage Typo's dashboards to monitor vulnerabilities, manage access logs, and ensure compliance with security standards.
Leveraging Typo for your DORA Metrics Dashboard offers several advantages:
Typo integrates with key DevOps tools and infrastructure monitoring solutions, providing comprehensive visibility into server performance and system health, and ensuring a smooth data flow for accurate metric representation.
Typo allows for easy customization of widgets, so you can align the dashboard precisely with your organization's unique metrics and objectives.
Typo’s automation features streamline data collection and reporting, reducing manual efforts and ensuring real-time, accurate insights. Additionally, Typo can help monitor and report on system uptime, ensuring high availability and reliability.
Typo facilitates collaboration among team members, allowing them to collectively interpret and act upon dashboard insights, fostering a culture of continuous improvement.
Typo is designed to scale with your organization’s growth, accommodating evolving needs and ensuring the longevity of your DevOps initiatives. Its scalability ensures reliable monitoring and management of metrics as your production environment grows.
When you opt for Typo as your preferred platform, you enable your team to fully utilize the DORA metrics. This drives efficiency, innovation, and excellence throughout your DevOps journey. Make the most of Typo to take your DevOps practices to the next level and stay ahead in the competitive software development landscape of today.
DORA metrics dashboard plays a crucial role in optimizing DevOps performance.
Building the dashboard with Typo provides various benefits such as tailored integration and customization. To know more about it, book your demo today!


Implement engineering metrics, gather SDLC insights & set continuous improvement goals in your dev teams.
Try Live Demo
We're on a mission to build engaged, productive tech teams. Try it out for free!


Follow us on:


