Measuring engineering productivity accurately determines whether your software development teams deliver value efficiently or burn resources without meaningful output. Measuring developer productivity is inherently difficult due to the complex and collaborative nature of software development. Engineering productivity measurement has evolved from counting lines of code to sophisticated frameworks that capture delivery speed, code quality, team collaboration, and developer experience across the entire development process.
Traditional metrics often fail to capture the true productivity of engineering teams, leading to misconceptions about their performance. Modern approaches, such as DORA and SPACE, emphasize the importance of capturing nuanced, holistic perspectives—often through surveys and human feedback—highlighting the complexities and the need for a comprehensive approach. The SPACE framework includes five dimensions: satisfaction and well-being, performance, activity, communication and collaboration, and efficiency and flow metrics.
This guide covers measurement frameworks, key metrics, implementation strategies, and common pitfalls specifically for engineering teams building software products. The target audience includes engineering leaders, VPs of Engineering, and development managers who need data-driven insights to optimize their engineering organization. Effective measurement matters because it drives faster time-to-market, identifies bottlenecks in your software development process, improves resource allocation, and supports sustainable team's performance. Improved cycle times and delivery speed can also lead to better customer satisfaction by enabling faster delivery of features and higher service quality.
A mixed-methods approach—combining both qualitative and quantitative metrics—can provide a fuller understanding of developer productivity.
Direct answer: Engineering productivity is assessed through a broad combination of metrics and qualitative insights. Core quantitative metrics include DORA metrics—deployment frequency, lead time for changes, mean time to recovery, and change failure rate—that measure key aspects of software delivery performance. Alongside these, development flow indicators such as cycle time, pull request efficiency, and code review metrics provide detailed visibility into the development process. Additionally, measuring engineering productivity incorporates qualitative data gathered from developer experience surveys, team collaboration assessments, and satisfaction and well-being metrics. This comprehensive approach captures both the technical outputs and human factors influencing productivity, enabling engineering leaders to gain meaningful insights into their teams' performance, identify bottlenecks, optimize workflows, and improve overall engineering effectiveness.
After reading this guide, you will:
Engineering productivity measurement quantifies how effectively your development teams convert time and resources into customer-impacting software outcomes. This goes beyond simple output counting to assess the entire system of software delivery, from code commits to production deployment to incident recovery. Understanding a team's capacity to complete work within a sprint or project cycle is crucial, as it directly relates to measuring throughput and forecasting future performance. To do this well, it’s important to identify metrics that capture both qualitative and system aspects, especially in complex areas like technical debt where human judgment is often required.
Additionally, the link between inputs and outputs in software development is considerably less clear compared to other business functions, which makes measurement particularly challenging.
Engineering productivity represents the delivery of high-quality software efficiently while maintaining team health and sustainability. This definition intentionally combines multiple dimensions: delivery speed, software quality, and developer experience.
An important aspect of team productivity is measuring the rate at which new developers contribute, as well as their effective onboarding and integration into the team.
Productivity differs from velocity and raw output in important ways. Velocity measures work completed per sprint (often in story points), but high velocity with poor code quality creates technical debt that slows future work. Raw output metrics like lines of code or number of commits can be gamed and fail to capture actual value delivered. Engineering productivity instead focuses on outcomes that matter to the business and sustainability factors that matter to the team.
When considering qualitative metrics, it's important to note that the social sciences field itself lacks authoritative definitions for qualitative measurement, leading to ambiguity and variability in how such metrics are interpreted.
For the business, measuring productivity enables faster time-to-market by identifying bottlenecks in the development process, better resource allocation through objective measurements of team capacity, and improved strategic planning based on historical data rather than guesswork. Analyzing the review process, such as code reviews and weekly PR reviews, can highlight bottlenecks and improve workflow efficiency.
For the engineering team, measurement reveals friction in team workflows, supports developer productivity improvements, and enables data-driven decision making about process changes. Understanding the developer workflow and integrating feedback mechanisms at key stages—such as through transactional surveys—ensures real-time feedback is gathered from developers at critical touchpoints. Many engineering leaders use measurement data to advocate for investments in developer tools, infrastructure, or headcount.
Understanding why measurement matters leads naturally to the question of what to measure—the specific engineering productivity metrics that provide meaningful insights.
Engineering organizations are dynamic and multifaceted, requiring thoughtful management to achieve high levels of productivity and efficiency. Measuring engineering productivity metrics is essential for understanding how effectively teams deliver value and where improvements can be made. These metrics go beyond simple output—they encompass development speed, code quality, team collaboration, and the efficient use of resources.
By systematically tracking software engineering productivity, engineering leaders gain visibility into the strengths and weaknesses of their engineering processes. This enables them to make informed decisions that drive continuous improvement, enhance software quality, and foster better team collaboration. High-performing engineering organizations prioritize the measurement of productivity metrics to ensure that their development efforts align with business goals and deliver maximum impact. Ultimately, a data-driven approach to measuring software engineering productivity empowers organizations to optimize workflows, reduce waste, and accelerate business growth.
The engineering leader plays a pivotal role in shaping the productivity and efficiency of the engineering team. Their responsibilities extend beyond technical oversight—they must ensure that productivity metrics are aligned with broader business objectives and that the team is set up for sustainable success. Effective engineering leaders cultivate a culture of continuous improvement, encouraging regular review of productivity metrics and open discussions about opportunities for enhancement.
Leveraging project management tools, code repositories, and analytics platforms, engineering leaders can track engineering productivity, monitor code quality, and identify areas where technical debt may be accumulating. By focusing on these key areas, leaders can allocate resources more effectively, support their teams in overcoming obstacles, and drive improvements in engineering efficiency. Prioritizing code quality and proactively managing technical debt ensures that the engineering team can deliver high-quality software while maintaining the agility needed to meet evolving business needs.
Building on the measurement foundations above, selecting the right metrics requires understanding several complementary categories. No single metric captures engineering productivity completely; instead, different metrics address distinct aspects of delivery practices and team performance.
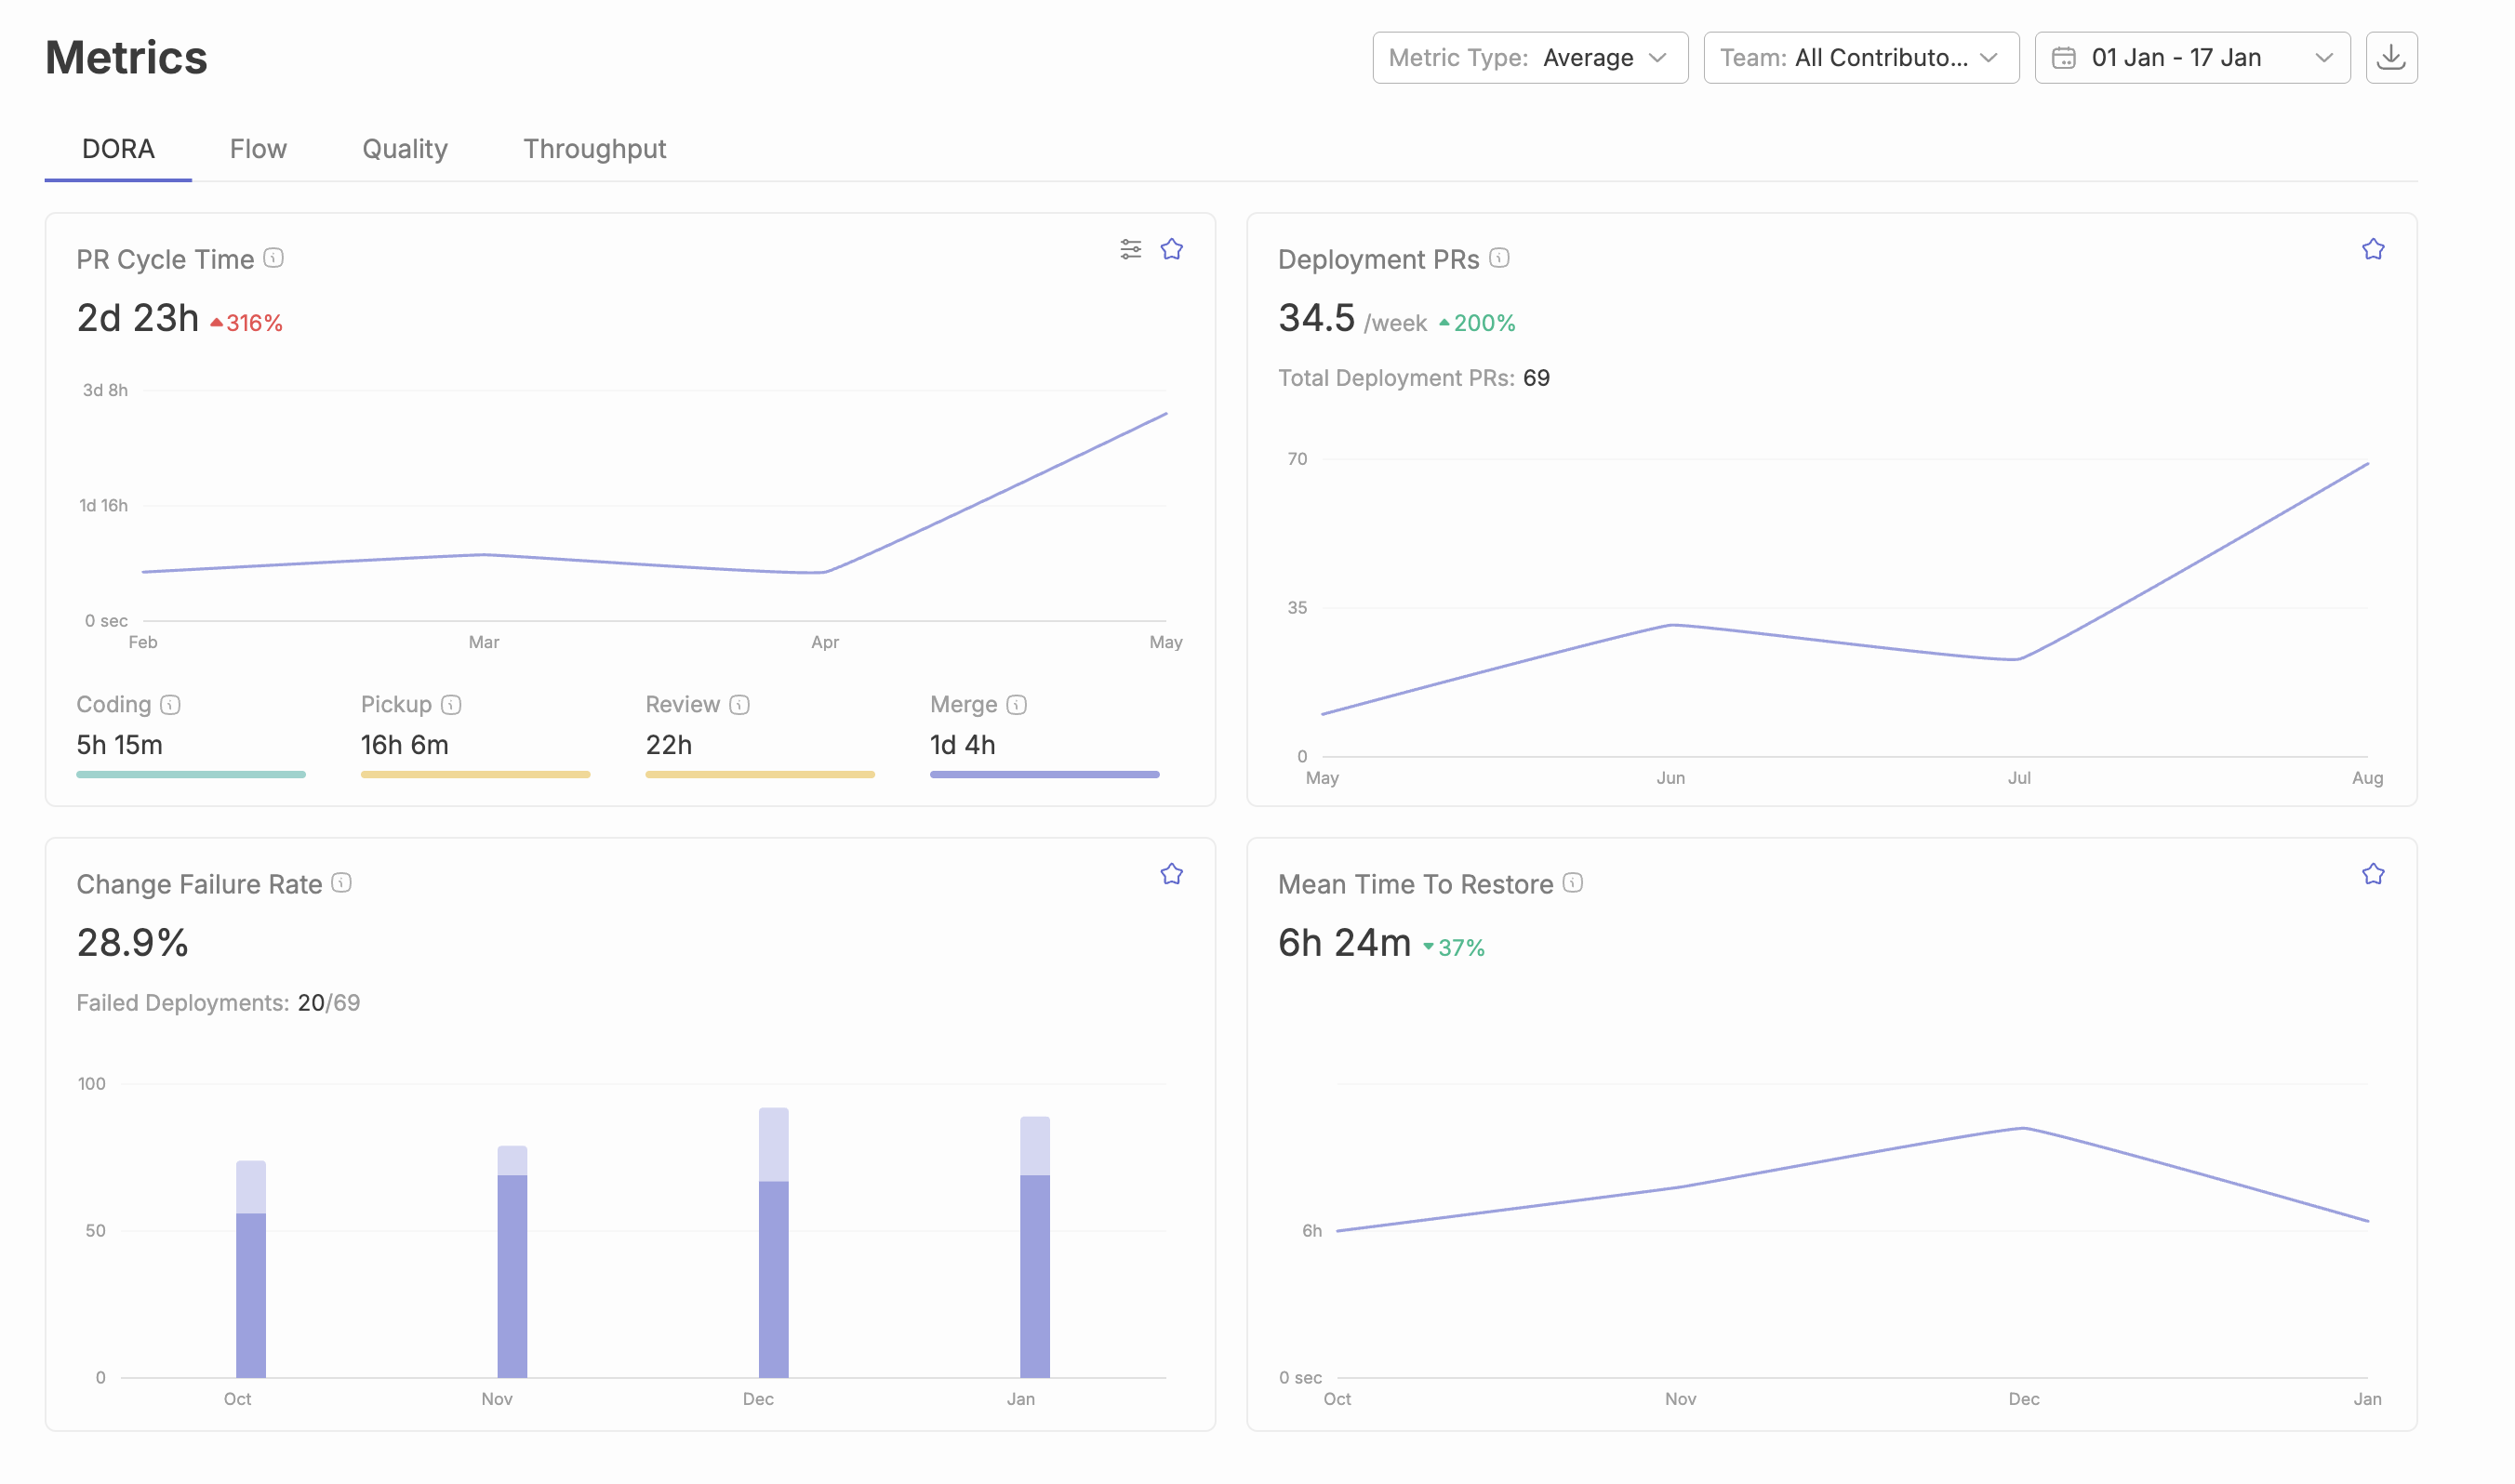
The DORA metrics emerged from DevOps Research and Assessment studies analyzing thousands of development teams. These four key metrics assess software delivery performance:
Deployment frequency measures how often your team releases code to production. Higher frequency indicates faster iteration cycles and reduced batch sizes, which lower risk and accelerate feedback loops.
Lead time for changes measures the time from code commit to production deployment. This captures your entire delivery pipeline efficiency, including code reviews, automated testing, and release process steps.
Mean time to recovery (MTTR) measures how quickly your team can restore service after a production failure. Low MTTR indicates operational maturity and effective incident response.
Change failure rate measures the percentage of deployments that cause incidents requiring remediation. This reflects code quality, testing effectiveness, and the reliability of your deployment practices.
DORA metrics connect directly to business outcomes—teams with elite performance across these metrics deploy faster, recover quicker, and ship more reliably than lower performers.
Beyond DORA, development flow metrics reveal how work moves through your engineering processes:
Cycle time measures elapsed time from work starting to reaching production. Breaking this into coding time, pickup time, review time, and deploy time helps pinpoint exactly where delays occur.
Pull request metrics include time to first review, review iterations, merge frequency, and PR size. Large, long-lived pull requests often indicate process problems and increase integration risk.
Code review efficiency tracks how quickly reviews happen and how many iterations are needed. Slow code reviews create developer waiting time and context-switching costs.
These flow metrics help identify development pipeline bottlenecks that slow overall delivery without necessarily appearing in DORA metrics.
Quality metrics connect to long-term engineering productivity sustainability:
Code complexity measures like cyclomatic complexity identify code that becomes increasingly difficult to maintain. High complexity correlates with higher defect rates and slower modification.
Defect rates track bugs found in production versus caught earlier. Bug fixes consume engineering capacity that could otherwise build new features.
Technical debt indicators include aged dependencies, deprecated APIs, and low test coverage areas. Unmanaged technical debt gradually degrades team velocity.
Automated testing coverage measures what percentage of code has automated test verification. Higher coverage generally enables faster, safer deployments.
With these metric categories understood, the next step involves practical implementation—setting up systems to actually track engineering productivity in your organization.
Moving from metric understanding to measurement reality requires systematic implementation. The following approach applies to engineering organizations of various sizes, though larger teams typically need more automation.
This systematic approach works for teams beginning measurement programs or expanding existing capabilities:
Regular performance evaluation and feedback help individuals identify areas for improvement and support their professional growth.
Different approaches to measuring software engineering productivity offer distinct trade-offs:
Manual tracking works for small teams starting out but becomes unsustainable as teams grow. Logs data extraction and spreadsheet maintenance consume engineering time better spent elsewhere.
Open source tools provide flexibility and low cost but require ongoing maintenance and integration work. Teams need engineers comfortable building and maintaining custom solutions.
Engineering intelligence tools automate data collection and analysis across multiple development platforms, providing comprehensive dashboards that deliver actionable insights to improve engineering productivity.
Optimizing engineering processes is fundamental to improving both productivity and efficiency within software development teams. This involves streamlining workflows, ensuring effective resource allocation, and fostering a culture where learning and improvement are ongoing priorities. By closely tracking key metrics such as deployment frequency, lead time, and code quality, engineering teams can pinpoint bottlenecks and identify areas where the development process can be refined.
In addition to quantitative metrics, gathering qualitative data—such as feedback from developer surveys—provides valuable context and deeper insights into developer productivity. Combining these data sources allows engineering organizations to form a comprehensive understanding of their strengths and challenges, enabling targeted improvements that enhance the overall development process. Regular code reviews, robust version control systems, and effective issue tracking systems are essential tools for identifying process inefficiencies and ensuring that engineering practices remain aligned with business objectives. By continuously optimizing engineering processes, teams can deliver higher-quality software, respond more quickly to changing requirements, and drive sustained business success.
Typo is an engineering intelligence (SEI) tool designed to provide comprehensive insights into your engineering team's productivity and workflow. By integrating seamlessly with integrated development environments, project management tools, version control systems, and communication platforms, Typo consolidates data across your software development process.
Typo enables engineering leaders to track key engineering productivity metrics such as deployment frequency, lead time, code review efficiency, and issue resolution rates. It helps identify bottlenecks in the development process, monitor code quality, and assess team collaboration, all within a unified dashboard.
With Typo, organizations can move beyond fragmented data silos to gain a holistic, real-time view of engineering performance. This allows for data-driven decision-making to improve engineering efficiency, optimize resource allocation, and align engineering efforts with business objectives without the need for custom development or manual data aggregation.
Measuring engineering productivity effectively requires a thoughtful, structured approach that goes beyond simply collecting data. Engineering leaders should focus on best practices that ensure measurement efforts translate into meaningful improvements for both the team and the business.
Start by identifying and tracking key engineering productivity metrics that align with your team’s goals and maturity. Metrics such as deployment frequency, lead time, and code quality offer valuable insights into the software development process and help pinpoint areas where engineering efficiency can be improved. Regularly reviewing these productivity metrics enables teams to spot trends, identify bottlenecks, and make informed decisions about workflow optimization.
It’s essential to balance quantitative data—like cycle time, bug rates, and throughput—with qualitative data gathered from developer surveys, feedback sessions, and retrospectives. Qualitative insights provide context that numbers alone can’t capture, revealing the human factors that influence developer productivity, such as team morale, communication, and satisfaction with the development process.
Leverage project management tools and dashboards to automate data collection and reporting. This not only reduces manual overhead but also ensures that key metrics are consistently tracked and easily accessible. Integrating these tools with your version control systems and CI/CD pipelines allows for real-time monitoring of engineering productivity metrics, making it easier to respond quickly to emerging issues.
Finally, foster a culture of continuous improvement by regularly sharing measurement results with the team, encouraging open discussion, and collaboratively setting goals for future progress. By combining robust quantitative analysis with qualitative feedback, engineering leaders can drive sustained improvements in productivity, team health, and software quality.
Engineering productivity is a critical driver of business success, especially in today’s fast-paced software engineering landscape. By systematically measuring software engineering productivity and tracking progress against key performance indicators, engineering leaders can ensure that their teams are not only delivering high-quality software but also contributing directly to broader business objectives.
Aligning engineering productivity efforts with business goals starts with selecting the right metrics. While quantitative indicators like lines of code, code commits, and code reviews provide a snapshot of output and workflow efficiency, it’s equally important to consider qualitative metrics such as team collaboration, communication, and the ability to tackle complex tasks. Many engineering leaders recognize that a balanced approach—combining both quantitative and qualitative metrics—yields the most actionable insights into team performance.
Tracking these metrics over time allows teams to establish baselines, identify bottlenecks, and implement targeted initiatives to improve productivity. For example, monitoring technical debt and code quality helps prevent future slowdowns, while regular code reviews and the use of integrated development environments and version control systems streamline the development process and reduce friction.
Resource allocation is another area where measuring software engineering productivity pays dividends. By understanding where time and effort are being spent, leaders can optimize team capacity, focus on high-impact projects, and ensure that the right resources are available to address critical issues. This leads to more efficient workflows, faster delivery of features, and ultimately, higher customer satisfaction.
Issue tracking systems and automated dashboards further support these efforts by providing real-time visibility into team progress and highlighting areas for improvement. By leveraging these tools and maintaining a focus on both business objectives and team well-being, engineering organizations can drive continuous improvement, deliver better software, and achieve sustained business growth.
Even well-designed measurement programs encounter obstacles. Understanding typical challenges helps you prepare and respond effectively.
When individual metrics become performance targets, engineers may optimize for the metric rather than the underlying goal. Counting lines of code encourages verbose implementations; emphasizing commit frequency encourages trivial commits.
Solution: Implement metric portfolios rather than single KPIs. Track quantitative metrics alongside qualitative metrics and survey data. Focus measurement discussions on team-level patterns rather than individual developer performance, which reduces gaming incentives while still providing meaningful insights.
Engineering work spans multiple systems—code reviews happen in GitHub, task tracking in Jira, communication in Slack. Analyzing each system separately misses the connections between them.
Solution: Integrate multiple data sources through engineering intelligence platforms that combine quantitative data from code commits, issue tracking systems, and communication tools. Establish data governance processes that maintain quality across sources.
Engineers who feel surveilled rather than supported will resist measurement initiatives and may even leave such a team. Poorly implemented metrics programs damage trust and team collaboration.
Solution: Emphasize that measurement serves team improvement, not individual surveillance. Involve developers in identifying metrics that matter to them—time spent actively working on complex tasks versus stuck in meetings, for example. Ensure complete transparency in how data is collected and used.
Tracking every possible metric creates dashboard overload without improving productivity. Teams drown in data without gaining actionable insights.
Solution: Start with 3-5 core metrics aligned with your primary improvement goals. Expand gradually based on insights gained and questions that arise. Focus on metrics that directly inform decisions rather than interesting-but-unused data points.
Numbers without interpretation don’t drive improvement. A cycle time chart means nothing without understanding what causes observed patterns.
Solution: Combine quantitative data with qualitative data from retrospectives and 1:1 conversations. When metrics show problems, investigate root causes through developer feedback. Track whether interventions actually improve measurements over time.
Overcoming these challenges positions your measurement program to deliver lasting value rather than becoming another abandoned initiative.
Effective engineering productivity measurement requires balanced metrics covering delivery speed, code quality, and developer experience. Single metrics inevitably create blind spots; portfolios of complementary measures provide actionable insights while reducing gaming risks. Implementation matters as much as metric selection—automated data collection, clear baselines, and regular improvement cycles distinguish successful programs from measurement theater.
Immediate next steps:
Related topics worth exploring: Developer experience optimization addresses the qualitative factors that quantitative metrics miss. AI coding assistant impact measurement is becoming increasingly relevant as teams adopt GitHub Copilot and similar tools. Software delivery forecasting uses historical data to predict future team capacity and delivery timelines.


Implement engineering metrics, gather SDLC insights & set continuous improvement goals in your dev teams.
Try Live Demo
We're on a mission to build engaged, productive tech teams. Try it out for free!


Follow us on:


