Adopting DevOps methods and tracking DORA metrics is crucial for firms aiming to achieve agility, efficiency, and quality in software development—a constantly changing terrain. This guide is designed for DevOps professionals, engineering managers, and software teams who want to understand and leverage devops metrics dora to improve software delivery performance and benchmark against industry standards. Understanding DORA metrics matters because it enables organizations to identify bottlenecks, drive continuous improvement, and measure their performance against industry leaders. This guide explains what DORA metrics are, why they matter for DevOps teams, and how organizations can use them to drive continuous improvement.
DORA (DevOps Research and Assessment) metrics are four evidence-based indicators used to evaluate and optimize software delivery performance. These performance measurements help teams deliver software more efficiently and quickly, focusing on four core metrics: deployment frequency, lead time for changes, change failure rate, and mean time to restore. DORA metrics provide a standardized way to benchmark performance across teams, helping organizations identify actionable opportunities for improvement in their software development processes. By tracking these metrics, DevOps teams can make data-driven decisions, accelerate delivery, and enhance software quality.
DORA metrics are divided into two throughput (velocity) metrics and two stability (quality) metrics:
These metrics serve as key performance measurements for software delivery, enabling teams to assess both the speed and reliability of their DevOps processes.. With this foundation, let's explore the essence of DevOps metrics and how DORA metrics specifically assess DevOps performance.
DevOps is more than just a collection of methods; it's a paradigm change that encourages teams to work together, from development to operations. To accomplish common goals, DevOps practices eliminate barriers, enhance communication, and coordinate efforts. It guarantees consistency and dependability in software delivery and aims to automate processes to standardize and speed them up.
With this understanding of DevOps principles, we can now see how DORA metrics provide a concrete framework for measuring and improving these practices.
If you want to know how well your DevOps methods are doing, look no further than DORA—short for DevOps Research and Assessment—now part of Google Cloud. In DevOps research, the research and assessment DORA team established the four DORA metrics to benchmark software delivery and collaboration.
DORA metrics, developed by the DORA team, are four evidence-based indicators used to evaluate and optimize software delivery performance. These key measurements provide a data-driven way to assess the effectiveness and efficiency of software development and delivery processes.
To help organizations find ways to improve and make smart decisions, teams measure DORA metrics to ground engineering decisions in concrete, quantitative data. The framework includes four key measurements split into two throughput metrics and two stability metrics: Deployment Frequency, Lead Time for Changes, Change Failure Rate, and Mean Time to Restore.
Let's dive deeper into each DORA metric, their definitions, importance, and how to optimize them.
Definition: Deployment Frequency measures how often an organization successfully releases changes to production. It is a throughput (velocity) metric.
Greater deployment frequency is an indication of increased agility and the ability to respond quickly to market demands. A team can respond to client input, enhance their product, and supply new features and repairs faster with a greater Deployment Frequency.
Definition: Lead time for changes measures the average time it takes to deliver code from commitment to production deployment. It is a throughput (velocity) metric.
Definition: Change Failure Rate measures the percentage of deployments that cause a failure in production. It is a stability (quality) metric.
Definition: Mean Time to Restore (MTTR) evaluates the average time it takes to recover from a production failure. It is a stability (quality) metric.
With a clear understanding of each DORA metric, let's look at how to measure and implement them effectively within your organization.
With these structures in place, organizations can maximize the value of DORA metrics and drive meaningful improvements in software delivery.
Value Stream Management refers to improving the entire value stream from customer request to release so teams can deliver frequent, high-quality releases to end-users. The success metric for value stream management is customer satisfaction—realizing the value of the changes by delivering business value across the value stream and improving organizational performance.
By leveraging DORA metrics within value stream management, organizations can align technical performance with business outcomes.
New features and updates must be deployed quickly in competitive e-commerce. E-commerce platforms can enhance deployment frequency and lead time with DORA analytics.
An e-commerce company implements DORA metrics but finds that manual testing takes too long to deploy frequently. They save lead time and boost deployment frequency by introducing automated testing to reduce release friction, support multiple deployments with less risk, and streamline CI/CD pipelines. This lets businesses quickly release new features and upgrades, giving them an edge.
In the financial industry, dependability and security are vital, thus failures and recovery time must be minimized. DORA measurements can reduce change failures and incident recovery times.
Financial institutions detect high change failure rates during transaction processing system changes. DORA metrics reveal failure causes including testing environment irregularities. Improvements in infrastructure as code and environment management reduce failure rates and mean time to recovery, making client services more reliable.
In healthcare, where software directly affects patient care, deployment optimization and failure reduction are crucial. DORA metrics reduce change failure and deployment time.
For instance, a healthcare software provider discovers that manual approval and validation slow rollout. They speed deployment by automating compliance checks and clarifying approval protocols. They also improve testing procedures to reduce change failure. This allows faster system changes without affecting quality or compliance, increasing patient care.
Tech businesses that want to grow quickly must provide products and upgrades quickly. DORA metrics improve deployment lead time.
A tech startup examines DORA metrics and finds that manual configuration chores slow deployments. They automate configuration management and provisioning with infrastructure as code. Thus, their deployment lead time diminishes, allowing businesses to iterate and innovate faster and attract more users and investors.
Even in manufacturing, where software automates and improves efficiency, deployment methods must be optimized. DORA metrics can speed up and simplify deployment.
A manufacturing company uses IoT devices to monitor production lines in real time. However, updating these devices is time-consuming and error-prone. DORA measurements help them improve version control and automate deployment. This optimizes production by reducing deployment time and ensuring more dependable and synchronized IoT device updates.
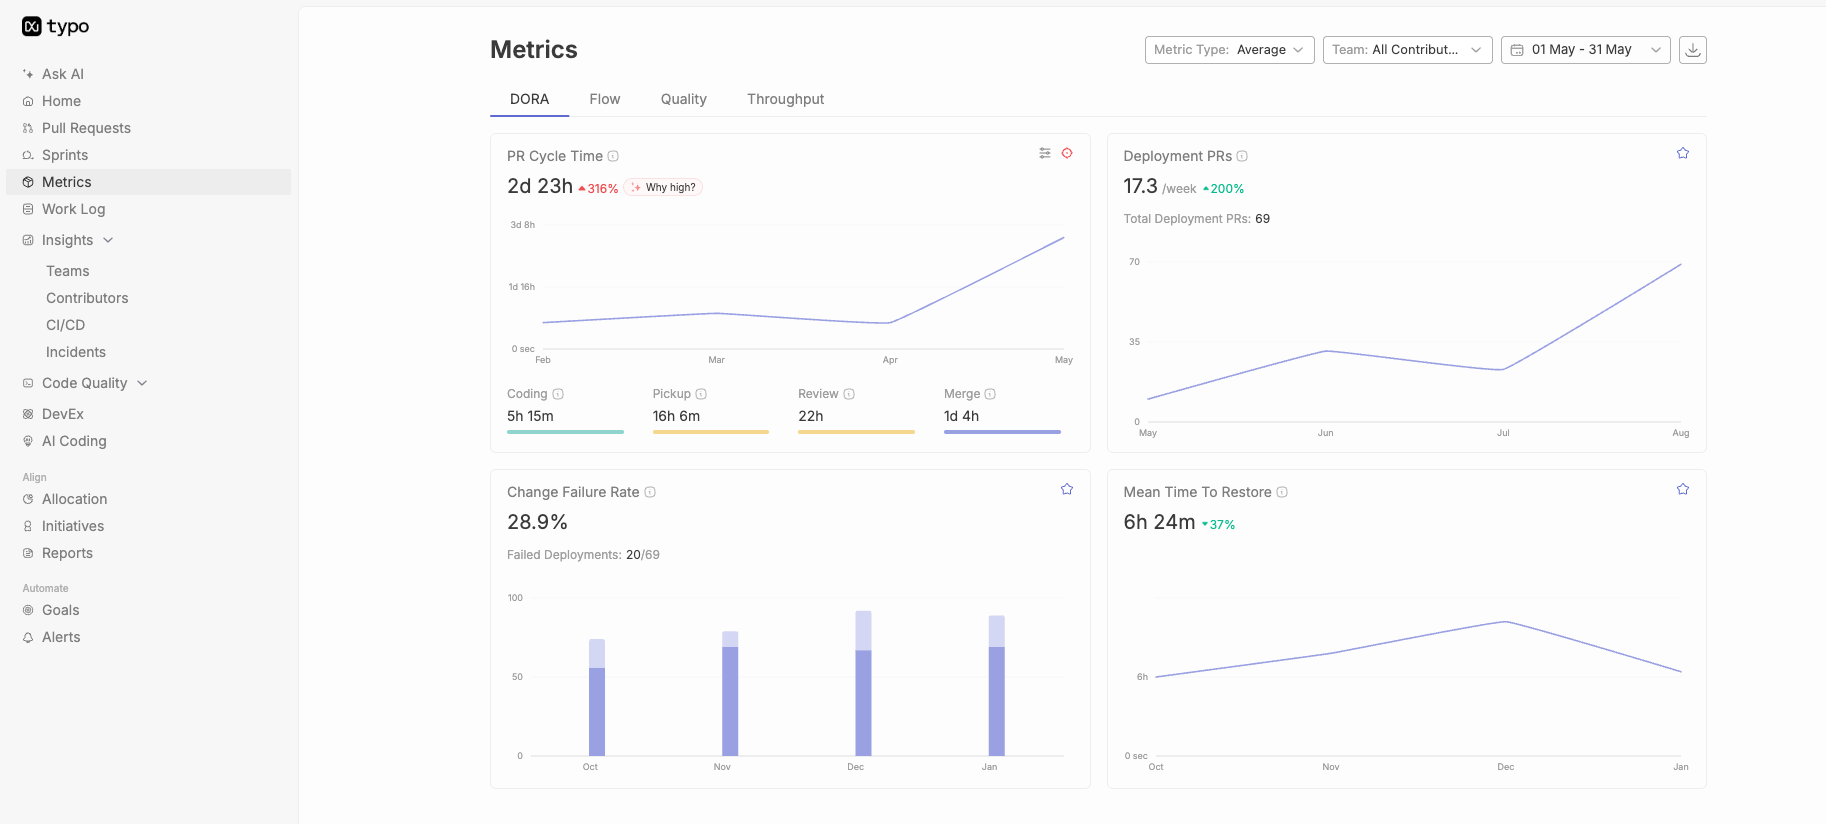
Typo is a leading AI-driven engineering analytics platform that helps teams measure DORA metrics across the software delivery process with SDLC visibility, data-driven insights, and workflow automation. It provides comprehensive insights through DORA and other DORA metrics in one centralized dashboard.
Adopting DevOps and leveraging DORA metrics is crucial for modern software development. DevOps metrics drive collaboration and automation, while DORA metrics offer valuable insights to streamline delivery processes and boost team performance. Together, they help teams deliver higher-quality software faster and stay ahead in a competitive market.


Implement engineering metrics, gather SDLC insights & set continuous improvement goals in your dev teams.
Try Live Demo
We're on a mission to build engaged, productive tech teams. Try it out for free!


Follow us on:


