In the rapidly evolving world of DevOps, it is essential to comprehend and improve your development and delivery workflows. To evaluate and enhance the efficiency of these workflows, the DevOps Research and Assessment (DORA) metrics serve as a crucial tool.
This blog, specifically designed for Typo, offers a comprehensive guide on creating a DORA metrics dashboard that will help you optimize your DevOps performance.
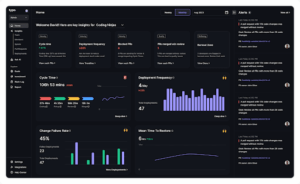
The DORA metrics consist of four key metrics:
Deployment frequency measures the frequency of deployment of code to production or releases to end-users in a given time frame.
This metric measures the time between a commit being made and that commit making it to production.
Change failure rate measures the proportion of deployment to production that results in degraded services.
This metric is also known as the mean time to restore. It measures the time required to solve the incident i.e. service incident or defect impacting end-users.
These metrics provide valuable insights into the performance of your software development pipeline. By creating a well-designed dashboard, you can visualize these metrics and make informed decisions to improve your development process continuously.
Before you choose a platform for your DORA Metrics Dashboard, it's important to first define clear and measurable objectives. Consider the Key Performance Indicators (KPIs) that align with your organizational goals. Whether it's improving deployment speed, reducing failure rates, or enhancing overall efficiency, having a well-defined set of objectives will help guide your implementation of the dashboard.
When searching for a platform, it's important to consider your goals and requirements. Look for a platform that is easy to integrate, scalable, and customizable. Different platforms, such as Typo, have unique features, so choose the one that best suits your organization's needs and preferences.
Gain a deeper understanding of the DevOps Research and Assessment (DORA) metrics by exploring the nuances of Deployment Frequency, Lead Time, Change Failure Rate, and MTTR. Then, connect each of these metrics with your organization's DevOps goals to have a comprehensive understanding of how they contribute towards improving overall performance and efficiency.
After choosing a platform, it's important to follow specific guidelines to properly configure your dashboard. Customize the widgets to accurately represent important metrics and personalize the layout to create a clear and intuitive visualization of your data. This ensures that your team can easily interpret the insights provided by the dashboard and take appropriate actions.
To ensure the accuracy and reliability of your DORA Metrics, it is important to establish strong data collection mechanisms. Configure your dashboard to collect real-time data from relevant sources, so that the metrics reflect the current state of your DevOps processes. This step is crucial for making informed decisions based on up-to-date information.
To optimize the performance of your DORA Metrics Dashboard, you can integrate automation tools. By utilizing automation for data collection, analysis, and reporting processes, you can streamline routine tasks. This will free up your team's time and allow them to focus on making strategic decisions and improvements, instead of spending time on manual data handling.
To get the most out of your well-configured DORA Metrics Dashboard, use the insights gained to identify bottlenecks, streamline processes, and improve overall DevOps efficiency. Analyze the dashboard data regularly to drive continuous improvement initiatives and make informed decisions that will positively impact your software development lifecycle.
Aggregating diverse data sources into a unified dashboard is one of the biggest hurdles while building the DORA metrics dashboard.
For example, if the metrics to be calculated is 'Lead time for changes' and sources include a version control system in GIT, Issue tracking in Jira, and a Build server in Jenkins. The timestamps recorded in Git, Jira, and Jenkins may not be synchronized or standardized and they may capture data at different levels of granularity.
Another challenge is whether the dashboard effectively communicates the insights derived from the metrics.
Suppose, you want to get visualized insights for deployment frequency. You choose a line chart for the same. However, if the frequency is too high, the chart might become cluttered and difficult to interpret. Moreover, displaying deployment frequency without additional information can lead to misinterpretation of the metric.
Teams may fear that the DORA dashboard will be used for blame rather than the improvement. Moreover, if there's a lack of trust in the organization, they question the motives behind implementing metrics and doubt the fairness of the process.
Typo, as a dynamic platform, provides a user-friendly interface and robust features tailored for DevOps excellence.
Leveraging Typo for your DORA Metrics Dashboard offers several advantages:
It integrates with key DevOps tools, ensuring a smooth data flow for accurate metric representation.
It allows for easy customization of widgets, aligning the dashboard precisely with your organization's unique metrics and objectives.
Typo's automation features streamline data collection and reporting, reducing manual efforts and ensuring real-time, accurate insights.
It facilitates collaboration among team members, allowing them to collectively interpret and act upon dashboard insights, fostering a culture of continuous improvement.
It is designed to scale with your organization's growth, accommodating evolving needs and ensuring the longevity of your DevOps initiatives.
When you opt for Typo as your preferred platform, you enable your team to fully utilize the DORA metrics. This drives efficiency, innovation, and excellence throughout your DevOps journey. Make the most of Typo to take your DevOps practices to the next level and stay ahead in the competitive software development landscape of today.
DORA metrics dashboard plays a crucial role in optimizing DevOps performance.
Building the dashboard with Typo provides various benefits such as tailored integration and customization. To know more about it, book your demo today!


Implement engineering metrics, gather SDLC insights & set continuous improvement goals in your dev teams.
Try Live Demo
We're on a mission to build engaged, productive tech teams. Try it out for free!


Follow us on: