
Platform engineering tools empower developers by enhancing their overall experience. By eliminating bottlenecks and reducing daily friction, these tools enable developers to accomplish tasks more efficiently. This efficiency translates into improved cycle times and higher productivity.
In this blog, we explore top platform engineering tools, highlighting their strengths and demonstrating how they benefit engineering teams.
Platform Engineering, an emerging technology approach, enables the software engineering team with all the required resources. This is to help them perform end-to-end operations of software development lifecycle automation. The goal is to reduce overall cognitive load, enhance operational efficiency, and remove process bottlenecks by providing a reliable and scalable platform for building, deploying, and managing applications.
Typo is an effective software engineering intelligence platform that offers SDLC visibility, developer insights, and workflow automation to build better programs faster. It can seamlessly integrate into tech tool stacks such as GIT versioning, issue tracker, and CI/CD tools.
It also offers comprehensive insights into the deployment process through key metrics such as change failure rate, time to build, and deployment frequency. Moreover, its automated code tool helps identify issues in the code and auto-fixes them before you merge to master.
Typo has an effective sprint analysis feature that tracks and analyzes the team’s progress throughout a sprint. Besides this, It also provides 360 views of the developer experience i.e. captures qualitative insights and provides an in-depth view of the real issues.

An open-source container orchestration platform. It is used to automate deployment, scale, and manage container applications.
Kubernetes is beneficial for application packages with many containers; developers can isolate and pack container clusters to be deployed on several machines simultaneously.
Through Kubernetes, engineering leaders can create Docker containers automatically and assign them based on demands and scaling needs.
Kubernetes can also handle tasks like load balancing, scaling, and service discovery for efficient resource utilization. It also simplifies infrastructure management and allows customized CI/CD pipelines to match developers’ needs.
An open-source automation server and CI/CD tool. Jenkins is a self-contained Java-based program that can run out of the box.
It offers extensive plug-in systems to support building and deploying projects. It supports distributing build jobs across multiple machines which helps in handling large-scale projects efficiently. Jenkins can be seamlessly integrated with various version control systems like Git, Mercurial, and CVS and communication tools such as Slack, and JIRA.

A powerful platform engineering tool that automates software development workflows directly from GitHub.GitHub Actions can handle routine development tasks such as code compilation, testing, and packaging for standardizedizing and efficient processes.
It creates custom workflows to automate various tasks and manage blue-green deployments for smooth and controlled application deployments.
GitHub Actions allows engineering teams to easily deploy to any cloud, create tickets in Jira, or publish packages.
GitLab CI automatically uses Auto DevOps to build, test, deploy, and monitor applications. It uses Docker images to define environments for running CI/CD jobs and build and publish them within pipelines. It supports parallel job execution that allows to running of multiple tasks concurrently to speed up build and test processes.
GitLab CI provides caching and artifact management capabilities to optimize build times and preserve build outputs for downstream processes. It can be integrated with various third-party applications including CircleCI, Codefresh, and YouTrack.
A Continuous Delivery platform provided by Amazon Web Services (AWS). AWS Codepipeline automates the release pipeline and accelerates the workflow with parallel execution.
It offers high-level visibility and control over the build, test, and deploy processes. It can be integrated with other AWS tools such as AWS Codebuild, AWS CodeDeploy, and AWS Lambda as well as third-party integrations like GitHub, Jenkins, and BitBucket.
AWS Codepipeline can also configure notifications for pipeline events to help stay informed about the deployment state.

A Github-based continuous deployment tool for Kubernetes application. Argo CD allows to deployment of code changes directly to Kubernetes resources.
It simplifies the management of complex application deployment and promotes a self-service approach for developers. Argo CD defines and automates the K8 cluster to suit team needs and includes multi-cluster setups for managing multiple environments.
It can seamlessly integrate with third-party tools such as Jenkins, GitHub, and Slack. Moreover, it supports multiple templates for creating Kubernetes manifests such as YAML files and Helm charts.
A CI/CD tool offered by Microsoft Azure. It supports building, testing, and deploying applications using CI/CD pipelines within the Azure DevOps ecosystem.
Azure DevOps Pipeline lets engineering teams define complex workflows that handle tasks like compiling code, running tests, building Docker images, and deploying to various environments. It can automate the software delivery process, reducing manual intervention, and seamlessly integrates with other Azure services, such as Azure Repos, Azure Artifacts, and Azure Kubernetes Service (AKS).
Moreover, it empowers DevSecOps teams with a self-service portal for accessing tools and workflows.
An Infrastructure as Code (IoC) tool. It is a well-known cloud-native platform in the software industry that supports multiple cloud provider and infrastructure technologies.
Terraform can quickly and efficiently manage complex infrastructure and can centralize all the infrastructures. It can seamlessly integrate with tools like Oracle Cloud, AWS, OpenStack, Google Cloud, and many more.
It can speed up the core processes the developers’ team needs to follow. Moreover, Terraform automates security based on the enforced policy as the code.
A platform-as-a-service (PaaS) based on a managed container system. Heroku enables developers to build, run, and operate applications entirely in the cloud and automates the setup of development, staging, and production environments by configuring infrastructure, databases, and applications consistently.
It supports multiple deployment methods, including Git, GitHub integration, Docker, and Heroku CLI, and includes built-in monitoring and logging features to track application performance and diagnose issues.
A popular Continuous Integration/Continuous Delivery (CI/CD) tool that allows software engineering teams to build, test, and deploy software using intelligent automation. It hosts CI under the cloud-managed option.
Circle CI is GitHub-friendly and includes extensive API for customized integrations. It supports parallelism i.e. splitting tests across different containers to run as clean and separate builds. It can also be configured to run complex pipelines.
Circle CI has an in-built feature ‘Caching’. It speeds up builds by storing dependencies and other frequently-used files, reducing the need to re-download or recompile them for subsequent builds.

Understand what specific problems or challenges the tools need to solve. This could include scalability, automation, security, compliance, etc. Consider inputs from stakeholders and other relevant teams to understand their requirements and pain points.
List out the essential features and capabilities needed in platform engineering tools. Also, the tools must integrate well with existing infrastructure, development methodologies (like Agile or DevOps), and technology stack.
Check if the tools have built-in security features or support integration with security tools for vulnerability scanning, access control, encryption, etc. The tools must comply with relevant industry regulations and standards applicable to your organization.
Check the availability and quality of documentation, tutorials, and support resources. Good support can significantly reduce downtime and troubleshooting efforts.
Choose tools that are flexible and adaptable to future technology trends and changes in the organization’s needs. The tools must integrate smoothly with the existing toolchain, including development frameworks, version control systems, databases, and cloud services.
Conduct a pilot or proof of concept to test how well the tools perform in the environment. This allows them to validate their suitability before committing to full deployment.
Platform engineering tools play a crucial role in the IT industry by enhancing the experience of software developers. They streamline workflows, remove bottlenecks, and reduce friction within developer teams, thereby enabling more efficient task completion and fostering innovation across the software development lifecycle.

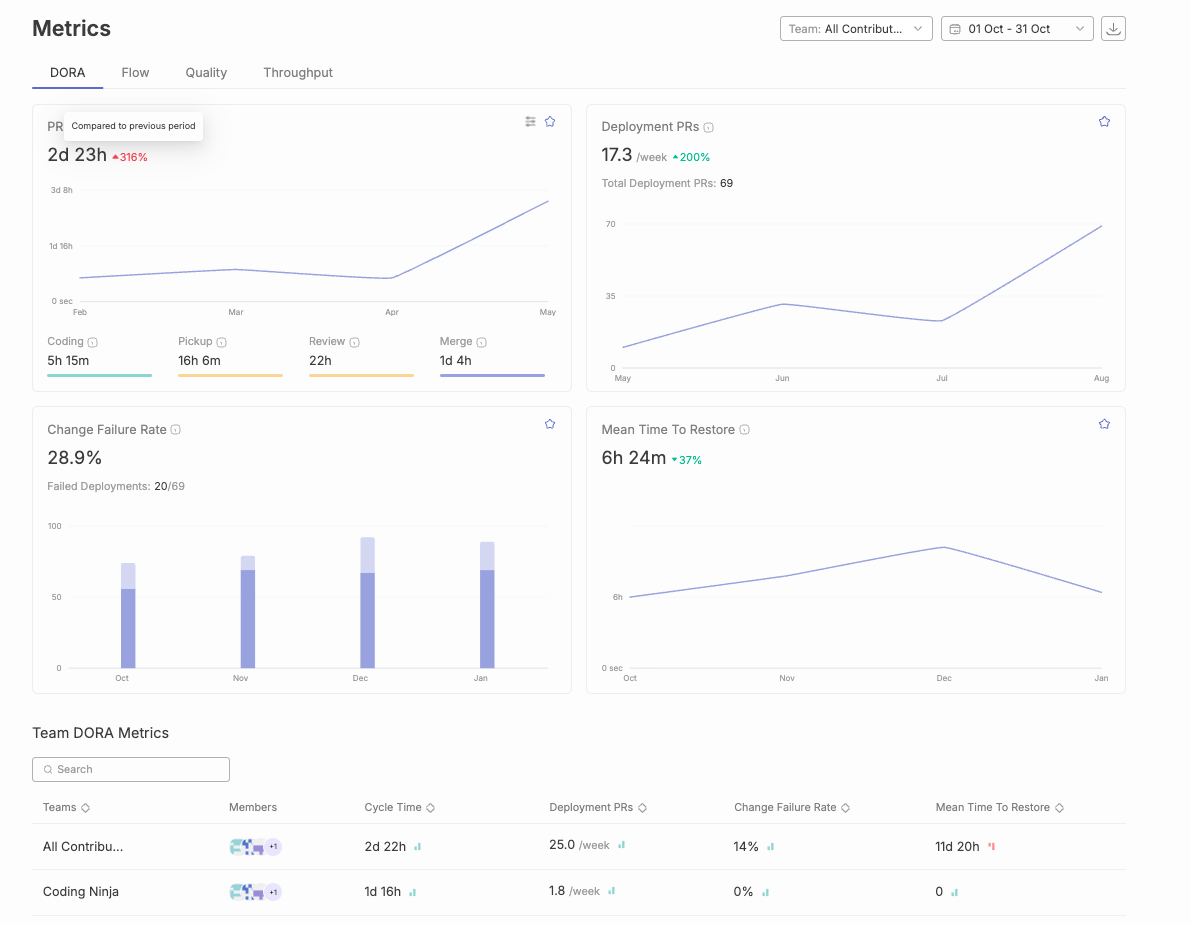
Good DORA metrics benchmarks show how quickly and safely a software team moves code into production. In practical terms, strong teams usually deploy at least weekly, keep lead time for changes under one week, maintain a change failure rate below 15%, and recover from failed deployments in less than one day. Elite teams often deploy on demand, move changes to production within a day, keep failure rates very low, and recover from failed deployments in under an hour.
The modern DORA model now looks at five software delivery performance metrics: deployment frequency, lead time for changes, change failure rate, failed deployment recovery time, and deployment rework rate. These metrics should be measured at the service, application, or team level, because organization-wide averages can hide the real bottlenecks.
The table below gives a practical benchmark view for engineering leaders. Treat these as reference ranges, not universal targets. A payments platform, mobile app, internal tool, AI product, and regulated enterprise system may all have different release constraints.
A team should not chase one metric in isolation. A team that deploys ten times a day but breaks production often is not healthy. A team that rarely fails because it deploys once a quarter is also not healthy. DORA benchmarks work because they hold speed and reliability in tension.
DORA metrics are software delivery performance metrics created through the DevOps Research and Assessment program. They help engineering leaders understand how well teams convert code into production value without increasing production instability, and a comprehensive overview of DORA metrics can help connect these signals to practical implementation.
The five current DORA metrics are:
Historically, DORA was widely known for four key metrics: deployment frequency, lead time for changes, change failure rate, and mean time to restore. The newer model makes the recovery metric more specific by focusing on failed deployments, and adds deployment rework rate to show how much release activity is reactive rather than planned, expanding on ideas similar to those in this practical DORA metrics guide for engineering leaders.
DORA benchmarks help engineering leaders answer a basic question with more precision: are we getting better at delivering software, and how can we use DORA metrics to boost tech team performance without reducing them to vanity scores?
Without benchmarks, teams often rely on vague signals. One leader may feel delivery is slow because a roadmap item missed a date. Another may feel quality is poor because one visible incident escalated to leadership. A developer may feel the process is broken because every pull request waits two days for review. All of these signals may be valid, but they need a shared measurement model.
DORA metrics give that shared model. They connect delivery speed and production stability in a way that is easy to discuss across engineering, product, operations, and executive teams.
DORA benchmarks are useful because they help teams:
The real value is not the score. The value is knowing where to look.
Deployment frequency measures how often code reaches production or end users.
A strong deployment frequency benchmark is usually daily to weekly for most modern software teams. Elite teams often deploy on demand or multiple times per day. Teams deploying less than once a month usually have a release process that is too heavy, too risky, or too dependent on manual coordination.
Deployment frequency is a speed metric, but it should not be interpreted as “more deployments are always better.” The goal is not to inflate deployment count. The goal is to make releases small, safe, and routine.
Low deployment frequency usually points to one or more of these issues:
A healthy team can release small changes without turning every deployment into a coordination event.
Lead time for changes measures how long it takes a committed code change to reach production.
For most teams, under one week is a healthy benchmark. Under one day is strong. Under one hour is a stricter benchmark that usually requires mature CI/CD, small changes, high test confidence, and low approval friction.
Lead time is one of the most useful DORA metrics because it exposes waiting time. A team may write code quickly but still take too long to ship because work sits in review, waits for QA, gets blocked in release approval, or misses a deployment window
To diagnose lead time properly, split it into stages:
The average alone is not enough. Use median, P75, and P90. The median tells you the normal case. P75 and P90 show the long tail where delivery pain usually hides.
Change failure rate measures the percentage of deployments that cause a production failure or need immediate remediation.
A strong benchmark is below 15%. Teams with very mature release practices may target below 5%, but leaders should be careful not to turn this into a fear-based target. If teams are punished for failure, they may deploy less often, hide incidents, or classify hotfixes inconsistently.
Change failure rate is a quality signal for the release process. It does not mean “developer quality” in isolation. A high failure rate can come from weak test coverage, poor rollout strategy, insufficient observability, unclear ownership, rushed reviews, environment drift, or overloaded teams.
The formula is:
Change failure rate = deployments that caused production failure / total deployments x 100
Example:
If a team deploys 80 times in a month and 8 deployments cause incidents, rollbacks, hotfixes, or urgent fixes, the change failure rate is:
8 / 80 x 100 = 10%
That is generally a strong outcome, assuming incidents are classified consistently.
The key is to define what counts as a failure before measuring. Include failures that require rollback, hotfix, immediate remediation, customer-visible degradation, or emergency operational intervention. Do not include normal post-release product tweaks unless they were required to fix a production problem.
Failed deployment recovery time measures how long it takes to restore service after a deployment causes a failure.
A strong recovery benchmark is under one hour. Under one day is healthy for many teams. More than one week usually means the team lacks fast rollback, clear ownership, observability, or safe deployment practices.
This metric is more specific than general MTTR. Traditional MTTR can include many types of incidents, including infrastructure outages, third-party failures, and operational issues unrelated to a deployment. Failed deployment recovery time focuses on the recovery path after a deployment causes a problem.
A team improves this metric by making recovery boring:
Recovery time is not only an incident management metric. It is also a delivery system metric. If it takes three days to recover from a bad deployment, the issue may be slow detection, unclear ownership, slow build pipelines, brittle test suites, or a release process that cannot move fixes quickly.
Deployment rework rate measures how much deployment activity is unplanned work triggered by production issues.
Because deployment rework rate is newer, public benchmark bands are not as mature as the older four DORA metrics. Teams should start by measuring their own baseline and watching the trend.
The formula is:
Deployment rework rate = unplanned deployments caused by production incidents / total deployments x 100
Example:
If a team deploys 50 times in a month and 6 deployments are unplanned fixes for production incidents, the deployment rework rate is:
6 / 50 x 100 = 12%
A single month may not say much. The trend matters more. If rework rate rises from 4% to 12% to 18% over three months, the team is spending more release capacity on repair work. That usually means production instability is starting to consume planned delivery.
Use deployment rework rate to ask:
This is especially important in AI-assisted development. If AI increases code volume but also increases review misses, hotfixes, and unplanned deployments, the apparent productivity gain may not translate into better software delivery performance.
AI coding tools have changed the volume and shape of software work. More code can be produced faster, but that does not automatically mean teams deliver better software faster.
DORA benchmarks matter more in this environment because they measure outcomes, not activity. They help leaders see whether AI-assisted development is improving the system or adding hidden downstream cost, while also exposing the pros and cons of DORA metrics for continuous delivery in increasingly automated pipelines.
For example:
This is where DORA benchmarks need to be paired with engineering workflow metrics. Deployment frequency and lead time tell you whether flow improved. Change failure rate, recovery time, and rework rate tell you whether the system absorbed that speed safely.
DORA metrics are simple to explain but easy to calculate incorrectly. Most problems come from unclear definitions, missing deployment data, and weak links between deployments and incidents, which is why a structured approach to measuring DORA metrics in practice is essential.
Measure DORA metrics at the application, service, or team level first. Organization-wide rollups are useful for executives, but they should not be the starting point.
A platform team, mobile app team, infrastructure team, and product squad may have very different delivery patterns. Blending them into a single average can create misleading conclusions.
Production should mean code is available to users or serving real traffic. For internal systems, production may mean the change is live for internal users. For mobile apps, production may include app store release constraints. For backend services, production usually means the code is deployed to the live environment.
Be explicit. Otherwise, teams may count staging deployments, test deployments, or internal release candidates inconsistently.
Deployment frequency and lead time can usually be measured from Git and CI/CD systems. Change failure rate and failed deployment recovery time require incident context.
You need to know:
Without this link, change failure rate becomes guesswork.
Averages flatten the story. If most changes ship in one day but 20% take two weeks, the average will hide the long-tail pain.
Use:
For leadership reviews, P75 and P90 are often more useful than averages because they reveal where predictability breaks down.
A single month of DORA metrics can be misleading. A team may have one major incident, one release freeze, or one unusual migration that distorts the data.
Review DORA metrics over time:
The question is not only “where are we now?” It is “are we improving without moving risk somewhere else?”
The metrics become useful when read together.
This is why DORA metrics should not become a scoreboard. They are diagnostic signals. They tell leaders where to investigate.
There is no single DORA score that works for every team. A good DORA benchmark depends on the product, architecture, compliance environment, deployment model, and team maturity.
That said, a strong software delivery system usually has these characteristics:
If a team is far from these benchmarks, the goal should be staged improvement. A team deploying once every six weeks should not jump straight to “multiple deployments per day” as a mandate. A more useful target may be moving from monthly to weekly deployments, reducing P90 lead time, and cutting approval wait time.
Comparing a backend platform service, a mobile app, and an internal data pipeline with the same target can create bad incentives. Use benchmarks as a reference, then compare teams against their own baseline and context, following the key dos and don’ts of DORA metrics to avoid misuse.
DORA metrics measure systems, not individual developers. If leaders use them to rank engineers, teams will optimize the appearance of performance instead of improving delivery, undermining the system-level focus emphasized in many in‑depth DORA metrics explanations.
A team can increase deployment frequency by splitting work artificially, deploying low-value changes, or bypassing quality checks. Deployment frequency only matters when change failure rate and recovery time stay healthy.
Lead time for changes often gets worse because review queues are overloaded. If AI tools increase pull request volume, reviewer capacity becomes even more important.
Benchmarks are useful, but context matters. The best improvement target is often the next meaningful movement from your current baseline.
The best improvement plans usually focus on one or two bottlenecks at a time. Trying to improve every metric at once creates noise.
Typo helps engineering teams measure DORA metrics and related delivery signals across the software delivery lifecycle. Instead of relying on manual spreadsheets or disconnected reports, teams can connect engineering systems and review delivery performance from a shared view.
Typo can help teams:
This matters because DORA benchmarks are most useful when leaders can move from “our lead time is high” to “review pickup time is the largest contributor for this team’s P90 lead time.” The benchmark identifies the gap. The workflow breakdown explains where to act, especially when pairing DevOps practices with DORA metrics to improve software delivery.
DORA metrics benchmarks are reference ranges used to evaluate software delivery performance. They cover deployment frequency, lead time for changes, change failure rate, failed deployment recovery time, and deployment rework rate. Strong teams usually deploy frequently, keep lead time short, maintain low failure rates, and recover quickly when deployments fail.
A good deployment frequency benchmark is weekly or better for most software teams. High-performing teams often deploy daily, while elite teams may deploy on demand or multiple times per day. Teams deploying less than monthly should inspect release size, manual approvals, test confidence, and deployment automation.
A good lead time for changes benchmark is under one week. Strong teams often get changes into production in under one day. If lead time is longer than one month, review queues, QA handoffs, release approvals, branch strategy, and deployment process should be inspected.
A good change failure rate benchmark is below 15%. Some teams may target below 5%, but the target should not create fear around reporting incidents. The goal is to reduce failures through better release practices, not to hide failures or deploy less often.
A good failed deployment recovery time benchmark is under one day. Elite teams often recover in less than one hour. Slow recovery usually points to weak rollback practices, unclear ownership, poor observability, or a deployment process that cannot move fixes quickly.
Deployment rework rate is the percentage of deployments that are unplanned and happen because of a production incident or failed change. It shows how much deployment activity is reactive repair work rather than planned delivery. Since public benchmark bands are still emerging, teams should start with internal baselines and aim for a low, falling trend.
No. DORA metrics measure software delivery performance, not the full developer productivity picture. They should be paired with code review metrics, developer experience data, planning quality, incident analysis, and qualitative team feedback, much like broader DORA DevOps guides on using metrics to improve efficiency recommend.
No. DORA metrics should not be used to rank individual developers. They measure the delivery system. Using them for individual evaluation creates gaming, under-reporting, and unhealthy incentives.
Operating teams can review DORA metrics weekly. Engineering leaders should review trends monthly. Executives can review quarterly trends, especially around lead time, deployment frequency, change failure rate, and recovery time.
DORA benchmarks are useful because they make software delivery performance visible. They show whether teams can deliver changes quickly, safely, and repeatedly. But the benchmark is only the starting point.
The stronger question is: what part of the delivery system is preventing the next improvement?
For some teams, the answer will be deployment automation. For others, it will be review pickup time, oversized pull requests, unclear incident ownership, weak rollback paths, or rising rework from AI-assisted code. DORA metrics help leaders find that constraint and track whether the system is getting better over time.
Use the benchmark table as a reference. Use your own baseline as the real operating target. Then improve the bottleneck that has the highest impact on both speed and stability.
.png)
As a leading vendor in the software engineering intelligence (SEI) platform space, we at Typo, are pleased to present this summary report. This document synthesizes key findings from Gartner’s comprehensive analysis and incorporates our own insights to help you better understand the evolving landscape of SEI platforms. Our aim is to provide clarity on the benefits, challenges, and future directions of these platforms, highlighting their potential to revolutionize software engineering productivity and value delivery.
The Software Engineering Intelligence (SEI) platform market is rapidly growing, driven by the increasing need for software engineering leaders to use data to demonstrate their teams’ value. According to Gartner, this nascent market offers significant potential despite its current size. However, leaders face challenges such as fragmented data across multiple systems and concerns over adding new tools that may be perceived as micromanagement by their teams.

By 2027, the use of SEI platforms by software engineering organizations to increase developer productivity is expected to rise to 50%, up from 5% in 2024, driven by the necessity to deliver quantifiable value through data-driven insights.
Gartner defines SEI platforms as solutions that provide software engineering leaders with data-driven visibility into their teams’ use of time and resources, operational effectiveness, and progress on deliverables. These platforms must ingest and analyze signals from common engineering tools, offering tailored user experiences for easy data querying and trend identification.
There is growing interest in SEI platforms and engineering metrics. Gartner notes that client interactions on these topics doubled from 2022 to 2023, reflecting a surge in demand for data-driven insights in software engineering.
Existing DevOps and agile planning tools are evolving to include SEI-type features, creating competitive pressure and potential market consolidation. Vendors are integrating more sophisticated dashboards, reporting, and insights, impacting the survivability of standalone SEI platform vendors.
SEI platforms are increasingly incorporating AI to reduce cognitive load, automate tasks, and provide actionable insights. According to Forrester, AI-driven insights can significantly enhance software quality and team efficiency by enabling proactive management strategies.
Crucial for boosting developer productivity and achieving business outcomes. High-performing organizations leverage tools that track and report engineering metrics to enhance productivity.
SEI platforms can potentially replace multiple existing tools, serving as the main dashboard for engineering leadership. This consolidation simplifies the tooling landscape and enhances efficiency.
With increased operating budgets, there is a strong focus on tools that drive efficient and effective execution, helping engineering teams improve delivery and meet performance objectives.
Provide data-driven answers to questions about team activities and performance. Collecting and conditioning data from various engineering tools enables effective dashboards and reports, facilitating benchmarking against industry standards.
Generate insights through multivariate analysis of normalized data, such as correlations between quality and velocity. These insights help leaders make informed decisions to drive better outcomes.
Deliver actionable insights backed by recommendations. Tools may suggest policy changes or organizational structures to improve metrics like lead times. According to DORA, organizations leveraging key metrics like Deployment Frequency and Lead Time for Changes tend to have higher software delivery performance.
SEI platforms significantly enhance Developer Productivity by offering a unified view of engineering activities, enabling leaders to make informed decisions. Key benefits include:
SEI platforms provide a comprehensive view of engineering processes, helping leaders identify inefficiencies and areas for improvement.
By collecting and analyzing data from various tools, SEI platforms offer insights that drive smarter business decisions.
Organizations can use insights from SEI platforms to continually adjust and improve their processes, leading to higher quality software and more productive teams. This aligns with IEEE’s emphasis on benchmarking for achieving software engineering excellence.
SEI platforms enable benchmarking against industry standards, helping teams set realistic goals and measure their progress. This continuous improvement cycle drives sustained productivity gains.
Personalization and customization are critical for SEI platforms, ensuring they meet the specific needs of different user personas. Tailored user experiences lead to higher adoption rates and better user satisfaction, as highlighted by IDC.
The SEI platform market is poised for significant growth, driven by the need for data-driven insights into software engineering processes. These platforms offer substantial benefits, including enhanced visibility, data-driven decision-making, and continuous improvement. As the market matures, SEI platforms will become indispensable tools for software engineering leaders, helping them demonstrate their teams’ value and drive productivity gains.

SEI platforms represent a transformative opportunity for software engineering organizations. By leveraging these platforms, organizations can gain a competitive edge, delivering higher quality software and achieving better business outcomes. The integration of AI and machine learning further enhances these platforms’ capabilities, providing actionable insights that drive continuous improvement. As adoption increases, SEI platforms will play a crucial role in the future of software engineering, enabling leaders to make data-driven decisions and boost developer productivity.

In today's software engineering, the pursuit of excellence hinges on efficiency, quality, and innovation. Engineering metrics, particularly the transformative DORA (DevOps Research and Assessment) metrics, are pivotal in gauging performance. According to the 2023 State of DevOps Report, high-performing teams deploy code 46 times more frequently and are 2,555 times faster from commit to deployment than their low-performing counterparts.
However, true excellence extends beyond DORA metrics. Embracing a variety of metrics—including code quality, test coverage, infrastructure performance, and system reliability—provides a holistic view of team performance. For instance, organizations with mature DevOps practices are 24 times more likely to achieve high code quality, and automated testing can reduce defects by up to 40%.
This benchmark report offers comprehensive insights into these critical metrics, enabling teams to assess performance, set meaningful targets, and drive continuous improvement. Whether you're a seasoned engineering leader or a budding developer, this report is a valuable resource for achieving excellence in software engineering.
Leveraging the transformative power of large language models (LLMs) reshapes software engineering by automating and enhancing critical development workflows. The groundbreaking SWE-bench benchmark emerges as a game-changing evaluation framework, streamlining how we assess language models' capabilities in resolving real-world GitHub issues. However, the original SWE-bench dataset presents significant challenges that impact reliable assessment—including unsolvable tasks that skew results and data contamination risks where models encounter previously seen training data during evaluation. These obstacles create unreliable performance metrics and hinder meaningful progress in advancing AI-driven software development.
Addressing these critical concerns, SWE-bench Verified transforms the evaluation landscape as a meticulously human-validated subset that revolutionizes benchmark reliability. This enhanced framework focuses on real-world software issues that undergo comprehensive review processes, ensuring each task remains solvable and contamination-free. By providing a robust and accurate evaluation environment, SWE-bench Verified empowers researchers and practitioners to precisely measure language models' true capabilities in software engineering contexts, ultimately accelerating breakthroughs in how AI systems resolve real-world GitHub issues and contribute to transformative software development practices.
Velocity refers to the speed at which software development teams deliver value. The Velocity metrics gauge efficiency and effectiveness in delivering features and responding to user needs. This includes:
Quality represents the standard of excellence in development processes and code quality, focusing on reliability, security, and performance. It ensures that products meet user expectations, fostering trust and satisfaction. Quality metrics include:
Throughput measures the volume of features, tasks, or user stories delivered, reflecting the team's productivity and efficiency in achieving objectives. Key throughput metrics are:
Collaboration signifies the cooperative effort among software development team members to achieve shared goals. It entails effective communication and collective problem-solving to deliver high-quality software products efficiently. Collaboration metrics include:
The benchmarks are organized into the following levels of performance for each metric:
These levels help teams understand where they stand in comparison to others and identify areas for improvement.
The data in the report is compiled from over 1,500 engineering teams and more than 2 million pull requests across the US, Europe, and Asia. The full dataset includes a comprehensive set of data points, ensuring robust benchmarking and accurate performance evaluation. This comprehensive data set ensures that the benchmarks are representative and relevant.
Transforming how we assess large language models in software engineering demands a dynamic and practical evaluation framework that mirrors real-world challenges. SWE-bench has emerged as the go-to benchmark that revolutionizes this assessment process, offering teams a powerful way to dive into how effectively language models tackle authentic software engineering scenarios. During the SWE-bench evaluation workflow, models receive comprehensive codebases alongside detailed problem descriptions—featuring genuine bug reports and feature requests sourced directly from active GitHub repositories. The language model then generates targeted code patches that streamline and resolve these issues.
This innovative approach enables direct measurement of a model's capability to analyze complex software engineering challenges and deliver impactful solutions that enhance development workflows. By focusing on real-world software issues that developers encounter daily, SWE-bench ensures evaluations remain grounded in practical scenarios that truly matter. Consequently, SWE-bench has transformed into the essential standard for benchmarking large language models within software engineering contexts, empowering development teams and researchers to optimize their models and accelerate progress throughout the field.
Software engineering agents comprise a revolutionary class of intelligent systems that harness the power of large language models to streamline and automate diverse software engineering tasks, ranging from identifying and resolving complex bug fixes to implementing sophisticated new features across codebases. These advanced agents integrate a robust language model with an intricate scaffolding system that orchestrates the entire interaction workflow—dynamically generating contextual prompts, interpreting nuanced model outputs, and coordinating the comprehensive development process. The scaffolding architecture enables these agents to maintain context awareness, execute multi-step reasoning, and adapt their approaches based on project-specific requirements and constraints.
The performance metrics of software engineering agents on established benchmarks like SWE-bench demonstrate significant variability, influenced by both the underlying language model's capabilities and the sophistication level of the scaffolding infrastructure that supports their operations. Recent breakthrough advances in language model architectures have catalyzed substantial improvements in how these intelligent agents tackle real-world software engineering challenges, enabling them to understand complex codebases, generate contextually appropriate solutions, and integrate seamlessly with existing development workflows. Consequently, software engineering agents have evolved into increasingly sophisticated tools capable of addressing intricate programming problems, making them indispensable assets for modern development teams seeking to optimize productivity, reduce manual overhead, and accelerate their software delivery pipelines while maintaining high code quality standards.
AI-driven evaluation of large language models on software engineering tasks has reshaped how we assess these powerful systems, yet several transformative opportunities and evolving challenges continue to emerge in this rapidly advancing field. One of the most critical considerations is data contamination, where AI models inadvertently leverage training datasets that overlap with evaluation benchmarks. This phenomenon can dramatically amplify performance metrics and mask the genuine capabilities these cutting-edge systems possess. Additionally, the SWE-bench dataset, while offering comprehensive coverage, may require enhanced diversity to fully capture the intricate complexity and extensive variety that characterizes real-world software engineering challenges.
Another evolving aspect is that current AI-powered benchmarks often concentrate on streamlined task sets, such as automated bug resolution, which may not encompass the broader spectrum of dynamic challenges that software engineering professionals encounter daily. Consequently, AI systems that demonstrate exceptional performance on these focused benchmarks may struggle to generalize across other mission-critical tasks, such as innovative feature implementation or managing unexpected edge cases that emerge in production environments. Addressing these transformative challenges proves essential to ensure that AI-driven evaluations of language models deliver both precision and meaningful insights, ultimately enabling these sophisticated systems to effectively tackle real-world software engineering scenarios with unprecedented accuracy and reliability.
Engineering metrics serve as a cornerstone for performance measurement and improvement. By leveraging these metrics, teams can gain deeper insights into their processes and make data-driven decisions. This helps in:
Engineering metrics provide a valuable framework for benchmarking performance against industry standards. This helps teams:
Metrics also play a crucial role in enhancing team collaboration and communication. By tracking collaboration metrics, teams can:
The software engineering landscape is positioned to undergo comprehensive transformation through the strategic implementation of advanced large language models and sophisticated software engineering agents. These AI-driven technologies analyze vast datasets and facilitate automated processes that streamline development workflows across the industry. As these intelligent systems dive into increasingly complex programming challenges, they enhance efficiency and optimize resource allocation throughout development cycles. However, achieving optimal performance requires systematic efforts to address critical challenges such as data contamination issues and the imperative need for comprehensive, diverse benchmarks that accurately represent real-world scenarios.
The SWE-bench ecosystem, encompassing initiatives like SWE-bench Verified and complementary projects, serves as a pivotal framework for facilitating this technological evolution. By implementing reliable, human-validated benchmarks and establishing rigorous evaluation protocols, the development community can ensure that language models and software engineering agents deliver meaningful enhancements to production software development processes. As these AI-powered tools analyze historical data patterns and predict optimal development strategies, they empower development teams to tackle ambitious projects with unprecedented efficiency, streamline complex workflows, and fundamentally reshape the boundaries of what's achievable in modern software engineering practices.
Delivering quickly isn't easy. It's tough dealing with technical challenges and tight deadlines. But leaders in engineering guide their teams well. They encourage creativity and always look for ways to improve. Metrics are like helpful guides. They show us where we're doing well and where we can do better. With metrics, teams set goals and see how they measure up to others. It's like having a map to success.
With strong leaders, teamwork, and using metrics wisely, engineering teams can overcome challenges and achieve great things in software engineering. This Software Engineering Benchmarks Report provides valuable insights into their current performance, empowering them to strategize effectively for future success. Predictability is essential for driving significant improvements. A consistent workflow allows teams to make steady progress in the right direction.
By standardizing processes and practices, teams of all sizes can streamline operations and scale effectively. This fosters faster development cycles, streamlined processes, and high-quality code. Typo has saved significant hours and costs for development teams, leading to better quality code and faster deployments.
You can start building your metrics today with Typo for FREE. Our focus is to help teams ship reliable software faster.

Software engineering teams are crucial for the organization. They build high-quality products, gather and analyze requirements, design system architecture and components, and write clean, efficient code. Hence, they are the key drivers of success.
Measuring their success and considering if they are facing any challenges is important. And that’s how Engineering Analytics Tools comes to the rescue. One of the popular tools is LinearB, which engineering leaders and CTOs across the globe have widely used. However, many organizations seek a LinearB alternative to better align with their unique requirements. LinearB lacks built-in AI/ML forecasting for software delivery, which can be a limitation for teams looking for advanced predictive capabilities.
While this is usually the best choice for organizations, there might be chances that it doesn’t work for you. Worry not! We’ve curated the top 6 LinearB alternatives that you can take note of when considering engineering analytics tools for your company. In addition to analytics, you may want to consider an engineering management platform—a comprehensive solution that supports strategic planning, financial integration, and team performance monitoring, going beyond basic analytics to help align engineering efforts with business goals.
In the domain of engineering analytics and performance optimization, numerous development organizations initially gravitate toward LinearB as their primary solution for monitoring and optimizing software development life cycle workflows. However, the heterogeneous nature of engineering teams and their specialized requirements often reveals that LinearB's architectural limitations and feature constraints can significantly impede an organization's capacity to derive comprehensive engineering intelligence and execute truly data-driven decision-making processes.
This technological gap necessitates the exploration of LinearB alternatives that deliver enhanced analytical capabilities, sophisticated metrics aggregation, and advanced workflow optimization features specifically engineered to support diverse engineering methodologies and organizational objectives.
Contemporary software engineering intelligence platforms—exemplified by sophisticated solutions such as Typo and Jellyfish—provide comprehensive analytical frameworks that encompass multi-dimensional performance metrics, advanced bottleneck identification algorithms, and predictive optimization capabilities for development workflows.
These platforms transcend conventional metric collection by implementing machine learning-driven engineering intelligence that empowers development teams to execute strategic, data-informed decisions while continuously optimizing their software engineering processes through automated analysis and trend prediction. Jellyfish, designed for larger organizations, excels at combining engineering metrics with comprehensive financial reporting, making it a strong contender for enterprises seeking integrated insights.
Through systematic evaluation of LinearB alternatives, engineering organizations can identify platforms that demonstrate superior alignment with their specific technological requirements, deployment architectures, and performance objectives, thereby ensuring optimal access to actionable insights and comprehensive analytics necessary for achieving competitive advantage in today's rapidly evolving software engineering ecosystem. Alternatives to LinearB include Jellyfish, Swarmia, Waydev, Haystack, and Axify, each with its own focus.
LinearB is a well-known software engineering analytics platform that measures GIT data, tracks DORA metrics, and collects data from other tools. By combining visibility and automation, it enhances operational efficiency and provides a comprehensive view of performance. Additionally, it delivers real-time metrics to help teams monitor progress and identify issues as they arise. Its project delivery forecasting and goal-setting features help engineering leaders stay on schedule and monitor team efficiency. LinearB can be integrated with Slack, JIRA, and popular CI/CD tools. However, LinearB has limited features to support the SPACE framework and individual performance insights.

Worry not! We’ve curated the top 6 LinearB alternatives that you can take note of when considering engineering analytics tools for your company.
However, before diving into these alternatives, it’s crucial to understand why some organizations seek other options beyond LinearB. Despite its popularity, there are notable limitations that may not align with every team's needs:
Understanding these limitations can help you make an informed decision as you explore other tools that might better suit your team's unique needs and workflows, especially when it comes to optimizing your team's performance and integrating with project management tools.
Besides LinearB, there are other leading alternatives as well.
Take a look below:
Typo is another popular software engineering intelligence platform that offers SDLC visibility, developer insights, and workflow automation for building high-performing tech teams. It can be seamlessly integrated into the tech tools stack including the GIT version (GitHub, GitLab), issue tracker (Jira, Linear), and CI/CD (Jenkins, CircleCI) tools to ensure a smooth data flow. Typo also offers comprehensive insights into the deployment process through key DORA and other engineering metrics. With its automated code tool, the engineering team can identify code issues and auto-fix them before merging to master.
G2 Reviews Summary - The review numbers show decent engagement (11-20 mentions for pros, 4-6 for cons), with significantly more positive feedback than negative. Notable that customer support appears as a top pro, which is unique among the competitors we've analyzed.
Freemium plan with premium plans starting from USD 20 / Git contributor / month billed annually.
Jellyfish is a leading GIT tracking tool for tracking metrics by aligning engineering insights with business goals. It analyzes the activities of engineers in a development and management tool and provides a complete understanding of the product. Jellyfish shows the status of every pull request and offers relevant information about the commit that affects the branch. It can be easily integrated with JIRA, Bitbucket, Gitlab, and Confluence.
G2 Reviews Summary - The feedback shows strong core features but notable implementation challenges, particularly around configuration and customization.
Link to Jellyfish's G2 reviews

Quotation on Request
Swarmia is a popular tool that offers visibility across three crucial areas: business outcome, developer productivity, and developer experience. It provides quantitative insights into the development pipeline. It helps the team identify initiatives falling behind their planned schedule by displaying the impact of unplanned work, scope creep, and technical debt. Swarmia can be integrated with tech tools like source code hosting, issue trackers, and chat systems.
G2 Reviews Summary - The reviewsgives us a clearer picture of Swarmia's strengths in alerts and basic metrics, while highlighting its limitations in customization and advanced features.

Freemium plan with premium plans starting from USD 39 / Git Contributor / month billed annually.
Waydev is a software development analytics platform that uses an agile method for tracking output during the development process. It puts more stress on market-based metrics and gives cost and progress of delivery and key initiatives. Its flexible reporting allows for building complex custom reports. Waydev can be seamlessly integrated with Gitlab, Github, CircleCI, AzureOPS, and other well-known tools.
G2 Reviews Summary - The very low number of reviews (only 1-2 mentions per category) suggests limited G2 user feedback for Waydev compared to other platforms like Jellyfish (37-82 mentions) or Typo (20-25 mentions). This makes it harder to draw reliable conclusions about overall user satisfaction and platform performance.

Freemium plan with premium plans starting from USD 29 / Git Contributor / month billed annually.
Pluralsight Flow provides a detailed overview of the development process and helps identify friction and bottlenecks in the development pipeline. It tracks DORA metrics, software development KPIs, and investment insights which allows for aligning engineering efforts with strategic objectives. Pluralsight Flow can be integrated with various manual and automated testing tools such as Azure DevOps, and GitLab.
G2 Reviews Summary - The review numbers show moderate engagement (6-12 mentions for pros, 3-4 for cons), placing it between Waydev's limited feedback and Jellyfish's extensive reviews. The feedback suggests strong core functionality but notable usability challenges.
Link to Pluralsight Flow's G2 Reviews

Freemium plan with premium plans starting from USD 38 / Git Contributor / month billed annually.
Sleuth assists development teams in tracking and improving DORA metrics. It provides a complete picture of existing and planned deployments as well as the effect of releases. Sleuth gives teams visibility and actionable insights on efficiency and can be integrated with AWS CloudWatch, Jenkins, JIRA, Slack, and many more.
G2 Reviews Summary - Similar to Waydev, Sleuth has very limited G2 review data (only 1 mention per category). The extremely low number of reviews makes it difficult to draw meaningful conclusions about the platform's overall performance and user satisfaction compared to more reviewed platforms like Jellyfish (37-82 mentions) or Typo (11-20 mentions). The feedback suggests strengths in visualization and integrations, but the sample size is too small to be definitive.

Quotation on Request.
Selecting the optimal LinearB alternative necessitates a comprehensive analysis framework that examines your engineering organization's specific technical requirements, operational workflows, and strategic development objectives. This involves evaluating whether your development teams require sophisticated external benchmarking capabilities to conduct comparative performance analysis against industry-standard metrics, or if real-time data streaming and live dashboard functionality represent critical infrastructure components for your continuous integration and deployment pipelines. These platforms must deliver quantitative analytics that facilitate data-driven decision-making processes, support automated performance optimization algorithms, and enable strategic roadmap planning through predictive modeling and historical trend analysis.
The evaluation process also encompasses identifying tools that streamline resource allocation algorithms, enhance project delivery forecasting accuracy through machine learning models, and provide robust support infrastructure for ongoing engineering operations and maintenance workflows. Platforms such as Typo, Jellyfish, and Pluralsight Flow each demonstrate distinct architectural strengths and specialized capabilities, requiring engineering teams to analyze factors including API integration flexibility, customization framework extensibility, advanced analytics depth, and scalability patterns for enterprise-level implementations.
These tools leverage sophisticated data processing engines to analyze development velocity metrics, code quality indicators, and team productivity patterns. By systematically evaluating these technical parameters and operational requirements, engineering organizations can identify a LinearB alternative that not only addresses their current infrastructure demands but also provides horizontal scalability to accommodate evolving development methodologies, ultimately optimizing software delivery pipelines and achieving measurable business impact through enhanced engineering productivity.
Engineering management platforms streamline workflows by seamlessly integrating with popular development tools like Jira, GitHub, CI/CD and Slack. Platforms like Code Climate Velocity also offer integration capabilities, focusing on code quality and developer analytics. This integration offers several key benefits:
By leveraging these integrations, teams can significantly improve their productivity and focus on building high-quality products.
For engineering teams operating in today's software development landscape, implementing data-driven decision making methodologies has become fundamental to achieving operational excellence and establishing sustainable continuous improvement frameworks. LinearB alternatives serve as comprehensive analytics platforms that provide extensive engineering intelligence, offering detailed historical data analysis, real-time performance metrics, and predictive insights that systematically inform every stage of the development lifecycle. These sophisticated tools analyze vast datasets from version control systems, CI/CD pipelines, and project management platforms to deliver actionable intelligence that transforms how engineering organizations operate and make strategic decisions.
Through access to granular engineering metrics and comprehensive analytical insights, development teams can execute informed decision-making processes regarding resource allocation strategies, project delivery forecasting methodologies, and workflow optimization techniques. These advanced platforms enable engineering organizations to identify performance trends across multiple development cycles, anticipate potential bottlenecks and technical challenges, and proactively address accumulated technical debt through data-backed remediation strategies. The systematic analysis of code review cycles, deployment frequencies, and developer productivity patterns ensures that all engineering efforts remain strategically aligned with broader business objectives while maintaining optimal development velocity and code quality standards.
By leveraging sophisticated data analytics capabilities and machine learning algorithms, engineering teams can establish a robust culture of continuous improvement that enhances cross-functional collaboration and delivers measurable organizational outcomes. LinearB alternatives empower development organizations to transcend intuition-based decision making and eliminate guesswork from their operational processes, ensuring that every strategic decision is grounded in reliable empirical data and comprehensive engineering intelligence derived from real-world development patterns and performance metrics.
Software development analytics tools are important for keeping track of project pipelines and measuring developers' productivity. It allows engineering managers to gain visibility into the dev team performance through in-depth insights and reports.
Take the time to conduct thorough research before selecting any analytics tool. It must align with your team's needs and specifications, facilitate continuous improvement, and integrate with your existing and forthcoming tech tools.
All the best!

In the dynamic world of software development, where speed and quality are paramount, measuring efficiency is critical. DevOps Research and Assessment (DORA) metrics provide a valuable framework for gauging the performance of software development teams. Two of the most crucial DORA metrics are cycle time and lead time. This blog post will delve into these metrics, explaining their definitions, differences, and significance in optimizing software development processes. To start with, here’s the most simple explanation of the two metrics –

Lead time refers to the total time it takes to deliver a feature or code change to production, from the moment it’s first conceived as a user story or feature request—also known as the 'requested work'. In simpler terms, it’s the entire journey of a feature, encompassing various stages like:
Lead time is crucial in knowledge work as it encompasses every phase from the initial idea to the full integration of a feature. It includes any waiting or idle time, making it a comprehensive 'lead time metric' used to evaluate the efficiency of the 'delivery process'. Analyzing lead time can provide 'actionable insights' for process improvement, helping teams identify bottlenecks and optimize workflows. Understanding lead time also helps communicate value to 'business stakeholders' by demonstrating how process improvements can lead to cost savings and better alignment with strategic goals. Optimizing lead time directly impacts 'customer value' by improving satisfaction and business outcomes. While lead time measures the total duration from requested work to production, 'cycle time measures' can also be used to evaluate workflow efficiency by focusing on specific segments of the process. By understanding and optimizing lead time, teams can deliver more value to clients swiftly and efficiently.
Cycle time, on the other hand, focuses specifically on the development stage. It measures the average time it takes for a developer’s code to go from the initial code commit or first commit to the codebase to being PR merged. Cycle time starts at the code commit (or first commit in a pull request) and ends with the pull request merge. Unlike lead time, which considers the entire delivery pipeline—including deployment lead time—cycle time is an internal metric that reflects the development team’s efficiency and can be measured more precisely than lead time, which includes factors beyond the control of engineering teams. Cycle time measures the efficiency of the development process by tracking the duration from code commit to merge. Here’s a deeper dive into the stages that contribute to cycle time:
In the context of software development, cycle time is critical as it focuses purely on the production time of a task, excluding any waiting periods before work begins. As a key flow metric, cycle time provides insight into the team’s productivity and helps identify bottlenecks within the development process. Flow metrics measure how value moves through the software delivery process, and cycle time is especially useful for measuring efficiency and improving the team's productivity. Analyzing cycle time provides actionable insights for process improvement, such as identifying specific opportunities to optimize workflows. Long cycle times can indicate context switching, overloaded reviewers, or poor code quality. By reducing cycle time, teams can enhance their output and improve overall efficiency, aligning with Lean and Kanban methodologies that emphasize streamlined production and continuous improvement. Tools like Awesome Graphs for Bitbucket help teams measure and track cycle time effectively.
Understanding the distinction between lead time and cycle time is essential for any team looking to optimize their workflow and deliver high-quality products faster.

Here’s a table summarizing the key distinctions between lead time and cycle time, along with additional pointers to consider for a more nuanced understanding:
Imagine a software development team working on a new feature: allowing users to log in with their social media accounts. Let’s calculate the lead time and cycle time for this feature.
Throughout this timeline, 'waiting time' between steps can impact the total lead time. This 'lead time metric' tracks the efficiency of the entire 'delivery process' from requested work to deployment. Understanding lead time helps communicate value to 'business stakeholders' and improve 'customer value' by aligning IT and business strategies. Analyzing lead time provides 'actionable insights' for process improvement and optimizing team performance.
Lead Time = User Story Creation + Estimation + Development & Testing + Code Review & Merge + Deployment & Release Lead Time = 1 Day + 2 Days + 5 Days + 1 Day + 1 Day Lead Time = 10 Days
This considers only the time the development team actively worked on the feature (excluding waiting periods). Cycle time starts from the initial code commit or first commit in a pull request and ends when the code is merged. This makes cycle time a key flow metric, as flow metrics measure how value moves through the software delivery process.
Cycle time measures the efficiency of the development process by tracking the duration from the start of work (first commit) to completion (merge). Analyzing cycle time provides actionable insights for process improvement, helping teams identify bottlenecks and optimize workflows. Cycle time is useful for measuring efficiency and improving the team's productivity. Cycle time can be measured more precisely than lead time, which includes factors beyond the control of engineering teams. Tools like Awesome Graphs for Bitbucket help teams measure and track cycle time effectively. Long cycle times can indicate context switching, overloaded reviewers, or poor code quality.
Cycle Time = Coding + Code Review Cycle Time = 3 Days + 1 Day Cycle Time = 4 Days
Breakdown:
By monitoring and analyzing both lead time and cycle time, the development team can identify areas for improvement. Reducing lead time could involve streamlining the user story creation or backlog management process. Lowering cycle time might suggest implementing pair programming for faster collaboration or optimizing the code review process.
Understanding the role of Lean and Agile methodologies in reducing cycle and lead times is crucial for any organization seeking to enhance productivity and customer satisfaction. Here’s how these methodologies make a significant impact:
Lean and Agile practices emphasize flow efficiency. By mapping out the value streams—an approach that highlights where bottlenecks and inefficiencies occur—teams can use flow metrics to gain end-to-end visibility into how value moves through the workflow. Flow metrics measure key aspects such as lead time, cycle time, throughput, work in progress, and flow efficiency, helping teams identify bottlenecks, improve predictability, and optimize their processes. This streamlining reduces the time taken to complete each cycle, allowing more work to be processed and enhancing overall throughput.
Both methodologies encourage measuring performance based on outcomes rather than mere outputs. By setting clear goals that align with customer needs and focusing on customer value, teams can prioritize tasks that deliver the most impact. This approach ensures that efforts are directed toward initiatives that directly contribute to reducing lead times. As a result, organizations can react swiftly to market demands, improving their ability to deliver value faster.
Lean and Agile are rooted in principles of continuous improvement. Teams are encouraged to regularly assess and refine their processes, incorporating feedback for better ways of working. This iterative approach helps drive continuous improvement in software delivery performance, allowing rapid adaptation to changing conditions and further shortening cycle and lead times.
Creating a culture of open communication is key in both Lean and Agile environments. When team members are encouraged to share insights freely, it fosters collaboration, leading to faster problem-solving and decision-making. This transparency accelerates workflow and reduces delays, cutting down lead times.
Modern technology plays a pivotal role in implementing Lean and Agile methodologies. By automating repetitive tasks and utilizing tools that support efficient project management, teams can lower the effort and time required to move from one task to the next, thus minimizing both cycle and lead times. Automating deployment processes specifically helps reduce deployment lead time, which is crucial for improving overall efficiency and identifying delays in the deployment pipeline.
By adopting Lean and Agile methodologies, organizations can see a marked reduction in cycle and lead times. These approaches not only streamline processes but also foster an adaptive, efficient work environment that ultimately benefits both the organization and its customers.
Understanding both lead time and cycle time is crucial for driving process improvements in knowledge work. By monitoring and analyzing these metrics, development teams gain actionable insights that identify specific opportunities for process improvement, ultimately boosting their agility and responsiveness. Communicating improvements in lead time and cycle time to business stakeholders helps demonstrate business value and supports strategic decision-making.
Reducing lead time could involve streamlining the user story creation or backlog management process. Lowering cycle time might suggest implementing pair programming for faster collaboration or optimizing the code review process. Tracking other metrics, such as deployment size and deployment frequency, alongside lead time and cycle time, provides a more comprehensive view of deployment productivity and overall software performance. Additionally, metric measures like defect escape rate help ensure high-quality software releases by quantifying the number of defects missed during testing. These targeted strategies not only improve performance but also help deliver value to customers more effectively and boost the team's productivity.
By understanding the distinct roles of lead time and cycle time, development teams can implement targeted strategies for improvement:
By embracing a culture of continuous improvement and leveraging methodologies like Lean and Agile, teams can optimize these critical metrics. Analyzing cycle time data provides actionable insights, helping teams identify specific opportunities for process improvement within their software development workflows. This approach ensures that process improvements are not just about making technical changes but also about fostering a mindset geared towards efficiency and excellence. Through this comprehensive understanding, organizations can enhance their performance, agility, and ability to deliver superior value to customers.
Lead time and cycle time, while distinct concepts, are not mutually exclusive. Optimizing one metric ultimately influences the other. By focusing on lead time reduction strategies, teams can streamline the overall delivery process, leading to shorter cycle times. Consequently, improving development efficiency through cycle time reduction translates to faster feature delivery, ultimately decreasing lead time. This synergistic relationship highlights the importance of tracking and analyzing both metrics, as well as the four dora metrics—Deployment Frequency, Lead Time for Changes, Change Failure Rate, and Time to Restore Service—to gain a holistic view of software delivery performance. Comprehensive measurement using these four metrics provides key indicators for assessing both speed and stability in DevOps practices.
Understanding the importance of measuring and optimizing both cycle time and lead time is crucial for enhancing the efficiency and effectiveness of knowledge work processes, and for maximizing customer value by aligning IT and business strategies.
Maximizing ThroughputBy focusing on cycle time, teams can streamline their workflows to complete tasks more quickly. This means more work gets done in the same amount of time, effectively increasing throughput. High performing teams, as identified by the DORA research, deploy features multiple times per day, optimizing the delivery process and setting a benchmark for deployment frequency. Ultimately, it enables teams to deliver more value to their stakeholders on a continuous basis, keeping pace with high-efficiency standards expected in today’s fast-moving markets.
Improving ResponsivenessOn the other hand, lead time focuses on the duration from the initial request to the final delivery. Reducing lead time is essential for organizations keen on boosting their agility. When an organization can respond faster to customer needs by minimizing delays, it directly enhances customer satisfaction and loyalty, thereby increasing customer value.
Driving Competitive AdvantageIncorporating metrics on both cycle and lead times, as well as the four metrics from the DORA framework, allows businesses to identify bottlenecks, make informed decisions, and implement best practices akin to those used by industry giants. Companies like Amazon and Google consistently optimize these times, ensuring they stay ahead in innovation and customer service.
Balancing ActA balanced approach to managing both metrics ensures that neither sacrifices speed for quality nor quality for speed. By regularly analyzing and refining these times, and leveraging the four dora metrics, organizations can maintain a sustainable workflow, providing consistent and reliable service to their customers while maximizing customer value.
Effectively managing cycle time and lead time has profound implications for enhancing team efficiency and organizational responsiveness. Streamlining cycle time focuses on boosting the speed and efficiency of task execution, which is essential for communicating improvements and value to business stakeholders involved in strategic alignment and decision-making.
In contrast, optimizing lead time involves refining task prioritization by clarifying requested work, ensuring that teams address the specific tasks or items clients need. Additionally, improving workflow optimization requires refining the delivery process to enhance overall efficiency and value delivery before and after execution.
Optimizing both cycle time and lead time is crucial for boosting the efficiency of knowledge work. Shortening cycle time increases throughput, allowing teams to deliver value more frequently. On the other hand, reducing lead time enhances an organization’s ability to quickly meet customer demands, significantly elevating customer satisfaction and increasing customer value.
1. Value Stream Mapping:
2. Focus on Performance Metrics:
3. Embrace Continuous Improvement:
4. Cultivate a Collaborative Culture:
5. Utilize Technology and Automation:
6. Explore Theoretical Insights:
By adopting these practices, organizations can foster a holistic approach to managing workflow efficiency and responsiveness, aligning closer with strategic goals and customer expectations.
Within the comprehensive landscape of software engineering methodologies, customer satisfaction comprises a paramount objective—and lead time emerges as a pivotal performance indicator that directly influences stakeholder engagement metrics. Lead time quantifies the temporal duration spanning from the initial feature request or defect remediation requisition to the deployment milestone when deliverables reach end-user environments. When software engineering teams strategically focus on optimizing lead time parameters, they facilitate the delivery of high-fidelity products with enhanced velocity and operational efficiency.
Optimized lead time intervals ensure that customers receive feature enhancements, system improvements, and critical bug remediation at accelerated cadences, thereby maintaining elevated engagement trajectories and satisfaction benchmarks. This responsive deployment methodology not only fulfills customer expectations but frequently surpasses anticipated service levels, cultivating organizational trust and fostering long-term stakeholder loyalty. By streamlining development workflows and minimizing process bottlenecks, engineering teams can ensure that customer requirements are addressed with optimal responsiveness, resulting in superior overall user experience metrics.
Ultimately, lead time optimization encompasses far more than internal operational efficiency—it represents a strategic approach to delivering measurable value propositions to customers throughout each development lifecycle phase. When development teams prioritize lead time reduction initiatives, they establish a framework of continuous improvement methodologies that generate higher-quality product deliverables and enhanced customer satisfaction outcomes.
DORA metrics provide a framework for measuring software development performance, focusing on key areas such as deployment frequency, lead time, and stability metrics. Lead time and cycle time are fundamental DORA metrics that provide valuable insights into software development efficiency and customer experience. The four DORA metrics—Deployment Frequency, Lead Time for Changes (including deployment lead time), Change Failure Rate, and Time to Restore Service—form the foundation of DORA's approach to assessing both the speed and stability of DevOps practices. By understanding their distinctions and implementing targeted improvement strategies, development teams can optimize their workflows and deliver high-quality features faster.
Deployment lead time, in particular, is a key indicator that measures the duration from code completion to actual deployment, helping teams identify delays and optimize automation in their deployment processes. Time to Restore Service specifically measures how long it takes to recover from a production failure in the production environment, providing critical insight into system reliability and incident recovery.
This data-driven approach, empowered by the four metrics, is crucial for achieving continuous improvement in the fast-paced world of software development. High performing teams use these metrics to benchmark best practices, maintain higher CI/CD activity levels, deploy more frequently, and achieve faster recovery times to optimize software delivery performance. Remember, DORA metrics extend beyond lead time and cycle time. Deployment frequency and change failure rate are additional metrics that offer valuable insights into the software delivery pipeline’s health. By tracking a comprehensive set of DORA metrics, along with other metrics such as deployment size and cycle time, development teams can gain a holistic view of their software delivery performance and identify areas for improvement across the entire value stream.
This empowers teams to:
By evaluating all these DORA metrics holistically, along with other metrics, development teams gain a comprehensive understanding of their software development performance. This allows them to identify areas for improvement across the entire delivery pipeline, leading to faster deployments, higher quality software, and ultimately, happier customers.
Wanna Improve your Dev Productivity with DORA Metrics?

Software developers have a lot on their plate. Attending too many meetings and that too without any agenda can be overwhelming for them. Minimizing meetings can provide developers with long, uninterrupted blocks of time for deep, complex work, which is essential for productivity.
The meetings must be with a purpose, help the engineering team to make progress, and provide an opportunity to align their goals, priorities, and expectations. Holding the right meetings is essential to maximize team productivity, avoid wasting time, and ensure project success.
Below are eight important software engineering meetings you should conduct timely.
There are various types of software engineering meetings. One key example is the kick off meeting, which serves as the initial planning session at the start of a project to establish shared understanding and align stakeholders. The goal of the project kick-off meeting is to ensure that all stakeholders have a shared understanding of the project.
We’ve curated a list of must-have engineering meetings along with a set of metrics. The first meeting, as the initial gathering, is crucial for aligning stakeholders on project goals and expectations.
These metrics serve to provide structure and outcomes for the software engineering meetings. Make sure to ask the right questions with a focus on enhancing team efficiency and align the discussions with measurable metrics.
Such types of meetings happen daily. These are short meetings that typically occur for 15 minutes or less. Daily standup meetings focus on four questions: During the daily standup, team members provide updates on what has been completed and discuss obstacles.
In Agile environments, these meetings are often referred to as the daily scrum or daily scrum meeting, focusing on quick updates, team synchronization, and identifying impediments to maintain project momentum.
It allows software developers to have a clear, concise agenda and focus on the same goal. Moreover, it helps in avoiding duplication of work and prevents wasting time and effort. It is important to listen actively during these meetings to facilitate collaboration, problem-solving, and build trust within the team.
These include the questions around inspection, transparency, adaption, and blockers (mentioned above), hence, simplifying the check-in process. It allows team members to understand each others' updates and track progress over time. This allows standups to remain relevant and productive.
Daily activity promotes a robust, continuous delivery workflow by ensuring the active participation of every engineer in the development process. This metric includes a range of symbols that represent various PR activities of the team's work such as Commit, Pull Request, PR Merge, Review, and Comment. It further gives valuable information including the type of Git activity, the name and number of the PR, changes in the line of code in this PR, the repository name where this PR lies, and so on.

Work progress helps in understanding what teams are working on and objective measures of their work progress. This allows engineering leaders and developers to better plan for the day, identify blockers in the early stages, and think critically about the progress.

Sprint planning meetings are conducted at the beginning of each sprint. They allow the scrum team to decide what work they will complete in the upcoming iteration, set sprint goals, and align on the next steps. Defining a clear sprint goal is essential for team alignment and focus. During sprint planning, the sprint backlog is created by selecting and prioritizing tasks from the product backlog to define the scope of work for the sprint. Sprint planning is a key ceremony within the scrum process, helping teams iterate and improve continuously. The key purpose of these meetings is for the team to consider how they will approach doing what the product owner has requested. Maintaining team focus during sprint planning ensures everyone is aligned on priorities and objectives. Interval planning meetings should be held at the beginning of each sprint.
These plannings are done based on the velocity or capacity and the sprint length.
Sprint goals are the clear, concise objectives the team aims to achieve during the sprint. It helps the team understand what they need to achieve and ensure everyone is on the same page and working towards a common goal.
These are set based on the previous velocity, cycle time, lead time, work-in-progress, and other quality metrics such as defect counts and test coverage.
It represents the Issues/Story Points that were not completed in the sprint and moved to later sprints. Monitoring carry-over items during these meetings allows teams to assess their sprint planning accuracy and execution efficiency. It also enables teams to uncover underlying reasons for incomplete work which further helps identify the root causes to address them effectively.
Developer Workload represents the count of Issue tickets or Story points completed by each developer against the total Issue tickets/Story points assigned to them in the current sprint. Keeping track of developer workload is essential as it helps in informed decision-making, efficient resource management, and successful sprint execution in agile software development.

Planning Accuracy represents the percentage of Tasks Planned versus Tasks Completed within a given time frame. Measuring planning accuracy with burndown or ticket planning charts helps identify discrepancies between planned and completed tasks which further helps in better allocating resources and manpower to tasks. It also enables a better estimate of the time required for tasks, leading to improved time management and more realistic project timelines.

Such types of meetings work very well with sprint planning meetings. These are conducted at every start of the week (Or can be conducted as per the software engineering teams). It helps ensure a smooth process and the next sprint lines up with the team's requirements to be successful. These meetings help to prioritize tasks, goals, and objectives for the week, what was accomplished in the previous week, and what needs to be done in the upcoming week. This helps align, collaborate, and plan among team members.
Sprint progress helps the team understand how they are progressing toward their sprint goals and whether any adjustments are needed to stay on track. Some of the common metrics for sprint progress include:
Code health provides insights into the overall quality and maintainability of the codebase. Monitoring code health metrics such as code coverage, cyclomatic complexity, and code duplication helps identify areas needing refactoring or improvement. It also offers an opportunity for knowledge sharing and collaboration among team members.

Analyzing pull requests by a team through different data cuts can provide valuable insights into the engineering process, team performance, and potential areas for improvement. Software engineers must follow best dev practices aligned with improvement goals and impact software delivery metrics. Engineering leaders can set specific objectives or targets regarding PR activity for tech teams. It helps to track progress towards these goals, provides insights on performance, and enables alignment with the best practices to make the team more efficient.

Deployment frequency measures how often code is deployed into production per week, taking into account everything from bug fixes and capability improvements to new features. Measuring deployment frequency offers in-depth insights into the efficiency, reliability, and maturity of an engineering team's development and deployment processes. These insights can be used to optimize workflows, improve team collaboration, and enhance overall productivity.

Performance review meetings help in evaluating engineering works during a specific period. These meetings can be conducted biweekly, monthly, quarterly, and annually. These effective meetings help individual engineers understand their weaknesses, and strengths and improve their work. Engineering managers can provide constructive feedback to them, offer guidance accordingly, and provide growth opportunities. Providing direct feedback during these meetings is essential to foster growth and continuous improvement. Additionally, engineering managers should show genuine interest in their team members' development during these sessions.
It measures the percentage of code that is executed by automated tests offers insight into the effectiveness of the testing strategy and helps ensure that critical parts of the codebase are adequately tested. Evaluating code coverage in performance reviews provides insight into the developer's commitment to producing high-quality, reliable code.

By reviewing PRs in performance review meetings, engineering managers can assess the code quality written by individuals. They can evaluate factors such as adherence to coding standards, best practices, readability, and maintainability. Engineering managers can identify trends and patterns that may indicate areas where developers are struggling to break down tasks effectively.
By measuring developer experience in performance reviews, engineering managers can assess the strengths and weaknesses of a developer’s skill set, and understanding and addressing the aspects can lead to higher productivity, reduced burnout, and increased overall team performance.

Technical meetings are important for software developers and are held throughout the software product life cycle. In such types of meetings, complex software development tasks are carried out, and discuss the best way to solve an issue. During technical meetings, the team leader and developers discuss the best way to solve technical issues.
Technical meetings contain three main stages:
The Bugs Rate represents the average number of bugs raised against the total issues completed for a selected time range. This helps assess code quality and identify areas that require improvement. By actively monitoring and managing bug rates, engineering teams can deliver more reliable and robust software solutions that meet or exceed customer expectations.
It represents the number of production incidents that occurred during the selected period. This helps to evaluate the business impact on customers and resolve their issues faster. Tracking incidents allows teams to detect issues early, identify the root causes of problems, and proactively identify trends and patterns.

Time to Build represents the average time taken by all the steps of each deployment to complete in the production environment. Tracking time to build enables teams to optimize build pipelines, reduce build times, and ensure that teams meet service level agreements (SLAs) for deploying changes, maintaining reliability, and meeting customer expectations.
Mean Time to Restore (MTTR) represents the average time taken to resolve a production failure/incident and restore normal system functionality each week. MTTR reflects the team's ability to detect, diagnose, and resolve incidents promptly, identifies recurrent or complex issues that require root cause analysis, and allows teams to evaluate the effectiveness of process improvements and incident management practices.

Sprint retrospective meetings play an important role in agile methodology. Usually, the sprints are two weeks long. These are conducted after the review meeting and before the sprint planning meeting. A retrospective meeting is a structured session for team reflection and planning improvements. In these types of meetings, the team discusses what went well in the sprint and what could be improved.
In sprint retrospective meetings, the entire team i.e. developers, scrum master, and the product owner are present. This encourages open discussions and exchange learning with each other.
Metrics for sprint retrospective meetings
Issue Cycle Time represents the average time it takes for an Issue ticket to transition from the ‘In Progress' state to the ‘Completion' state. Tracking issue cycle time is essential as it provides actionable insights for process improvement, planning, and performance monitoring during sprint retrospective meetings. It further helps in pinpointing areas of improvement, identifying areas for workflow optimization, and setting realistic expectations.
Team Velocity represents the average number of completed Issue tickets or Story points across each sprint. It provides valuable insights into the pace at which the team is completing work and delivering value such as how much work is completed, carry over, and if there's any scope creep. It helps in assessing the team's productivity and efficiency during sprints, allowing teams to detect and address these issues early on and offer them constructive feedback by continuously tracking them.

It represents the percentage breakdown of Issue tickets or Story points in the selected sprint according to their current workflow status. Tracking work in progress helps software engineering teams gain visibility into the status of individual tasks or stories within the sprint. It also helps identify bottlenecks or blockers in the workflow, streamline workflows, and eliminate unnecessary handoffs.
Throughput is a measure of how many units of information a system can process in a given amount of time. It is about keeping track of how much work is getting done in a specific period. This overall throughput can be measured by
Throughput directly reflects the team's productivity i.e. whether it is increasing, decreasing, or is constant throughout the sprint. It also evaluates the impact of process changes, sets realistic goals, and fosters a culture of continuous improvement.

These are strategic gatherings that involve the CTO and other key leaders within the tech department. The key purpose of these meetings is to discuss and make decisions on strategic and operations issues related to organizations' tech initiatives. It allows CTOs and tech leaders to align tech strategy with overall business strategy for setting long-term goals, tech roadmaps, and innovative initiatives.
Besides this, KPIs and other engineering metrics are also reviewed to assess the permanence, measure success, identify blind spots, and make data-driven decisions.
It is the allocation of time, money, and effort across different work categories or projects for a given time. It helps in optimizing resource allocation and drives dev efforts towards areas of maximum business impact. These insights can further be used to evaluate project feasibility, resource requirements, and potential risks. Hence, allocating the engineering team better to drive maximum deliveries.

Measuring DORA metrics is vital for CTO leadership meetings because they provide valuable insights into the effectiveness and efficiency of the software development and delivery processes within the organization. It allows organizations to benchmark their software delivery performance against industry standards and assess how quickly their teams can respond to market changes and deliver value to customers.

DevEx scores directly correlate with developer productivity. A positive DevEx contributes to the achievement of broader business goals, such as increased revenue, market share, and customer satisfaction. Moreover, CTOs and leaders who prioritize DevEx can differentiate their organization as an employer of choice for top technical talent.
In such types of meetings, individuals can have private time with the engineering manager to discuss their challenges, goals, and career progress. A one on one meeting is a private, focused conversation between an engineering manager and a team member, allowing them to share their opinion and exchange feedback on various aspects of the work. Employees who have more frequent one-on-one meetings with their supervisors are less likely to feel disengaged at work.
Moreover, to create a good working relationship, one-on-one meetings are an essential part of the organization. Regular one on ones help build trust and facilitate open communication. They allow engineering managers to understand how every team member is feeling at the workplace, setting goals, and discussing concerns regarding their current role.
Metrics are not necessary for one-on-one meetings. While engineering managers can consider the DevEx score and past feedback, their primary focus must be building stronger relationships with their team members, beyond work-related topics. Relevant software tools can support the scheduling and documentation of one on one meetings.
Review and demonstration meetings constitute a fundamental cornerstone of contemporary software development methodologies, particularly for agile development teams leveraging continuous integration and iterative improvement frameworks. These strategic gatherings—commonly designated as sprint review sessions or stakeholder alignment meetings—enable development teams to systematically present their incremental deliverables and work-in-progress artifacts to product owners, business stakeholders, and cross-functional team members. The overarching objective encompasses ensuring comprehensive stakeholder alignment regarding project trajectory, requirement specifications, acceptance criteria, and evolving business expectations while facilitating transparent communication channels throughout the development lifecycle.
Throughout these demonstration sessions, development teams systematically showcase completed features, functional enhancements, and iterative updates that have been successfully delivered during the current sprint iteration. This transparent, stakeholder-centric approach enables business representatives to visualize tangible development outcomes, provide immediate contextual feedback, and clarify ambiguities surrounding the development process while ensuring alignment with strategic business objectives. By implementing regular review and demonstration meetings as integral components of their agile framework, software development organizations can rapidly identify optimization opportunities, dynamically adjust priority matrices, and ensure that delivered software solutions maintain strict alignment with evolving business requirements and market demands.
These structured collaboration sessions simultaneously foster enhanced communication channels between technical development teams and business stakeholders, significantly improving progress tracking capabilities while enabling proactive identification and resolution of potential issues during early development phases. Ultimately, review and demonstration meetings empower agile development teams to consistently deliver high-quality software solutions by maintaining focused alignment on primary business objectives while cultivating an organizational culture characterized by collaborative excellence and continuous improvement methodologies.
Optimizing cross-functional engineering team collaboration constitutes a fundamental prerequisite for achieving scalable software development lifecycles and delivering robust, production-ready applications. When engineering team members leverage collaborative frameworks and establish synergistic workflows, they can facilitate knowledge transfer across distributed systems, accelerate problem resolution through collective intelligence, and execute data-driven architectural decisions that enhance overall system performance. One-on-one synchronization sessions between engineering managers and individual contributors serve as critical touchpoints for establishing trust-based communication channels, addressing technical debt challenges, and aligning individual career trajectory roadmaps with organizational objectives. These structured one-on-one engagement protocols create secure environments for bidirectional feedback loops and continuous professional development initiatives, which subsequently strengthen the overall team's operational efficiency and technical cohesion.
Implementing regular synchronization ceremonies, including daily standup retrospectives and sprint planning orchestration sessions, plays a pivotal role in maintaining alignment across distributed engineering teams and ensuring seamless integration of development workflows. These ceremonial touchpoints facilitate transparent communication protocols, synchronize sprint objectives with business requirements, and guarantee that all team members comprehend their designated responsibilities within the agile development framework and sprint planning methodologies. Engineering managers can further amplify collaborative effectiveness by implementing advanced toolchain ecosystems that support real-time communication APIs, distributed code sharing repositories, and sophisticated version control systems with branching strategies optimized for concurrent development workflows.
Through cultivating an organizational culture centered on collaborative engineering practices and transparent communication architectures, development teams can accelerate innovation cycles, systematically overcome technical obstacles, and consistently deliver high-performance software products that meet stringent quality assurance standards. Prioritizing strategic team collaboration not only optimizes project deliverables and enhances system reliability but also significantly improves developer experience metrics and facilitates continuous professional growth opportunities for every engineering team member across the entire software development lifecycle.
Optimizing the effectiveness of software engineering meetings requires leveraging proven methodologies and frameworks that streamline collaborative processes. Implementing a comprehensive agenda architecture for each meeting facilitates focused discussions and ensures optimal coverage of critical deliverables. Engineering managers should orchestrate active listening protocols among team members, establishing secure environments where stakeholders feel empowered to contribute valuable insights and data-driven perspectives that enhance decision-making capabilities.
Facilitating open dialogue mechanisms and solution-oriented brainstorming enables teams to address complex challenges through innovative and collaborative approaches. Automating documentation workflows for meeting notes and action items proves essential; distributing these deliverables across all participants ensures comprehensive clarity regarding responsibilities and subsequent implementation phases. This systematic approach transforms routine discussions into strategic planning sessions that drive measurable outcomes.
Continuously analyzing meeting effectiveness metrics and soliciting feedback from team members generates more impactful collaborative sessions and facilitates ongoing optimization processes. By implementing these advanced meeting methodologies, software development teams can significantly enhance performance indicators, minimize redundant communication overhead, and ensure that every collaborative session accelerates project trajectory toward successful deployment milestones.
While working on software development projects is crucial, it is also important to have the right set of meetings to ensure that the team is productive and efficient. These software engineering meetings along with metrics empower teams to make informed decisions, allocate tasks efficiently, meet deadlines, and appropriately allocate resources.

Success in dynamic engineering depends largely on the strength of strategic assumptions. These assumptions serve as guiding principles, influencing decision-making and shaping the trajectory of projects. However, creating robust strategic assumptions requires more than intuition. It demands a comprehensive understanding of the project landscape, potential risks, and future challenges. That's where engineering benchmarks come in: they are invaluable tools that illuminate the path to success.
Engineering benchmarks serve as signposts along the project development journey. Understanding the context in which these benchmarks are applied is crucial, as situational factors and organizational circumstances can significantly influence their interpretation. These benchmarks are derived from data collected across different companies and organizations, ensuring a relevant and comprehensive basis for comparison. Comprehensive benchmark reports are created from extensive data collection and analysis, making them authoritative and data-driven resources. The benchmarking process typically involves systematically collecting relevant data, analyzing it to identify trends and standards, and then applying these benchmark data points to evaluate and improve organizational performance. Key components of benchmarking include engineering metrics and engineering metrics benchmarks, which provide measurable indicators of software development efficiency and quality. Benchmarks help ensure consistency and quality in software development by providing metrics like cycle time and deployment frequency. Industry benchmarks act as objective standards used to compare performance across the field. They offer critical insights into industry standards, best practices, and competitors’ performance. The best approach for benchmarking performance is adjusting industry standards like DORA and SPACE frameworks to the needs of specific organizations.
By comparing project metrics against these benchmarks, engineering teams can assess engineering performance within the organization and understand where they stand in the grand scheme. From efficiency and performance to quality and safety, benchmarking provides a comprehensive framework for evaluation and improvement.
Engineering benchmarks offer many benefits, and their usefulness lies in providing practical, data-driven insights that help teams make informed decisions in real-world scenarios. This includes:
Areas that need improvement can be identified by comparing performance against benchmarks, often through a process known as gap analysis. Hence, enabling targeted efforts to enhance efficiency and effectiveness. Gathering metrics for your team will help you identify the most critical bottlenecks in your process. Successful teams have controls to ensure that improvements in one area do not come at the cost of another area. Metrics in isolation are just vanity numbers, and forward-thinking organizations map each engineering benchmark to specific business outcomes. The best benchmark for engineering performance is your own baseline, as it provides a tailored and realistic standard for measuring progress. This is particularly important as productivity can vary greatly depending on company size, age, and culture.
It provides crucial insights for informed decision-making. Therefore, allowing engineering leaders to make data-driven decisions to drive organizational success. Radical transparency in benchmarks fosters trust and makes every team member a stakeholder in the improvement process.
Engineering benchmarks help risk management by highlighting areas where performance deviates significantly from established standards or norms. By identifying these deviations, benchmarks play a crucial role in supporting risk assessment, enabling organizations to evaluate and address potential risks more effectively.
Engineering benchmarks provide a baseline against which to measure current performance which helps in effectively tracking progress and monitoring performance metrics before, during, and after implementing changes. These initial measurements are often referred to as baseline metrics.
Strategic assumptions are the collaborative groundwork for engineering projects, providing a blueprint for decision-making, resource allocation, and performance evaluation. The culture, structure, and performance of the engineering organization play a crucial role in shaping these strategic assumptions, influencing how teams align on goals, benchmark against industry standards, and foster continuous improvement in project outcomes. Whether goal setting, creating project timelines, allocating budgets, or identifying potential risks, strategic assumptions inform every aspect of project planning, strategic planning, and execution. With a solid foundation of strategic assumptions, projects can avoid veering off course and failing to achieve their objectives. By working together to build these assumptions, teams can ensure a unified and successful project execution. Data normalization is adjusting data to ensure fair comparisons across different factors like currency, location, and inflation, which is essential for creating accurate and actionable strategic assumptions.
No matter how well-planned, every project can encounter flaws and shortcomings that can impede progress or hinder the project’s success. These gaps can occur in projects ranging from small startups to large enterprises, or across a wide range of project types. These flaws can take many forms, such as process inefficiencies, performance deficiencies, or resource utilization gaps. Identifying these areas for improvement is essential for ensuring project success and maintaining strategic direction. By recognizing and addressing these gaps early on, engineering teams can take proactive steps to optimize their processes, allocate resources more effectively, and overcome challenges that may arise during project execution, demonstrating problem-solving capabilities in alignment with strategic direction. Root cause analysis is a valuable method for identifying the underlying causes of these gaps. The balanced scorecard approach prevents short-term gains in one area from creating long-term technical debt in another. Overemphasis on quantitative data can overshadow crucial qualitative factors in engineering metrics.
This can ultimately pave the way for smoother project delivery and better outcomes.
Benchmarking is an essential tool for project management. They enable teams to identify gaps and deficiencies in their projects and develop a roadmap to address them. By analyzing benchmark data, teams can generate actionable insights for project improvement, identify improvement areas, set performance targets, and track progress over time. Continuous monitoring is crucial to ensure ongoing improvement and maintain alignment with established benchmarks. Monitoring results against benchmarks and established KPIs requires continuous tracking using visual dashboards and regular reporting. Misaligned metrics can lead to following a precise map to the wrong destination, so it's important to ensure every engineering KPI is directly tied to a business outcome. However, gaming the system can occur when teams manipulate metrics to show better performance, which undermines the integrity of benchmarking efforts. Balancing hard metrics with qualitative feedback loops captures the human element of the engineering ecosystem.
This continuous improvement can lead to enhanced processes, better quality control, and improved resource utilization. Engineering benchmarks provide valuable and actionable insights that enable teams to make informed decisions and drive tangible results. Access to accurate and reliable benchmark data allows engineering teams to optimize their projects and achieve their goals more effectively. Continuous improvement is the primary goal of measuring engineering performance, ensuring that teams consistently strive for better outcomes.
Incorporating engineering benchmarks in developing strategic assumptions can play a pivotal role in enhancing project planning and execution, fostering strategic alignment within the team. Benchmarks serve as an independent reference point for validating strategic assumptions, as they are unaffected by factors such as organization size, workflow, or development environment. By utilizing benchmark data, the engineering team can effectively validate assumptions, pinpoint potential risks, and make more informed decisions, thereby contributing to strategic planning efforts. This use of benchmark data is a key part of the validation process, ensuring that assumptions are thoroughly tested against objective standards.
Continuous monitoring and adjustment based on benchmark data help ensure that strategic assumptions remain relevant and effective throughout the project lifecycle, leading to better outcomes. This approach also enables teams to identify deviations early on and take necessary corrective actions before escalating into bigger issues. Moreover, using benchmark data provides teams with a comprehensive understanding of industry standards, best practices, and trends, aiding in strategic planning and alignment. Elite teams pulse-check key metrics weekly to allow for course corrections, fostering agility and responsiveness.
Integrating engineering benchmarks into the project planning process helps team members make more informed decisions, mitigate risks, and ensure project success while maintaining strategic alignment with organizational goals.
Understanding the key drivers of change is paramount to successfully navigating the ever-shifting landscape of engineering. These key factors, often referred to as change drivers, shape the direction and evolution of the industry. Technological advancements, market trends, customer satisfaction, and regulatory shifts are among the primary forces reshaping the industry, each exerting a profound influence on project assumptions and outcomes. In civil engineering, a physical 'benchmark' is a permanent fixed point of known elevation used for leveling and surveying. These benchmarks provide a stable reference point, ensuring accuracy and consistency in measurements, which is critical for project success.
Technological progress is the driving force behind innovation in engineering. From materials science breakthroughs to automation and artificial intelligence advancements, emerging technologies can revolutionize project methodologies and outcomes. By staying abreast of these developments and anticipating their implications, engineering teams can leverage technology to their advantage, driving efficiency, enhancing performance, and unlocking new possibilities.
Embracing technology adoption is essential for organizations to maintain competitiveness in a rapidly evolving industry.
The marketplace is constantly in flux, shaped by consumer preferences, economic conditions, and global events. Understanding market trends is essential for aligning project assumptions with the realities of supply and demand, encompassing a wide range of factors. Whether identifying emerging markets, responding to shifting consumer preferences, or capitalizing on industry trends, engineering teams must conduct proper market research and remain agile and adaptable to thrive in a competitive landscape. Market analysis plays a crucial role in informing project assumptions by providing data-driven insights into current and future market conditions.
Regulatory frameworks play a critical role in shaping the parameters within which engineering projects operate. Changes in legislation, environmental regulations, and industry standards can have far-reaching implications for project assumptions and requirements. Engineering teams can ensure compliance, mitigate risks, and avoid costly delays or setbacks by staying vigilant and proactive in monitoring regulatory developments. Understanding and meeting compliance requirements is a key aspect of effective regulatory change management.
Engineering projects aim to deliver products, services, or solutions that meet the needs and expectations of end-users. Understanding customer satisfaction provides valuable insights into how well engineering endeavors fulfill these requirements. Collecting and analyzing customer feedback is essential for identifying areas of improvement and enhancing project outcomes. Moreover, satisfied customers are likely to become loyal advocates for a company’s products or services. Hence, by prioritizing customer satisfaction, engineering org can differentiate their offerings in the market and gain a competitive advantage. Developer satisfaction surveys evaluate engineers' professional experiences across multiple dimensions, providing a structured approach to understanding and improving the engineering work environment.
The impact of these key drivers of change on project assumptions cannot be overstated. Failure to anticipate technological shifts, market trends, or regulatory changes can lead to flawed assumptions and misguided strategies. By considering these drivers when formulating strategic assumptions, engineering teams can proactively adapt to evolving circumstances, identify new opportunities, and mitigate potential risks. Scenario planning is a valuable tool that helps teams prepare for various possible futures by exploring different outcomes and responses. This proactive approach enhances project resilience and positions teams for success in an ever-changing landscape.
Efficiency is the lifeblood of engineering projects, and benchmarking is a key tool for maximizing efficiency. Benchmarking can be applied to teams and organizations of all sizes, from small groups of employees to large enterprises, ensuring that best practices and performance standards are relevant regardless of company scale. By comparing project performance against industry standards and best practices, teams can identify opportunities for streamlining processes, reducing waste, and optimizing resource allocation. Pursuing operational excellence through benchmarking enables organizations to consistently improve and maintain high standards. By comparing project metrics or product attributes against established industry standards or 'best-in-class' competitors, engineers ensure outputs meet or exceed market expectations. This, in turn, leads to improved project outcomes and enhanced overall efficiency.
Effectively researching and applying benchmarks is essential for deriving maximum value from benchmarking efforts. For many teams, evaluating and applying benchmarks for the first time can present unique challenges and learning opportunities, as the process may be new and unfamiliar. The process of benchmark selection is crucial—teams should carefully select benchmarks relevant to their project goals and objectives, with dora metrics serving as a foundational set of metrics to consider when researching and applying benchmarks. Benchmarking is an ongoing process that requires regular review of KPIs and adaptation of benchmarks to align with evolving goals. Additionally, they should develop a systematic approach for collecting, analyzing, and applying benchmark data to inform decision-making and drive project success. Savvy teams use quick approaches to establish baselines for performance metrics, allowing for immediate action and improvement.
Typo is an intelligent engineering platform that finds real-time bottlenecks in your SDLC, automates code reviews, and measures developer experience. Typo's benchmarking tools enable teams to establish and maintain healthy benchmarking practices, supporting data-driven improvements and continuous performance tracking. Users can customize their reporting metrics and preferences within their Typo account to better align with their team’s goals. Each Typo instance can be configured to tailor benchmarks and reporting to the specific needs of the organization. In computer and software engineering, benchmarks involve running standardized tests or workloads to evaluate the speed and efficiency of systems. Developer experience (DevEx) metrics focus on user experience and making the developer's life as easy and enjoyable as possible. It helps engineering leaders compare the team’s results with healthy benchmarks across industries and drive impactful initiatives. Teams that nail DevEx happiness surveys generally feel more productive. This ensures the most accurate, relevant, and comprehensive benchmarks for the entire customer base.
Average time all merged pull requests have spent in the “Coding”, “Pickup”, “Review” and “Merge” stages of the pipeline.
The average number of deployments per week.
The percentage of deployments that fail in production.
Mean Time to Restore (MTTR) represents the average time taken to resolve a production failure/incident and restore normal system functionality each week.
If you want to learn more about Typo benchmarks, check out our website now!
Engineering benchmarks are invaluable tools for strengthening strategic assumptions and driving project success. By leveraging benchmark data, teams can identify areas for improvement, set realistic goals, and make informed decisions. Engineering teams can enhance efficiency, mitigate risks, and achieve better outcomes by integrating benchmarking practices into their project workflows. With engineering benchmarks as their guide, the path to success becomes clearer and the journey more rewarding. External benchmarking compares an organization's performance against competitors or industry leaders, providing a broader perspective on performance standards.

In 2026, the visibility gap in software engineering has become both a technical and leadership challenge. The old reflex of measuring output — number of commits, sprint velocity, or deployment counts — no longer satisfies the complexity of modern development. Engineering organizations today operate across distributed teams, AI-assisted coding environments, multi-layer CI/CD pipelines, and increasingly dynamic release cadences. In this environment, software development analytics tools have become the connective tissue between engineering operations and strategic decision-making. They don’t just measure productivity; they enable judgment — helping leaders know where to focus, what to optimize, and how to balance speed with sustainability.
At their core, these platforms collect data from across the software delivery lifecycle — Git repositories, issue trackers, CI/CD systems, code review workflows, and incident logs — and convert it into a coherent operational narrative. They give engineering leaders the ability to trace patterns across thousands of signals: cycle time, review latency, rework, change failure rate, or even sentiment trends that reflect developer well-being. Unlike traditional BI dashboards that need manual upkeep, modern analytics tools automatically correlate these signals into live, decision-ready insights. The more advanced platforms are built with AI layers that detect anomalies, predict delivery risks, and provide context-aware recommendations for improvement.
This shift represents the evolution of engineering management from reactive reporting to proactive intelligence. Instead of “what happened,” leaders now expect to see “why it happened” and “what to do next.”
Engineering has become one of the largest cost centers in modern organizations, yet for years it has been one of the hardest to quantify. Product and finance teams have their forecasts; marketing has its funnel metrics; but engineering often runs on intuition and periodic retrospectives. The rise of hybrid work, AI-generated code, and distributed systems compounds the complexity — meaning that decisions on prioritization, investment, and resourcing are often delayed or based on incomplete data.
These analytics platforms close that loop. They make engineering performance transparent without turning it into surveillance. They allow teams to observe how process changes, AI adoption, or tooling shifts affect delivery speed and quality. They uncover silent inefficiencies — idle PRs, review bottlenecks, or code churn — that no one notices in daily operations. And most importantly, they connect engineering work to business outcomes, giving leadership the data they need to defend, plan, and forecast with confidence.
The industry uses several overlapping terms to describe this category, each highlighting a slightly different lens.
Software Engineering Intelligence (SEI) platforms emphasize the intelligence layer — AI-driven, automated correlation of signals that inform leadership decisions.
Developer Productivity Tools highlight how these platforms improve flow and reduce toil by identifying friction points in development.
Engineering Management Platforms refer to tools that sit at the intersection of strategy and execution — combining delivery metrics, performance insights, and operational alignment for managers and directors. In essence, all these terms point to the same goal: turning engineering activity into measurable, actionable intelligence.
The terminology varies because the problems they address are multi-dimensional — from code quality to team health to business alignment — but the direction is consistent: using data to lead better.
Below are the top 6 software development analytics tools available in the market:
Typo is an AI-native software engineering intelligence platform that helps leaders understand performance, quality, and developer experience in one place. Unlike most analytics tools that only report DORA metrics, Typo interprets them — showing why delivery slows, where bottlenecks form, and how AI-generated code impacts quality. It’s built for scaling engineering organizations adopting AI coding assistants, where visibility, governance, and workflow clarity matter. Typo stands apart through its deep integrations across Git, Jira, and CI/CD systems, real-time PR summaries, and its ability to quantify AI-driven productivity.
Jellyfish is an engineering management and business alignment platform that connects engineering work with company strategy and investment. Its strength lies in helping leadership quantify how engineering time translates to business outcomes. Unlike other tools focused on delivery speed, Jellyfish maps work categories, spend, and output directly to strategic initiatives, offering executives a clear view of ROI. It fits large or multi-product organizations where engineering accountability extends to boardroom discussions.
DX is a developer experience intelligence platform that quantifies how developers feel and perform across the organization. Born out of research from the DevEx community, DX blends operational data with scientifically designed experience surveys to give leaders a data-driven picture of team health. It’s best suited for engineering organizations aiming to measure and improve culture, satisfaction, and friction points across the SDLC. Its differentiation lies in validated measurement models and benchmarks tailored to roles and industries.
Swarmia focuses on turning engineering data into sustainable team habits. It combines productivity, DevEx, and process visibility into a single platform that helps teams see how they spend their time and whether they’re working effectively. Its emphasis is not just on metrics, but on behavior — helping organizations align habits to goals. Swarmia fits mid-size teams looking for a balance between accountability and autonomy.
LinearB remains a core delivery-analytics platform used by thousands of teams for continuous improvement. It visualizes flow metrics such as cycle time, review wait time, and PR size, and provides benchmark comparisons against global engineering data. Its hallmark is simplicity and rapid adoption — ideal for organizations that want standardized delivery metrics and actionable insights without heavy configuration.
Waydev positions itself as a financial and operational intelligence platform for engineering leaders. It connects delivery data with cost and budgeting insights, allowing leadership to evaluate ROI, resource utilization, and project profitability. Its advantage lies in bridging the engineering–finance gap, making it ideal for enterprise leaders who need to align engineering metrics with fiscal outcomes.
Code Climate Velocity delivers deep visibility into code quality, maintainability, and review efficiency. It focuses on risk and technical debt rather than pure delivery speed, helping teams maintain long-term health of their codebase. For engineering leaders managing large or regulated systems, Velocity acts as a continuous feedback engine for code integrity.
When investing in analytics tooling there is a strategic decision: build an internal solution or purchase a vendor platform.
Pros:
Cons:
Pros:
Cons:
For most scaling engineering organisations in 2026, buying is the pragmatic choice. The complexity of capturing cross-tool telemetry, integrating AI-assistant data, surfacing meaningful benchmarks and maintaining the analytics stack is non-trivial. A vendor platform gives you baseline insights quickly, improvements with lower internal resource burden, and credible benchmarks. Once live, you can layer custom build efforts later if you need something bespoke.
Picking the right analytics is important for the development team. Check out these essential factors below before you make a purchase:
Consider how the tool can accommodate the team’s growth and evolving needs. It should handle increasing data volumes and support additional users and projects.
Error detection feature must be present in the analytics tool as it helps to improve code maintainability, mean time to recovery, and bug rates.
Developer analytics tools must compile with industry standards and regulations regarding security vulnerabilities. It must provide strong control over open-source software and indicate the introduction of malicious code.
These analytics tools must have user-friendly dashboards and an intuitive interface. They should be easy to navigate, configure, and customize according to your team’s preferences.
Software development analytics tools must be seamlessly integrated with your tech tools stack such as CI/CD pipeline, version control system, issue tracking tools, etc.
What additional metrics should I track beyond DORA?
Track review wait time (p75/p95), PR size distribution, review queue depth, scope churn (changes to backlog vs committed), rework rate, AI-coding adoption (percentage of work assisted by AI), developer experience (surveys + system signals).
How many integrations does a meaningful analytics tool require?
At minimum: version control (GitHub/GitLab), issue tracker (Jira/Azure DevOps), CI/CD pipeline, PR/review metadata, incident/monitoring feeds. If you use AI coding assistants, add integration for those logs. The richer the data feed, the more credible the insight.
Are vendor benchmarks meaningful?
Yes—if they are role-adjusted, industry-specific and reflect team size. Use them to set realistic targets and avoid vanity metrics. Vendors like LinearB and Typo publish credible benchmark sets.
When should we switch from internal dashboards to a vendor analytics tool?
Consider switching if you lack visibility into review bottlenecks or DevEx; if you adopt AI coding and currently don’t capture its impact; if you need benchmarking or business-alignment features; or if you’re moving from team-level metrics to org-wide roll-ups and forecasting.
How do we quantify AI-coding impact?
Start with a baseline: measure merge wait time, review time, defect/bug rate, technical debt induction before AI assistants. Post-adoption track percentage of code assisted by AI, compare review wait/defect rates for assisted vs non-assisted code, gather developer feedback on experience and time saved. Good platforms expose these insights directly.
Software development analytics tools in 2026 must cover delivery velocity, code-quality, developer experience, AI-coding workflows and business alignment. Choose a vendor whose focus matches your priority—whether flow, DevEx, quality or investment alignment. Buying a mature platform gives you faster insight and less build burden; you can customise further once you're live. With the right choice, your engineering team moves beyond “we ship” to “we improve predictably, visibly and sustainably.”

Software development culture demands speed and quality. To enhance them and drive business growth, it’s essential to cultivate an environment conducive to innovation and streamline the development process.
One such key factor is development velocity which helps in unlocking optimal performance.
Let’s understand more about this term and why it is important:
Development velocity refers to the amount of work the developers can complete in a specific timeframe. It is the measurement of the rate at which they can deliver business value. In scrum or agile, it is the average number of story points delivered per sprint.
Development velocity is mainly used as a planning tool that helps developers understand how effective they are in deploying high-quality software to end-users.
Development velocity is a strong indicator of whether a business is headed in the right direction. There are various reasons why development velocity is important:
High development velocity leads to an increase in productivity and reduced development time. It further leads to a faster delivery process and reduced time to market which helps in saving cost. Hence, allowing them to maximize the value generated from resources and allocate it to other aspects of business.
High development velocity results in quick delivery of features and updates. Hence, gives the company a competitive edge in the market, responding rapidly to market demands and capturing market opportunities.
Development velocity provides valuable insights into team performance and identifies areas for improvement within the development process. It allows them to analyze velocity trends and implement strategies to optimize their workflow.
Development velocity helps in setting realistic expectations by offering a reliable measure of the team’s capacity to deliver work within the timeframe. It further keeps the expectations grounded in reality and fostering trust and transparency within the development team.
A few common hurdles that may impact the developer’s velocity are:
Measuring development velocity includes quantifying the rate at which developers are delivering value to the project.
Although, various metrics measure development velocity, we have curated a few important metrics. Take a look below:
Cycle Time calculates the time it takes for a task or user story to move from the beginning of the coding task to when it’s been delivered, deployed to production, and made available to users. It provides a granular view of the development process and helps the team identify blindspots and ways to improve them.
Story points measure the number of story points completed over a period of time, typically within a sprint. Tracking the total story points in each iteration or sprint estimates future performance and resource allocation.
User stories measure the velocity in terms of completed user stories. It gives a clear indication of progress and helps in planning future iterations. Moreover, measuring user stories helps in planning and prioritizing their work efforts while maintaining a sustainable pace of delivery.
The Burndown chart tracks the remaining work in a sprint or iteration. Comparing planned work against the actual work progress helps in assessing their velocity and comparing progress to sprint goals. This further helps them in making informed decisions to identify velocity trends and optimize their development process.

Engineering hours track the actual time spent by engineers on specific tasks or user stories. It is a direct measure of effort and helps in estimating future tasks based on historical data. It provides feedback for continuous improvement efforts and enables them to make data-driven decisions and improve performance.
Lead time calculates the time between committing the code and sending it to production. However, it is not a direct metric and it needs to complement other metrics such as cycle time and throughput. It helps in understanding how quickly the development team is able to respond to new work and deliver value.
Developers are important assets of software development companies. When they are unhappy, this leads to reduced productivity and morale. This further lowers code quality and creates hurdles in collaboration and teamwork. As a result, this negatively affects the development velocity.
Hence, the first and most crucial way is to create a positive work environment for developers. Below are a few ways how you can build a positive developer experience for them:
Encouraging a culture of experimentation and continuous learning leads to innovation and the adoption of more efficient practices. Let your developers, experiment, make mistakes and try again. Ensure that you acknowledge their efforts and celebrate their successes.
Unrealistic deadlines can cause burnout, poor code quality work, and negligence in PR review. Always involve your development team while setting deadlines. When set right, it can help them plan and prioritize their tasks. Ensure that you give buffer time to them to manage roadblocks and unexpected bugs as well as other priorities.
Regular communication among team leaders and developers lets them share important information on a priority basis. It allows them to effectively get their work done since they are communicating their progress and blockers while simultaneously moving on with their tasks.
Knowledge sharing and collaboration are important. This can be through pair programming and collaborating with other developers as it allows them to work on more complex problems and code together in parallel. It also results in effective communication as well as accountability for each other’s work.
An increase in technical debt negatively impacts the development velocity. When teams take shortcuts, they have to spend extra time and effort on fixing bugs and other issues. It also leads to improper planning and documentation which further slows down the development process.
Below are a few ways how developers can minimize technical debt:
The automated testing process minimizes the risk of errors in the future and identifies defects in code quickly. Further, it increases the efficiency of engineers. Hence, giving them more time to solve problems that need human interference.
Code reviews in routine allow the team to handle technical debt in the long run. As it helps in constant error checking and catching potential issues which enhance code quality.
Refactoring involves making changes to the codebase without altering its external behavior. It is an ongoing process that is performed regularly throughout the software development life cycle.
Always listen to your engineers. They are the ones who are well aware of ongoing development and working closely with a database and developing the applications. Listen to what they have to say and take their suggestions and opinions.
Agile methodologies such as Scrum and Kanban offer a framework to manage software development projects flexibly and seamlessly. This is because the framework breaks down projects into smaller, manageable increments. Hence, allowing them to focus on delivering small pieces of functions more quickly. It also enables developers to receive feedback quickly and have constant communication with the team members.
The agile methodology also prioritizes work based on business value, customer needs and dependencies to streamline developers’ efforts and maintain consistent progress.
One of the best ways the software development process works efficiently is when everyone’s goals are aligned. If not, it could lead to being out of sync and stuck in a bottleneck situation. Aligning objectives with other teams fosters collaboration reduces duplication of efforts, and ensures that everyone is working towards the same goal.
Moreover, it minimizes the conflicts and dependencies between teams enabling faster decision making and problem-solving. Hence, development teams should regularly communicate, coordinate, and align with priorities to ensure a shared understanding of objectives and vision.
Right engineering tools and technologies can help in increasing productivity and development velocity. Organizations that have tools for continuous integration and deployment, communication, collaboration, planning, and development are likely more innovative than the companies that don’t use them.
There are many tools available in the market. Below are key factors that the engineering team should keep in mind while choosing any engineering tool:
As mentioned above, empowering your development team to use the right tools is crucial. Typo is one such intelligent engineering platform that is used for gaining visibility, removing blockers, and maximizing developer effectiveness.

Engineering leaders, DevOps teams, and developer experience teams need reliable tools to track DORA metrics across the software delivery lifecycle. The right tool pulls engineering data from multiple sources, attributes metrics to actual teams, and surfaces root causes behind delivery changes. This guide covers the best DORA metrics tools available in 2026, updated to reflect the framework's evolution from four metrics to five, the removal of performance tiers, and the growing challenge of measuring AI's impact on delivery.
DORA metrics are standardized performance indicators developed by Google’s DevOps Research and Assessment (DORA) team. They help teams measure software delivery performance and devops performance, giving engineering leaders a data-backed view of how effectively teams ship software.
The DORA framework helps Agile teams identify bottlenecks, reduce waste, and drive continuous improvement in the software delivery process.
As of 2025, the DORA framework includes five metrics, grouped into two categories; teams new to the framework may benefit from a comprehensive overview of DORA metrics and their practical applications:
Throughput (3 metrics):
Instability (2 metrics):
The stability category was renamed to “instability” because a high change failure rate or rework rate are signs of instability. Their absence does not necessarily confirm stability, and teams should follow best practices and common pitfalls when using DORA metrics to avoid misinterpreting these signals.
The key dora metrics and four key dora metrics from the earlier model should still be reviewed together when teams implement them, because strong speed signals alone can mask reliability issues across the system.
With an understanding of the key DORA metrics, let's explore the top tools available for tracking and optimizing these metrics in 2026. The following sections will guide you through the latest changes in the DORA framework and provide a comprehensive comparison of the best DORA metrics tools to help you choose the right solution for your team.
The 2025 DORA report, titled “State of AI-Assisted Software Development,” introduced several significant changes that any DORA metrics tool needs to reflect:
Performance tiers are gone. The familiar elite/high/medium/low classification has been removed. In its place, DORA introduced seven team archetypes based on patterns across throughput, instability, and team health. These range from teams facing foundational challenges or “Legacy Bottleneck” (about 11% of respondents) to “Harmonious High Achievers” (roughly 20%), and the older model was often called the Four Keys before DORA evolved to five metrics grouped into two operational categories and seven archetypes.
AI is nearly universal but not uniformly helpful. Based on surveys of nearly 5,000 technology professionals, the 2025 report found approximately 90% of developers now use AI coding tools. But the central finding is what DORA calls the “mirror and multiplier” effect: AI boosts individual developer productivity but creates instability at the team and organizational level. Teams increasing AI adoption reported improvements in code quality and documentation, but also experienced a measurable reduction in delivery stability.
Rework rate benchmarks are now published. Many teams fall in the 8% to 32% rework range, meaning a significant portion of delivery effort is spent on corrections rather than new features. In 2025, the framework formally added deployment rework rate as the fifth metric.
The AI Capabilities Model was introduced. Seven foundational practices that determine whether AI works for a team or against it, spanning technical, cultural, and process dimensions.
Any content or tool referencing the old four-metric, four-tier model is outdated, and newer frameworks such as DX Core 4 also add developer experience and business value context beyond classic DORA measurement; modern guides on DORA metrics for engineering leaders in 2026 now reflect the five-metric model and its role in broader performance frameworks.
Selecting the right tool depends on your team’s measurement maturity, from basic devops tools that cover speed metrics to broader platforms that measure engineering performance, team performance, and business value, especially in large enterprises that are implementing DORA DevOps metrics across complex organizations.
What to evaluate:
Teams earlier in DevOps maturity often get the most value from measuring dora metrics because the baseline helps surface bottlenecks that are otherwise invisible in the software delivery process, and understanding the importance of DORA metrics for boosting tech team performance helps these organizations build the right habits from the start.
Tool categories:
To implement dora metrics, a common approach is to build a DevOps pipeline that extracts data from changes, incidents, and deployments, then parses it into tables for calculation and continuous improvement of delivery practices, or adopt a dedicated platform to track and improve DORA metrics with SDLC-wide insights. Set expectations with development and operations teams early, invite participation in goals and data collection, and start with speed metrics before expanding to stability metrics across development and operations teams, including operations teams.
Best for: Mid-market engineering teams (20 to 500 engineers) that need DORA metrics, AI coding impact measurement, automated code review, and developer experience insights in a single platform.
Typo is an AI-powered engineering intelligence platform built to give engineering leaders real-time visibility across the full SDLC. It helps measure engineering performance beyond DORA, including developer experience and business value, positioning it as a comprehensive AI engineering intelligence and DORA metrics platform. It connects to Git, issue tracking, CI/CD, and communication tools to track all five DORA metrics alongside deeper delivery signals like PR cycle time, sprint health, deployment bottlenecks, and workload distribution.
What separates Typo from other DORA tools in 2026 is the breadth of its platform, especially for teams focused on mastering the art of DORA metrics rather than just viewing dashboards. Where most tools track delivery metrics alone, Typo combines four capabilities in one product to help multidisciplinary teams and development teams align around the full software delivery process:
Integrations: GitHub, GitLab, Bitbucket, Jira, Linear, ClickUp, Slack, GitHub Actions, Jenkins, CircleCI, GitHub Copilot, Cursor, Claude Code, Amazon CodeWhisperer.
Setup: Self-serve, connects in 60 seconds. No complex onboarding.
Security: SOC2 Type II certified, GDPR compliant.
Pricing: Free trial available. Transparent pricing. Cost-effective at scale relative to enterprise alternatives like Jellyfish and DX.
Why it matters for DORA in 2026: The 2025 DORA report made clear that tracking delivery metrics alone is insufficient. AI is changing how code gets written, but not how leaders see what is actually driving delivery. Throughput can look healthy while review time, rework, and predictability tell a different story. DORA metrics align with broader engineering performance frameworks when teams want to connect delivery signals to business value. Typo bridges that visibility gap by measuring DORA signals, AI coding impact, code quality, and developer experience in one view, helping teams put into practice the core DORA metrics concepts explained with Typo’s insights.
Best for: Mid-size teams (30 to 200 engineers) that want workflow automation alongside DORA metrics and strong Jira integration.
LinearB focuses on engineering workflow optimization, offering DORA metrics alongside its gitStream workflow automation engine and credit-based AI code review, aimed at improving workflow efficiency and standardizing delivery practices.
Pricing model: Per-contributor pricing with bundled monthly credits. Credits are consumed when LinearB automates a PR: one automated PR consumes 100 credits regardless of the number of automations applied. Three tiers: LinearB
The number of contributor seats determines the bundled credit allocation. Credits are a shared pool for the entire organization. Customers may exceed their monthly allocation at no additional charge in any two months of a year, with a 120% cap to prevent runaway use. Annual billing only.
Best for: Enterprise organizations (100+ engineers) that need executive-level reporting, engineering investment allocation, AI impact tracking, and C-suite visibility; built especially for enterprise teams.
Jellyfish is a software engineering intelligence platform that targets VPs of Engineering and CTOs who need to communicate engineering ROI and the business value of software delivery performance to boards and leadership. Jellyfish pricing is based on number of seats and specific modules selected. The platform is organized around four core modules: Engineering Management, AI Impact, Team Effectiveness, and DevFinOps.
Pricing model: No public pricing. Modular, based on seats and modules selected. Estimated $30K to $100K+ ARR for mid-size teams. Buyers with 50 to 200 engineering seats commonly see annual contract values ranging from the mid-five figures to low-six figures. Multi-year commitments and prepayment frequently yield 15 to 25% discounts. No free trial publicly available.
Best for: Organizations focused on developer experience measurement alongside engineering effectiveness, particularly those investing in the DX Core 4 and SPACE frameworks.
DX approaches engineering measurement from the developer experience side. Its platform combines qualitative surveys with workflow analysis to capture friction, flow, and developer sentiment, measuring engineering performance more broadly by adding developer experience and business impact to classic DORA metrics. DX introduced the DX Core 4 framework (Speed, Effectiveness, Quality, Impact) as a complement to DORA metrics, extending DORA measurement rather than replacing it.
Pricing model: Enterprise pricing based on developer licenses with usage tiers for MCP server access. No public per-seat rates. Median buyer pays approximately $53,760/year based on Vendr data from 112 purchases. Annual spends range from $20,000 to $100,000. Contracts start at a 1-year term. Free proof-of-concept available for a subset of your organization.
Best for: Engineering managers at teams of 20 to 100 developers who want clean DORA/SPACE metrics with developer experience surveys and a team-first, non-surveillance approach.
Swarmia helps improve team performance, workflow efficiency, and software delivery throughput at the team level for engineering managers who want clean DORA/SPACE metrics with developer experience surveys and a team-first, non-surveillance approach.
Swarmia offers a modular platform covering developer productivity (DORA metrics, cycle time), business outcomes (investment balance, portfolio tracking, software capitalization) that connect delivery data to business value, and developer experience (recurring surveys correlated with metrics). The platform emphasizes team-level insights and working agreements rather than individual tracking.
Pricing model: Per-developer pricing, with costs typically ranging from $4,500 to $27,000 annually depending on team size and modules purchased. Three options:
Organizations purchasing the full suite typically see 20 to 30% savings compared to buying all three modules separately. Larger teams unlock volume discounts. A 25-developer team might pay around $250/seat annually, while a 200-developer organization could negotiate rates as low as $180/seat. 14-day free trial available.
Best for: Enterprise engineering organizations with complex, multi-tool delivery chains (50+ systems) that need unified operational visibility across Git, CI/CD, incident management, HR, and financial systems, especially enterprise teams with many tools and complex software delivery process needs.
Faros AI connects to 50+ tools across the software delivery lifecycle and supports DORA measurement across development and operations teams. The platform is one of the first to track all five DORA metrics including deployment rework rate with published benchmarks, similar to how datadog dora metrics bring delivery data into dashboards.
Best for: Teams that want full control over their engineering analytics infrastructure and are willing to invest in self-hosting.
Apache DevLake is the leading open-source engineering analytics platform. It ingests data from GitHub, GitLab, Jira, Jenkins, and dozens of other tools into a unified data lake, then provides pre-built dashboards for DORA metrics, making it useful for teams that want to implement DORA metrics with their own DevOps tools and data pipeline.
Best for: Teams fully committed to the GitLab ecosystem that want native DORA tracking without additional tooling.
GitLab supports DORA metrics natively via its Value Streams Dashboard. For teams early in measuring DORA metrics, it provides native visibility into key metrics without extra tooling. For teams running their entire delivery lifecycle in GitLab, it provides a low-friction starting point.
Best for: Small teams new to engineering metrics that want lightweight DORA tracking with minimal setup, especially teams earlier in their measurement maturity.
Haystack provides streamlined engineering metrics with a focus on simplicity and ease of adoption, helping teams accurately measure basic DORA metrics and establish a baseline for continuous improvement.
If you need an all-in-one platform that covers DORA metrics, AI coding impact measurement, automated code review, and developer experience in a single product with fast setup and transparent pricing: Typoapp.io is the strongest fit for mid-market teams. The best choice depends on your measurement maturity, from basic tools for tracking deployment frequency and lead time to broader platforms that measure engineering performance, developer experience, and business value.
If you prioritize workflow automation and want programmable PR routing with a credit-based model and strong Jira integration: LinearB is a solid choice for teams of 30 to 200 engineers.
If you need executive and board-level reporting with engineering investment allocation, AI impact benchmarks across 20M+ PRs, and DevFinOps for 100+ engineer organizations: Jellyfish is purpose-built for that, though budget requirements are significant.
If developer experience measurement is your primary concern and you want research-backed survey methodology with the DX Core 4 framework: DX leads in that area with the strongest qualitative measurement approach.
If you want clean, team-friendly metrics with a non-surveillance approach, transparent pricing, and developer buy-in: Swarmia is well-regarded for teams under 100 engineers.
If you have a complex enterprise toolchain with 50+ systems and need all five DORA metrics with rework rate benchmarks: Faros AI has the broadest integration coverage, especially for enterprise teams operating across many tools.
If you want full control and open-source flexibility: Apache DevLake is the only free option with broad data source support, though it requires engineering investment to maintain.
The defining question in 2026 is no longer “do we track DORA metrics?” It is “can our tool tell us whether the improvements we see are real, sustainable, and connected to the changes we made?” With AI reshaping how code gets written, passive dashboards showing four numbers are no longer enough. The best DORA metrics tools in 2026 connect delivery signals to AI impact, code quality, and developer experience, giving engineering leaders the full picture of what is actually driving delivery performance and allowing them to spot early signs of declining DORA metrics and underlying issues. They also help leaders benchmark software delivery performance and operational efficiency while supporting continuous improvement across development and operations teams.
Ready to track all five DORA metrics alongside AI impact, automated code review, and developer experience?
Start your free trial with Typo** — connects in 60 seconds.**

In the constantly changing world of software development, it is crucial to have reliable metrics to measure performance. This guide provides a detailed overview of DORA (DevOps Research and Assessment) metrics, explaining their importance in assessing the effectiveness, efficiency, and dependability of software development processes. DORA metrics were developed by Google Cloud and are supported by ongoing DORA research, which continues to analyze performance levels, metrics, and the impact of AI on software delivery.
DORA metrics comprise a comprehensive framework of four foundational performance indicators that revolutionize how organizations measure and optimize their software delivery capabilities, providing engineering teams with actionable intelligence into the velocity, reliability, and operational excellence of their development workflows. Developed by Google Cloud's DevOps Research and Assessment (DORA) team through extensive research and analysis of high-performing engineering organizations, these metrics have emerged as the industry gold standard for evaluating software delivery effectiveness and operational maturity. The four core DORA metrics—deployment frequency, lead time for changes, change failure rate, and time to restore service—deliver a holistic perspective on how efficiently and reliably organizations can ship software solutions to production environments while maintaining system stability and user satisfaction.
By implementing systematic tracking and analysis of these key DevOps metrics, engineering teams can dive deep into their software delivery pipelines to identify bottlenecks, optimize resource allocation, and drive continuous improvement across their development workflows. Monitoring deployment frequency and lead time for changes enables teams to analyze and enhance their capability to deliver new features, bug fixes, and system updates with unprecedented speed and efficiency, while change failure rate and time to restore service provide comprehensive insights into system resilience, incident response capabilities, and overall operational stability. Leveraging these metrics not only facilitates data-driven decision-making and streamlines development processes but also significantly enhances customer satisfaction, reduces operational costs, and positions organizations to maintain competitive advantages in the rapidly evolving landscape of modern software development and deployment.
DORA metrics serve as a compass for evaluating software development performance, with the four metrics—Deployment Frequency, Lead Time, Change Failure Rate, and Mean Time to Recovery (MTTR)—acting as the core indicators used to benchmark software delivery teams. This guide covers deployment frequency, change lead time, change failure rate, and mean time to recovery (MTTR).
Organizations measure DORA metrics continuously to track progress, benchmark performance, and identify opportunities for improvement in their DevOps and engineering processes.
Let’s explore the key DORA metrics that are crucial for assessing the efficiency and reliability of software development practices. These metrics provide valuable insights into a team’s agility, adaptability, and resilience to change.
In addition to the four key metrics, other DORA metrics are often used to provide a more comprehensive view of DevOps performance.
Deployment Frequency measures how often code is deployed to production. Frequent deployments and a higher deployment frequency are key indicators of agile teams. The frequency of code deployment reflects how agile, adaptable, and efficient the team is in delivering software solutions. This metric, explained in our guide, provides valuable insights into the team’s ability to respond to changes, enabling strategic adjustments in development practices.
The deployment process involves moving code into the production deployment environment. The ability to rapidly and reliably deploy code is essential for high-performing teams, as it ensures that new features and fixes reach users quickly and with minimal risk.
It is essential to measure the time taken from code creation to deployment, which is known as change lead time. This metric helps to evaluate the efficiency of the development pipeline, emphasizing the importance of quick transitions from code creation to deployment. Our guide provides a detailed analysis of how optimizing change lead time can significantly improve overall development practices. Effective code reviews and streamlined code review processes play a key role in reducing lead time and improving code quality. Additionally, managing code complexity is crucial for minimizing lead time and ensuring efficient development.
Change failure rate measures a team’s ability to deliver reliable code. By analyzing the rate of unsuccessful changes, teams can identify areas for improvement in their development and deployment processes. Production failures are a key concern, and tracking the percentage of deployments that result in failures helps teams benchmark their reliability and stability. Using feature flags can help reduce the risk of production failures by allowing gradual rollouts and enabling quick rollbacks. This guide provides detailed insights on interpreting and leveraging change failure rate to enhance code quality and reliability.
Mean Time to Recovery (MTTR) is a metric that measures the amount of time it takes a team to recover from failures. This metric is important because it helps gauge a team’s resilience and recovery capabilities, which are crucial for maintaining a stable and reliable software environment. The ability to quickly restore services in the production environment is a key aspect of incident management and system resilience, ensuring minimal downtime and rapid response to disruptions. Our guide will explore how understanding and optimizing MTTR can contribute to a more efficient and resilient development process.
Below are the performance metrics categorized in
for 4 metrics –

Implementing DORA metrics effectively begins with establishing a comprehensive foundation rooted in advanced DevOps research methodologies and sophisticated assessment principles. DevOps teams can harness these powerful analytical metrics to systematically identify performance bottlenecks within their software delivery pipelines, enabling them to dramatically enhance deployment frequency, significantly reduce lead time for changes, and optimize various critical components throughout their development workflows. The implementation process commences by establishing robust data collection mechanisms across each of the four fundamental DORA metrics, which empowers teams to accurately measure their operational performance, conduct meaningful benchmarking against industry leaders, and establish baseline measurements for continuous improvement initiatives.
Google Cloud's specialized DORA research division delivers an extensive suite of cutting-edge research frameworks and comprehensive assessment tools that support development teams in successfully implementing DORA metrics while driving substantial improvements in overall software delivery performance. Advanced automated testing platforms and sophisticated integrated monitoring solutions play an instrumental role in capturing precise, real-time data, ensuring that teams maintain unprecedented visibility into their deployment frequency patterns, lead time optimization opportunities, and other mission-critical performance indicators. Through consistent analysis of this comprehensive data ecosystem, DevOps teams can systematically identify strategic improvement areas, make data-driven decisions with confidence, and implement targeted optimization changes that transform their software delivery processes. This sophisticated, analytics-driven approach empowers development teams to continuously refine their operational practices, achieve remarkable improvements in deployment frequency and lead time metrics, and deliver superior-quality software solutions with enhanced efficiency and reliability.
Utilizing DORA (DevOps Research and Assessment) metrics goes beyond just understanding individual metrics. It involves delving into the practical application of DORA metrics that are specifically tailored for DevOps teams. DORA metrics help bridge the gap between development and operations teams, fostering collaboration among multidisciplinary teams and operations teams to enhance software delivery performance.
By actively tracking and reporting on these metrics over time, teams can gain actionable insights, identify trends, and patterns, and pinpoint areas for continuous improvement. Engineering teams use DORA metrics to identify bottlenecks and improve processes throughout the software delivery lifecycle, ensuring more efficient and resilient outcomes. Furthermore, by aligning DORA metrics with business value, organizations can ensure that their DevOps efforts contribute directly to strategic objectives and overall success.
The guide recommends that engineering teams begin by assessing their current DORA metric values to establish a baseline. This baseline is a reference point for measuring progress and identifying deviations over time. By understanding their deployment frequency, change lead time, change failure rate, and MTTR, teams can set realistic improvement goals specific to their needs.
Consistently monitoring DORA (DevOps Research and Assessment) metrics helps software teams detect patterns and trends in their development and deployment processes. This guide provides valuable insights into how analyzing deployment frequency trends can reveal the team's ability to adapt to changing requirements while assessing change lead time trends can offer a glimpse into the workflow's efficiency. By identifying patterns in change failure rates, teams can pinpoint areas that need improvement, enhancing the overall software quality and reliability.
Using DORA metrics is a way for DevOps teams to commit to continuously improving their processes and track progress. The guide promotes an iterative approach, encouraging teams to use metrics to develop targeted strategies for improvement. By optimizing deployment pipelines, streamlining workflows, or improving recovery mechanisms, DORA metrics can help drive positive changes in the development lifecycle.
The DORA metrics have practical implications in promoting cross-functional cooperation among DevOps teams. By jointly monitoring and analyzing metrics, teams can eliminate silos and strive towards common goals. This collaborative approach improves communication, speeds up decision-making, and ensures that everyone is working towards achieving shared objectives.
DORA metrics form the basis for establishing a culture of feedback-driven development within DevOps teams. By consistently monitoring metrics and analyzing performance data, teams can receive timely feedback, allowing them to quickly adjust to changing circumstances. Incorporating customer feedback into the development process helps teams align their improvements with end-user needs and expectations. This ongoing feedback loop fosters a dynamic development environment where real-time insights guide continuous improvements. Additionally, aligning DORA metrics with operational performance metrics enhances the overall understanding of system behavior, promoting more effective decision-making and streamlined operational processes.
To maximize the effectiveness of DevOps Research and Assessment (DORA) metrics within software delivery pipelines, development teams must implement comprehensive methodologies that ensure precise measurement capabilities, meaningful data analytics, and continuous process optimization. Organizations should establish well-defined performance objectives and key performance indicators (KPIs) for their software delivery infrastructure, ensuring alignment between DORA metric implementation and enterprise-level strategic initiatives. Accurate data acquisition and reliable measurement frameworks remain fundamental—leveraging automated monitoring tools, robust data collection processes, and advanced analytics platforms ensures that performance metrics accurately represent the operational state of software delivery workflows and deployment pipelines.
Development teams should conduct systematic analysis of DORA metrics in conjunction with complementary performance indicators, including user experience metrics, customer satisfaction scores, and business value outcomes, to establish comprehensive visibility into delivery pipeline performance. This integrated analytical approach enables engineering teams to identify optimization opportunities and prioritize infrastructure improvements that deliver maximum impact on deployment frequency, lead time reduction, and change failure rate mitigation. Organizations must cultivate continuous improvement methodologies by utilizing DORA metrics to drive iterative enhancements across deployment automation, change management processes, and delivery pipeline optimization. Elite-performing development organizations consistently demonstrate superior deployment frequency rates, reduced lead times for feature delivery, and minimized change failure rates, ultimately achieving enhanced customer satisfaction metrics and strengthened business performance indicators. Through implementation of these advanced methodologies, engineering teams can accelerate software delivery velocity, enhance system reliability, and increase deployment confidence across their development lifecycle.
DORA metrics isn’t just a mere theory to support DevOps but it has practical applications to elevate how your team works. Effective data collection and the ability to collect data from various sources are essential for leveraging DORA metrics in practice. Here are some of them:
Efficiency and speed are crucial in software development. The guide explores methods to measure deployment frequency, which reveals how frequently code is deployed to production. This measurement demonstrates the team's agility and ability to adapt quickly to changing requirements. This emphasizes a culture of continuous delivery.
Quality assurance plays a crucial role in software development, and the guide explains how DORA metrics help in evaluating and ensuring code quality. By analyzing the change failure rate, teams can determine the dependability of their code modifications. This helps them recognize areas that need improvement, promoting a culture of delivering top-notch software.
Reliability is crucial for the success of software applications. This guide provides insights into Mean Time to Recovery (MTTR), a key metric for measuring a team's resilience and recovery capabilities. Understanding and optimizing MTTR contributes to a more reliable development process by ensuring prompt responses to failures and minimizing downtime.
Benchmarks play a crucial role in measuring the performance of a team. By comparing their performance against both the industry standards and their own team-specific goals, software development teams can identify areas that need improvement. This iterative process allows for continuous execution enhancement, which aligns with the principles of continuous improvement in DevOps practices.
Value Stream Management is a crucial application of DORA metrics. It provides development teams with insights into their software delivery processes and helps them optimize for efficiency and business value. It enables quick decision-making, rapid response to issues, and the ability to adapt to changing requirements or market conditions.
Implementing DORA metrics brings about a transformative shift in the software development process, but it is not without its challenges. Let's explore the potential hurdles faced by teams adopting DORA metrics and provide insightful solutions to navigate these challenges effectively.
One of the main challenges faced is the reluctance of the development team to change. The guide explores ways to overcome this resistance, emphasizing the importance of clear communication and highlighting the long-term advantages that DORA metrics bring to the development process. By encouraging a culture of flexibility, teams can effectively shift to a DORA-centric approach.
To effectively implement DORA metrics, it is important to have a clear view of data across the development pipeline. The guide provides solutions for overcoming challenges related to data visibility, such as the use of integrated tools and platforms that offer real-time insights into deployment frequency, change lead time, change failure rate, and MTTR. This ensures that teams are equipped with the necessary information to make informed decisions.
Organizational silos can hinder the smooth integration of DORA metrics into the software development workflow. In this guide, we explore different strategies that can be used to break down these silos and promote cross-functional collaboration. By aligning the goals of different teams and working together towards a unified approach, organizations can fully leverage the benefits of DORA metrics in improving software development performance.
Ensuring the success of DORA implementation relies heavily on selecting and defining relevant metrics. The guide emphasizes the importance of aligning the chosen metrics with organizational goals and objectives to overcome the challenge of ensuring metric relevance. By tailoring metrics to specific needs, teams can extract meaningful insights for continuous improvement.
Implementing DORA metrics across multiple teams and projects can be a challenge for larger organizations. To address this challenge, the guide offers strategies for scaling the implementation. These strategies include the adoption of standardized processes, automated tools, and consistent communication channels. By doing so, organizations can achieve a harmonized approach to DORA metrics implementation.
Anticipating future trends in DORA metrics is essential for staying ahead in the dynamic landscape of software development. Here are some of them:
As the software development landscape continues to evolve, there is a growing trend towards integrating DORA metrics with artificial intelligence (AI) and machine learning (ML) technologies. These technologies can enhance predictive analytics, enabling teams to proactively identify potential bottlenecks, optimize workflows, and predict failure rates. This integration empowers organizations to make data-driven decisions, ultimately improving the overall efficiency and reliability of the development process.
DORA metrics are expected to expand their coverage beyond the traditional four key metrics. This expansion may include metrics related to security, collaboration, and user experience, allowing teams to holistically assess the impact of their development practices on various aspects of software delivery.
Future trends in DORA metrics emphasize the importance of continuous feedback loops and iterative improvement. Organizations are increasingly adopting a feedback-driven culture, leveraging DORA metrics to provide timely insights into the development process. This iterative approach enables teams to identify areas for improvement, implement changes, and measure the impact, fostering a cycle of continuous enhancement.
Advancements in data visualization and reporting tools are shaping the future of DORA metrics. Organizations are investing in enhanced visualization techniques to make complex metric data more accessible and actionable. Improved reporting capabilities enable teams to communicate performance insights effectively, facilitating informed decision-making at all levels of the organization.
DORA metrics in software development serve as both evaluative tools and innovators, playing a crucial role in enhancing Developer Productivity and guiding engineering leaders. DevOps practices rely on deployment frequency, change lead time, change failure rate, and MTTR insights gained from DORA metrics. They create a culture of improvement, collaboration, and feedback-driven development. Future integration with AI, expanded metric coverage, and enhanced visualization herald a shift in navigating the complex landscape. Metrics have transformative power in guiding DevOps teams towards resilience, efficiency, and success in a constantly evolving technological landscape.

The Mean Time to Recover (MTTR) is a crucial measurement within DORA (DevOps Research and Assessment) metrics. It provides insights into how fast an organization can recover from disruptions. MTTR is considered a high level metric and is one of the key metrics used to assess system reliability and operational efficiency. In this blog post, we will discuss the importance of MTTR in DevOps and its role in improving system reliability while reducing downtime.
MTTR, which stands for Mean Time to Recover, is a valuable mttr metric that calculates the average duration taken by a system or application to recover from a failure or incident. Calculating MTTR involves dividing the actual downtime by the number of separate incidents within a given period. It is an essential component of the DORA metrics and concentrates on determining the efficiency and effectiveness of an organization’s incident response and resolution procedures. Measuring MTTR helps teams track reliability, identify bottlenecks, and pinpoint areas for improvement.
It is a useful metric to measure for various reasons:
Efficient incident resolution is crucial for maintaining seamless operations and meeting user expectations. MTTR is especially important during a system outage or unplanned incidents, as it measures the recovery period needed to restore services. MTTR plays a pivotal role in the following aspects:
MTTR is directly related to an organization’s ability to respond quickly to incidents. A lower MTTR reflects not only the team's responsiveness in acknowledging and addressing alerts, but also the efficiency of the time spent detecting issues before resolution begins. A lower MTTR indicates a DevOps team that is more agile and responsive and can promptly address issues.
Organizations’ key goal is to minimize downtime. Both service requests and unexpected outages contribute to overall downtime, making MTTR a vital metric for managing these events. MTTR quantifies the time it takes to restore normalcy, reducing the impact on users and businesses. software delivery software development software development
A fast recovery time leads to a better user experience. A shorter resolution time leads to higher user satisfaction and improved service perception. Users appreciate services that have minimal disruptions, and a low MTTR shows a commitment to user satisfaction.
It is a key metric that encourages DevOps teams to build more robust systems. Besides this, it is completely different from the other three DORA metrics.
MTTR, or Mean Time to Recovery, stands out by focusing on the severity of the impact within a failure management system. Unlike other DORA metrics, which may measure aspects like deployment frequency or lead time for changes, MTTR specifically addresses how quickly a system can recover from a failure. MTTR focus solely on the repair process and repair processes that follow a product or system failure, measuring only the speed and effectiveness of recovery efforts. This emphasis on recovery time highlights its unique role in maintaining system reliability and minimizing downtime.
By understanding and optimizing MTTR, teams can effectively enhance their response strategies, ensuring a more resilient and dependable infrastructure.
To calculate this, add up the total downtime and divide it by the total number of incidents that occurred within a particular period. For example, the time spent on unplanned maintenance is 60 hours. The total number of incidents that occurred is 10 times. If there are two separate incidents, the calculation would divide the total downtime by two. Hence, the mean time to recover would be 6 hours.
The response time should be as short as possible. 24 hours is considered to be a good rule of thumb.
High MTTR means the product will be unavailable to end users for a longer time period. This further results in lost revenue, productivity, and customer dissatisfaction. DevOps needs to ensure continuous monitoring and prioritize recovery when a failure occurs. Analyzing the development process can help identify bottlenecks that affect recovery times and improve overall system stability.
With Typo, you can improve dev efficiency with an inbuilt DORA metrics dashboard.
Mean Time to Respond (MTTR) stands as a game-changing metric within the incident management landscape, diving deep into the average timeframe your incident response team takes to spring into action when system failures or incidents trigger alerts. How does this differ from Mean Time to Recovery? While Mean Time to Recovery measures the duration needed to restore normal operations, Mean Time to Respond zeroes in on that critical initial reaction time—precisely how swiftly your team acknowledges and mobilizes to tackle fix requests.
This metric serves as an unprecedented performance indicator for evaluating how efficiently your incident response process operates. By tracking mean time to respond, organizations can uncover bottlenecks lurking within their alert systems, escalation workflows, or communication channels that might delay repair initiation. What does a shorter response time really mean? It signifies that the right person gets notified promptly, repairs commence without unnecessary delays, and the risk of prolonged system outages diminishes significantly.
Mean Time to Respond often gets analyzed alongside other incident metrics—such as Mean Time to Recovery and Mean Time to Resolve—to provide a comprehensive view of the overall recovery ecosystem. Together, these metrics help internal teams understand not just how long it takes to resolve problems, but how rapidly they can mobilize when failures strike. This holistic approach to incident management enables organizations to refine their incident response procedures, streamline alert fatigue reduction, and ultimately enhance both system availability and reliability.
By consistently measuring and working to reduce mean time to respond, engineering and DevOps teams can dramatically enhance their responsiveness, optimize the incident management process, and ensure that system failures get addressed with unprecedented speed—leading to elevated customer satisfaction and robust system reliability that transforms operational excellence.
Downtime can be detrimental, impacting revenue and customer trust. MTTR measures the time taken to recover from a failure. When system fails or major incidents occur, organizations rely on MTTR to resolve incidents quickly and minimize impact. A high MTTR indicates inefficiencies in issue identification and resolution. Investing in automation, refining monitoring systems, and bolstering incident response protocols minimizes downtime, ensuring uninterrupted services.
Low deployment failures and a short recovery time exemplify quality deployments and efficient incident response. Robust testing and a prepared incident response strategy minimize downtime, ensuring high-quality releases and exceptional user experiences.
A high failure rate alongside swift recovery signifies a team adept at identifying and rectifying deployment issues promptly. Rapid responses minimize impact, allowing quick recovery and valuable learning from failures, strengthening the team's resilience.
MTTR is more than just a metric; it reflects engineering teams’ commitment to resilience, customer satisfaction, and continuous improvement. Both maintenance teams and the engineering team play a vital role in reducing MTTR by quickly diagnosing and resolving issues. Leadership within the engineering department is essential for fostering accountability and driving continuous improvement in recovery times. A low MTTR signifies:
Working closely with your service provider ensures that MTTR targets are met and SLAs are upheld.
Having an efficient incident response process indicates a well-structured incident management system capable of handling diverse challenges.
Proactively identifying and addressing underlying issues can prevent recurrent incidents and result in low MTTR values.
Trust plays a crucial role in service-oriented industries. A low mean time to resolve (MTTR) builds trust among users, stakeholders, and customers by showcasing reliability and a commitment to service quality.
Efficient incident recovery ensures prompt resolution without workflow disruption, leading to operational efficiency.
User satisfaction is directly proportional to the reliability of the system. A low Mean Time To Repair (MTTR) results in a positive user experience, which enhances overall satisfaction.
Minimizing downtime is crucial to maintain business continuity and ensure critical systems are consistently available.
Optimizing MTTR involves implementing strategic practices to enhance incident response and recovery. Teams should communicate effectively and ensure everyone is on the same page regarding MTTR definitions and goals. Refining recovery processes is also key to reducing MTTR and improving operational efficiency. Key strategies include:
Leveraging automation for incident detection, diagnosis, and recovery can significantly reduce manual intervention, accelerating recovery times. Build continuous delivery systems to automate failure detection, testing, and monitoring. These systems not only quicken response times but also help maintain consistent operational quality.
Make small but consistent changes to your systems and processes. This approach encourages steady improvements and minimizes the risk of large-scale disruptions, helping to maintain a stable environment that supports faster recovery.
Fostering collaboration among development, operations, and support teams ensures a unified response to incidents, improving overall efficiency. Create strong DevOps teams to keep your complex applications running smoothly. A cohesive team structure enhances communication and streamlines problem-solving.
Implement continuous monitoring for real-time issue detection and resolution. Monitoring tools provide insights into system health, enabling proactive incident management. Use these insights to enact immediate issue resolution with the right processes and tools, ensuring that problems are addressed as soon as they arise.
Investing in team members' training and skill development can improve incident efficiency and reduce MTTR. Equip your teams with the necessary skills and knowledge to handle incidents swiftly and effectively.
Establishing a dedicated incident response team with defined roles and responsibilities contributes to effective incident resolution. This further enhances overall incident response capabilities, ensuring everyone knows their specific duties during a crisis, which minimizes confusion and delays.
In the world of software development, certain stages within the development life cycle stand out as crucial points for monitoring and automation. Here's a closer look at those key phases:
During the integration phase, individual code contributions are combined into a shared repository. Automated tools help manage merging conflicts and ensure that new code plays nicely with existing components. This step is vital for spotting early errors, making it seamless and efficient.
Automation shines in the testing stage. Automated testing tools quickly run a battery of tests on the integrated code to catch bugs and ensure everything works as expected. Testing can include unit tests, integration tests, and performance checks. This stage is essential for maintaining code quality without slowing down progress.
Deploying the software involves delivering it to the production environment. Automation reduces human error, accelerates the release cycle, and ensures consistent deployment practices. Continuous deployment frameworks like Jenkins or Travis CI are often used to streamline this process.
After deployment, continuous monitoring is critical. Automated systems keep an eye on application performance and user interactions, promptly alerting teams to any anomalies or issues. It ensures the software runs smoothly and user experiences are optimized, allowing swift responses to any problems.
Through these strategic stages of integration, testing, deployment, and ongoing monitoring, businesses are able to achieve faster deployment cycles and more reliable releases, aligning with their overarching business goals.
The Mean Time to Recover (MTTR) is a crucial measure in the DORA framework that reflects engineering teams’ ability to bounce back from incidents, work efficiently, and provide dependable services. MTTR specifically measures the time it takes to restore systems to a fully operational state after an incident. It is important to note that scheduled maintenance is typically excluded from MTTR calculations, ensuring the metric focuses on unplanned disruptions. To improve incident response times, minimize downtime, and contribute to their overall success, organizations should recognize the importance of MTTR, implement strategic improvements, and foster a culture of continuous enhancement. Key Performance Indicator considerations play a pivotal role in this process.
For teams seeking to stay ahead in terms of productivity and workflow efficiency, Typo offers a compelling solution. Uncover the complete spectrum of Typo’s capabilities designed to enhance your team’s productivity and streamline workflows. Whether you’re aiming to optimize work processes or foster better collaboration, Typo’s impactful features, aligned with Key Performance Indicator objectives, provide the tools you need. Embrace heightened productivity by unlocking the full potential of Typo for your team’s success today.

DevOps Research and Assessment (DORA) metrics are a compass for engineering teams striving to optimize their development and operations processes. This guide is for engineering managers, DevOps leads, and software teams seeking to understand and implement DORA metrics measurement. If you want to know how to measure DORA metrics, you’re in the right place. We will cover what DORA metrics are, why they matter, and step-by-step methods for measuring them effectively. Whether you’re new to DORA or looking to refine your measurement approach, this comprehensive guide will empower your journey toward DevOps excellence.
To optimize DevOps practices and enhance organizational performance, organizations must master the four DORA metrics, the four key performance indicators most teams use to evaluate software delivery performance—Deployment Frequency, Lead Time for Changes, Mean Time to Recovery, and Change Failure Rate. Specialized tools like Typo simplify the measurement process, and organizations can use specialized tools and dashboards to benchmark current performance and guide improvement efforts. Successful DevOps teams prioritize continuous improvement through regular analysis, iterative adjustments, and adaptive responses. By using DORA metrics to track speed and stability, while stronger delivery also supports customer satisfaction and business impact, organizations can continuously elevate their performance.
Gain valuable insights and empower your engineering managers with Typo’s robust capabilities.
DORA metrics originated from research conducted by Google's DevOps Research and Assessment team, focusing on performance measurements that help teams deliver software more efficiently and quickly. As of 2024, the DORA framework includes five metrics: deployment frequency, lead time for changes, change failure rate, mean time to recover (MTTR), and deployment rework rate.
Organizations generally choose between four primary measurement methods for DORA metrics, balancing custom control against setup speed. Measuring DORA metrics relies on capturing timestamps and event data across the software development lifecycle (SDLC). Here’s a summary of the main approaches:
Selecting the right method depends on your organization’s size, technical maturity, and need for precision versus speed of setup. For additional context on how these metrics support performance measurement, teams can reference a comprehensive overview of DORA metrics. Next, let’s explore the core DORA metrics and why they matter.
The DORA team at Google developed these software delivery performance metrics as a data-driven framework for measuring and improving delivery performance, helping teams move beyond subjective opinions about process efficiency. Given below are the four metrics most teams start with as the core metrics for benchmarking, although the framework expanded in 2024 to include deployment rework rate. Research also shows that elite performers are twice as likely to meet organizational performance targets, which is one reason DORA metrics provide a practical baseline for continuous improvement.
Definition: Deployment frequency is an indicator of DevOps' overall efficiency, as it measures the speed of the development team and their capabilities and level of automation.
Deployment frequency measures how often teams deliver changes to production, making it one of the four key performance indicators used to assess delivery speed and operational stability. Regular deployments signify a streamlined pipeline, and with mature CI/CD, high performing teams may deploy multiple times a day.
Why measure deployment frequency?
Definition: Lead time for changes measures the average speed at which the DevOps team delivers code, from commitment to deployment, indicating the team's capacity and ability to respond to changes in the environment.
This metric measures the time it takes for code changes to move from code commit to production deployment, and the lead time metric reflects the team's ability to respond quickly to changes in the environment. Elite teams can achieve this in less than one hour, while slower teams may take up to a week.
Why measure lead time for changes?
Definition: The change failure rate measures the percentage of deployments that cause a failure in production, requiring immediate remediation such as rollbacks or hotfixes.
Change failure rate gauges the percentage of changes that fail in production and require immediate remediation, such as a rollback or hotfix. Elite DevOps teams usually keep this rate below 15%. A lower failure rate indicates a stable and reliable application, minimizing disruptions caused by failed changes.
Why measure change failure rate?
Definition: The time to restore service, or mean time to recovery, is the average time between encountering an issue and resolving it in the production environment.
The time to restore service, or mean time to recovery, is the average time between encountering an issue and resolving it in the production environment. Elite teams can often restore service in less than an hour, which signals strong incident response procedures and more reliable systems. A lower mean time to recovery is synonymous with a resilient system capable of handling challenges effectively.
Why measure mean time to recovery?
Understanding the nuanced significance of each metric is essential for making informed decisions about the efficacy of your DevOps processes. Teams seeking broader guidance on using these indicators to enhance efficiency and stability can explore a dedicated DORA DevOps metrics efficiency guide. Now that you know what each metric means and why it matters, let’s look at the tools and approaches you can use to measure them.
Efficient measurement of DORA metrics, crucial for optimizing deployment processes and ensuring the success of your DevOps team, requires the right tools, and one such tool that stands out is Typo. For software organizations, specialized platforms are one of four common approaches to implementing DORA metrics and tracking these key performance indicators. Teams working in a single all-in-one DevOps platform may use native dashboards, while dedicated tools like LinearB normalize data from systems such as GitHub and Jira for easier analysis, and platforms like Typoapp.io explain how they use DORA metrics to boost efficiency through real-time insights and automation.
Selecting the right tool or platform is a critical step in ensuring your DORA metrics are accurate and actionable, especially when you are designing a DORA metrics dashboard for your teams. In the next section, we’ll walk through the practical steps to measure DORA metrics in your organization.
Measuring DORA metrics effectively requires collecting accurate data across the software delivery lifecycle and analyzing it to gain insights into team performance. These metrics track both software delivery throughput and system stability, providing engineering leaders with a comprehensive view of their DevOps processes. Here is a generic approach to measuring DORA metrics:
Additional Considerations:
By following these steps, engineering leaders can effectively measure DORA metrics, gain actionable insights, and foster a culture of continuous improvement within their software delivery processes. Next, let’s explore how to use these insights to drive ongoing improvement.
In the rapidly changing world of DevOps, attaining excellence is not an ultimate objective but an ongoing and cyclical process. To accomplish this, measuring DORA (DevOps Research and Assessment) metrics becomes a vital aspect of this journey, creating a continuous improvement loop that covers every stage of your DevOps practices.
The process of measuring DORA metrics is not simply a matter of ticking boxes or crunching numbers. It is about comprehending the narrative behind these metrics and what they reveal about your DevOps procedures. The cycle starts by recognizing that each metric represents your team's effectiveness, dependability, and flexibility.
Consistency is key to making progress. Establish a routine for reviewing DORA metrics – this could be weekly, monthly, or by your development cycles. Delve into the data, and analyze the trends, patterns, and outliers. Determine what is going well and where there is potential for improvement.
During the analysis phase, each metric helps teams understand where delivery is strong and where friction remains across your DevOps performance. This will help you identify the areas where your team is doing well and the areas that need improvement. The purpose of this exercise is not to assign blame but to gain a better understanding of your DevOps ecosystem’s dynamics, while following the key dos and don’ts of using DORA metrics to avoid common pitfalls like using metrics punitively or ignoring context.
After gaining insights from analyzing DORA metrics, implementing iterative changes involves fine-tuning the engine rather than making drastic overhauls. AI tools can improve individual work, with reported gains of 7.5% in documentation quality, 3.4% in code quality, and 3.1% in review speed, but teams should validate whether those gains translate into real delivery outcomes and meaningful process improvements. Faster code generation can reduce delivery stability by 7.2% and delivery throughput by 1.5% when teams abandon small batch principles, so organizations may pair DORA with the DX AI Measurement Framework to track AI impact alongside delivery performance and follow proven practices on improving software delivery using DORA metrics.
Continuous improvement is fostered by a culture of experimentation. It’s important to motivate your team to innovate and try out new approaches, such as frequent deployments with feature flags, smaller releases, or canary-style rollout thinking to reduce risk while optimizing lead times and refining recovery processes. Each experiment contributes to the development of your DevOps practices and helps you evolve and improve over time, ultimately boosting tech team performance with DORA metrics as a framework for learning.
Rather than viewing failure as an outcome, see it as an opportunity to gain knowledge. Embrace the mindset of learning from your failures. If a change doesn't produce the desired results, use it as a chance to gather information and enhance your strategies. Your failures can serve as a foundation for creating a stronger DevOps framework.
DevOps is a constantly evolving practice that is influenced by various factors like technology advancements, industry trends, and organizational changes. Continuous improvement requires staying up-to-date with these dynamics and adapting DevOps practices accordingly by aligning DevOps culture with DORA metrics-driven software delivery improvement. It is important to be agile in response to change.
It’s important to create feedback loops within your DevOps team. Regularly seek input from development and operations teams, including feedback from operations teams involved in different stages of the pipeline, so process issues are visible across the pipeline. Their insights provide a holistic view of the process and encourage a culture of collaborative improvement.
Acknowledge and celebrate achievements, big or small. Recognize the positive impact of implemented changes on DORA metrics. This boosts morale and reinforces a culture of continuous improvement.
By following this guide, engineering managers, DevOps leads, and software teams can confidently understand how to measure DORA metrics, select the right tools and methods, and foster a culture of continuous improvement that drives both technical and business success.

In the rapidly evolving world of DevOps, a DevOps metrics dashboard is essential to comprehend and improve your development and delivery workflows. This guide is intended for DevOps engineers, engineering managers, and operations teams seeking to implement or improve a DORA metrics dashboard using Typo. To evaluate and enhance the efficiency of these workflows, the DevOps Research and Assessment (DORA) metrics serve as a crucial tool.
This blog, specifically designed for Typo, offers a comprehensive guide on creating a DORA metrics dashboard that will help you optimize your DevOps performance.
The DORA metrics consist of four key metrics:
DevOps metrics are essential for measuring the performance and effectiveness of your software delivery process. They help teams identify bottlenecks, track progress, and drive continuous improvement. A good devops dashboard serves as a centralized, real-time visual interface that consolidates key metrics, logs, and alerts from multiple sources to provide actionable insights and key insights. Organizations often use multiple dashboards to monitor different aspects of their DevOps ecosystem, such as CI/CD, infrastructure, security, incident response, and business metrics. This enables teams to monitor and optimize their DevOps workflows efficiently.
While there are many metrics you can track, the most impactful DevOps metrics focus on deployment frequency, lead time for changes, mean time to recovery, and change failure rate. The key elements of effective DevOps dashboards include integrating data from multiple sources, supporting the entire devops lifecycle, and surfacing actionable insights that empower teams to make informed decisions. Not all devops dashboards serve the same purpose or provide the same features—different dashboards are tailored for specific functions. Built in dashboards provided by DevOps platforms can often be customized to fit the unique needs of each team. A DevOps dashboard acts as a single source of truth for monitoring deployments, system uptime, and costs, ensuring comprehensive visibility across the pipeline.
A well-designed DevOps dashboard provides real-time insights into system health, application performance, and CI/CD processes, enabling teams to optimize workflows without switching between platforms. The ability to track metrics through dashboards and scorecards is crucial for effective engineering management and continuous improvement.
DevOps metrics are data points that reveal the performance of a DevOps software development pipeline and help identify bottlenecks in the process. DevOps metrics are the backbone of modern software delivery, providing organizations with the data needed to measure and enhance their DevOps performance. By systematically tracking key DevOps metrics such as deployment frequency and lead time for changes, teams gain critical visibility into their entire DevOps pipeline. It is especially important to track DORA metrics within CI/CD pipelines, and in some cases, this requires recording deployment events using APIs or custom integrations when standard deployment records are not available. These metrics help engineering managers and operations teams quickly identify performance bottlenecks, monitor the health of their deployment process, and ensure that business objectives are being met.
The most impactful DevOps metrics—deployment frequency, lead time for changes, change failure rate, and mean time to recovery—offer a comprehensive view of how efficiently and reliably a team deploys code to production. By analyzing these metrics, teams can pinpoint areas for improvement, reduce technical debt, and accelerate the delivery of high-quality software. Ultimately, tracking DevOps metrics empowers organizations to make data-driven decisions, optimize resource usage, and drive continuous improvement across the entire development lifecycle.
Deployment frequency measures the frequency of deployment of code to production or releases to end-users in a given time frame. Deployment frequency is a key metric for DevOps success, as it indicates how often a team achieves successful deployments to the production environment. It is calculated as the average number of successful deployments to production over a specified time period, such as daily or weekly, and deployment status updates in the devops metrics dashboard help track this metric in real time. High-performing teams achieve high deployment frequency, often deploying on demand multiple times a day, while lower-performing teams may only deploy weekly or monthly. Using industry benchmarks, you can compare your team's deployment frequency against broader standards to assess your DevOps maturity and responsiveness.
This metric measures the time between a commit being made and that commit making it to production. Lead time for changes is defined as the length of time between when a code change is committed to the trunk branch and when it is in a deployable state, such as passing all necessary pre-release tests. Tracking lead time allows teams to track performance and visualize the efficiency of their CI/CD pipelines, helping to identify bottlenecks and accelerate delivery. Over time, as team performance increases, lead time should decrease. High-performing teams typically measure lead times in hours, while medium and low-performing teams measure lead times in days, weeks, or even months.
Change failure rate measures the proportion of deployments to production that result in degraded services. The change failure rate is defined as the percentage of code changes that require hot fixes or other remediation after production, excluding failures caught by testing before deployment. Tracking DORA metrics like change failure rate is essential for understanding the reliability of your CI/CD processes. High-performing teams typically have change failure rates in the 0-15 percent range, reflecting effective deployment processes and automated testing. A high change failure rate may indicate issues such as lack of automated testing, poor change control, or brittle infrastructure.
This metric is also known as the mean time to restore. MTTR measures how long it takes to restore service after a partial service interruption or total system failure, making it a critical metric for incident management. High-performing teams typically recover from system failures in less than an hour, while lower-performing teams may take up to a week to restore service. The focus on MTTR, rather than the historical mean time between failures (MTBF), reflects the increased complexity of modern applications and the expectation that system failures will occur. Effective incident management processes help reduce MTTR and improve overall system reliability. It measures the time required to solve the incident i.e. service incident or defect impacting end-users.
These metrics provide valuable insights into the performance of your software development pipeline. By creating a well-designed dashboard, you can visualize these metrics and make informed decisions to improve your development process continuously.
Before you choose a platform for your DORA Metrics Dashboard, it's important to first define clear and measurable objectives. Consider the Key Performance Indicators (KPIs) that align with your organizational goals. Whether it's improving deployment speed, reducing failure rates, or enhancing overall efficiency, having a well-defined set of objectives will help guide your implementation of the dashboard.
When searching for a platform, it’s important to consider your goals and requirements, as well as the technical capabilities of the platform, such as its ability to integrate with existing tools and support your organization’s infrastructure. Look for a platform that is easy to integrate, scalable, and customizable. Different platforms, such as Typo, have unique features, so choose the one that best suits your organization’s needs and preferences. Some platforms offer built in dashboards that can be quickly implemented and customized to fit your team's requirements.
Gain a deeper understanding of the DevOps Research and Assessment (DORA) metrics by exploring the nuances of Deployment Frequency, Lead Time, Change Failure Rate, and MTTR. Engineering teams play a crucial role in understanding, organizing, and acting on DORA metrics to drive continuous improvement. Then, connect each of these metrics with your organization’s DevOps goals to have a comprehensive understanding of how they contribute towards improving overall performance and efficiency.
After choosing a platform, it's important to follow specific guidelines to properly configure your dashboard. Customize the widgets to accurately represent important metrics and personalize the layout to create a clear and intuitive visualization of your data. This ensures that your team can easily interpret the insights provided by the dashboard and take appropriate actions.
To ensure the accuracy and reliability of your DORA Metrics, it is important to establish strong data collection mechanisms. Configure your dashboard to collect real-time data from relevant sources, so that the metrics reflect the current state of your DevOps processes. This step is crucial for making informed decisions based on up-to-date information.
To optimize the performance of your DORA Metrics Dashboard, you can integrate automation tools. Integrating automation tools helps standardize and streamline development operations, making deployment processes more efficient. By utilizing automation for data collection, analysis, and reporting processes, you can streamline routine tasks. This will free up your team’s time and allow them to focus on making strategic decisions and improvements, instead of spending time on manual data handling.
To get the most out of your well-configured DORA Metrics Dashboard, use the insights gained to identify bottlenecks, streamline processes, and improve overall DevOps efficiency. Analyze the dashboard data regularly to drive continuous improvement initiatives and make informed decisions that will positively impact your software development lifecycle.
Aggregating diverse data sources into a unified dashboard is one of the biggest hurdles while building the DORA metrics dashboard.
For example, if the metrics to be calculated is ‘Lead time for changes’ and sources include a version control system in GIT, Issue tracking in Jira, and a Build server in Jenkins. The timestamps recorded in Git, Jira, and Jenkins may not be synchronized or standardized and they may capture data at different levels of granularity. Incident management dashboards often consolidate logs, error messages, deployment history, and infrastructure metrics to facilitate quicker root cause analysis and post-mortem investigations.
Another challenge is whether the dashboard effectively communicates the insights derived from the metrics.
Suppose, you want to get visualized insights for deployment frequency. You choose a line chart for the same. However, if the frequency is too high, the chart might become cluttered and difficult to interpret. Moreover, displaying deployment frequency without additional information can lead to misinterpretation of the metric. Visualizing system performance metrics, such as CPU usage, can be particularly challenging due to the volume and granularity of the data, making it harder to present clear and actionable insights. Resource utilization metrics, such as memory and storage usage, also present similar visualization challenges due to their complexity and data density.
Teams may fear that the DORA dashboard will be used for blame rather than the improvement. Moreover, if there's a lack of trust in the organization, they question the motives behind implementing metrics and doubt the fairness of the process.
Successfully implementing DevOps metrics requires a strategic approach that goes beyond simply collecting raw data. Start by identifying the key metrics that align with your organization’s business outcomes and DevOps goals.
Use multiple tools to pull data from various stages of your DevOps pipeline, ensuring comprehensive coverage of your entire tech stack. Integrating data from cloud infrastructure is essential for monitoring server uptime, resource utilization, and overall cloud health metrics. Integrating these data sources into a centralized visual interface—such as a well-designed DevOps dashboard—enables teams to display data in a way that is both actionable and easy to interpret.
To maximize the value of your metrics, prioritize automated testing, continuous integration, and continuous deployment. These practices not only improve the accuracy of your metrics but also help reduce cloud costs and streamline the deployment process.
Establish clear objectives for metrics collection and analysis, and regularly review your metrics to track progress and drive continuous improvement. By following these best practices, DevOps teams can measure DevOps performance effectively, gain insights into system health, and ensure that their efforts are directly contributing to improved business outcomes.
Typo, as a dynamic platform, provides a user-friendly interface and robust features tailored for DevOps excellence. Security teams can also leverage Typo's dashboards to monitor vulnerabilities, manage access logs, and ensure compliance with security standards.
Leveraging Typo for your DORA Metrics Dashboard offers several advantages:
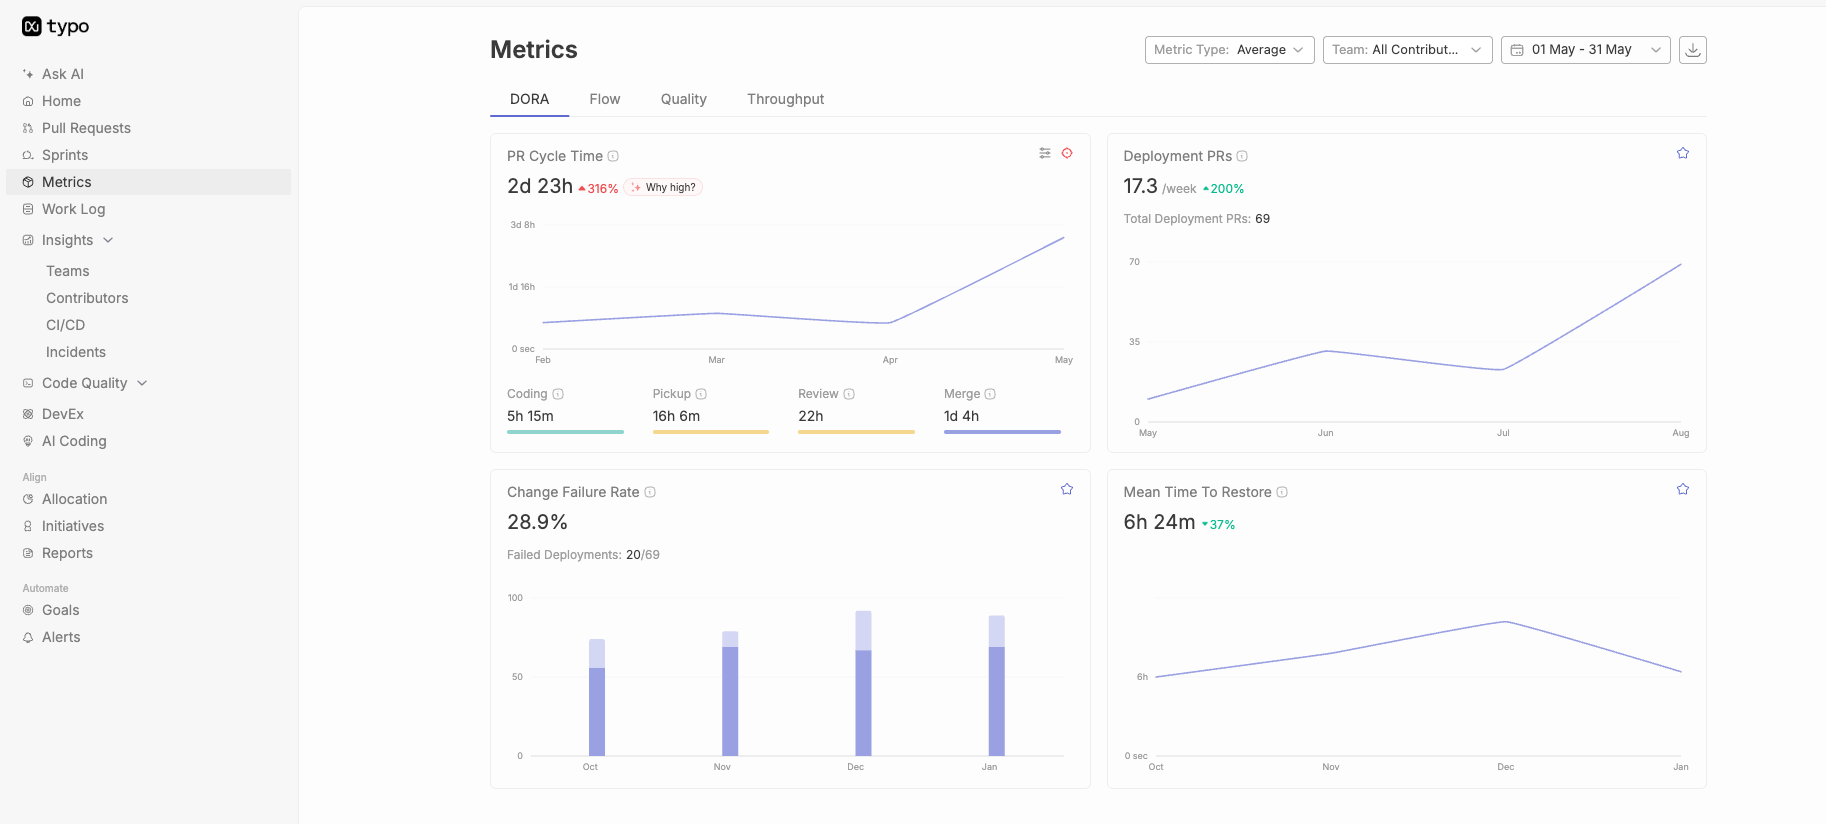
Typo integrates with key DevOps tools and infrastructure monitoring solutions, providing comprehensive visibility into server performance and system health, and ensuring a smooth data flow for accurate metric representation.
Typo allows for easy customization of widgets, so you can align the dashboard precisely with your organization's unique metrics and objectives.
Typo’s automation features streamline data collection and reporting, reducing manual efforts and ensuring real-time, accurate insights. Additionally, Typo can help monitor and report on system uptime, ensuring high availability and reliability.
Typo facilitates collaboration among team members, allowing them to collectively interpret and act upon dashboard insights, fostering a culture of continuous improvement.
Typo is designed to scale with your organization’s growth, accommodating evolving needs and ensuring the longevity of your DevOps initiatives. Its scalability ensures reliable monitoring and management of metrics as your production environment grows.
When you opt for Typo as your preferred platform, you enable your team to fully utilize the DORA metrics. This drives efficiency, innovation, and excellence throughout your DevOps journey. Make the most of Typo to take your DevOps practices to the next level and stay ahead in the competitive software development landscape of today.
DORA metrics dashboard plays a crucial role in optimizing DevOps performance.
Building the dashboard with Typo provides various benefits such as tailored integration and customization. To know more about it, book your demo today!

DORA Insights assesses and enhances software delivery performance. Strategic considerations are necessary to identify areas of improvement, reduce time-to-market, and improve software quality. Effective utilization of DORA Insights can drive positive organizational changes and achieve software delivery goals.
DORA Insights is a data-driven framework designed to evaluate, benchmark, and improve an organization's software delivery and operational performance. This article provides a comprehensive overview of DORA Insights and DORA metrics, focusing on best practices and common pitfalls for DevOps teams, engineering managers, and technology leaders. By understanding how to leverage DORA Insights, organizations can objectively evaluate engineering performance, align metrics with business objectives, and foster a culture of continuous improvement. Whether you are looking to optimize your software delivery pipeline or align engineering outcomes with business goals, this guide will help you make the most of DORA Insights.
DORA Insights is a data-driven framework designed to evaluate, benchmark, and improve an organization's software delivery and operational performance. By leveraging DORA Insights, organizations can objectively evaluate engineering performance rather than tracking mere lines of code. This approach enables teams to align engineering performance metrics directly with corporate objectives, improving profitability and customer satisfaction.
DORA metrics are four measurements of software delivery velocity and stability, developed by the DevOps Research and Assessment (DORA) program at Google Cloud. These are Deployment Frequency, Lead Time for Changes, Change Fail Rate, and Time to Restore Service.
In 2015, The DORA team was founded by Gene Kim, Jez Humble, and Dr. Nicole Forsgren to evaluate and improve software development practices. The aim was to enhance the understanding of how organizations can deliver reliable and high-quality software faster.
To achieve success in the field of software development, it is crucial to possess a comprehensive understanding of DORA metrics. DORA stands for DevOps Research and Assessment and originated from the program at Google Cloud, where it defined four performance metrics for software delivery velocity and stability. These four measurements help teams measure software delivery performance, identify areas for improvement, and set goals for service-level agreements (SLAs).
Mastering the four DORA metrics and core DORA metrics is fundamental because they assess software delivery throughput as well as stability. By analyzing Deployment Frequency, Lead Time for Changes, Change Fail Rate, and time to restore service, DevOps teams can identify bottlenecks and inefficiencies, streamline their processes, and ultimately deliver reliable and high-quality software faster.
The DORA (DevOps Research and Assessment) metrics are widely used to measure and improve software delivery performance. However, to make the most of these metrics, it is important to tailor them to align with specific organizational goals and business outcomes. By doing so, organizations can ensure that their improvement strategy is focused and impactful, addressing unique business needs when implementing DORA DevOps metrics in large organizations.
Customizing DORA metrics requires a thorough understanding of the organization’s goals and objectives, so engineering performance metrics support business outcomes, as well as its current software delivery processes. This may involve identifying the key performance indicators (KPIs) that are most relevant to the organization’s specific goals, such as faster time-to-market or improved quality.
Once these KPIs have been identified, the organization can use DORA metrics data to track and measure its performance in these areas. By regularly monitoring these metrics, the organization can identify areas for improvement and implement targeted strategies that can boost productivity and drive business value when aligned with organizational goals, helping connect engineering performance to corporate objectives like profitability and customer satisfaction.
Consistency in measuring and monitoring DevOps Research and Assessment (DORA) metrics over time is essential for establishing a reliable feedback loop. Organizations should measure DORA metrics continuously rather than intermittently so they can make data-driven changes instead of relying on guesswork. By measuring and monitoring DORA metrics consistently, organizations can gain valuable insights into their software delivery performance and identify areas that require attention. This, in turn, allows the organization to make informed decisions based on actual data, rather than intuition or guesswork. Measuring time deltas across the delivery process also helps teams identify bottlenecks in the pipeline. Using the right tools during implementation also helps teams collect precise data. Ultimately, this approach helps organizations use DORA metrics as actionable insights to systematically upgrade the engineering pipeline and improve performance.
Using the DORA metrics as a collaborative tool can greatly benefit organizations by fostering shared responsibility between development and operations teams, and a broader DORA DevOps metrics guide can further support teams in improving efficiency, stability, and agility. This approach helps break down silos and enhances overall performance by improving communication and increasing transparency.
By leveraging DORA metrics, engineering teams can gain valuable insights into their software delivery processes and identify areas for improvement. These metrics can also help teams measure the impact of changes and track progress over time. DORA can also show patterns across multidisciplinary teams through performance brackets based on global data models for velocity and stability, which is more useful for learning than trying to rank other teams simplistically. Ultimately, using DORA metrics as a collaborative tool can lead to more efficient and effective software delivery and better alignment between development and operations teams.
Prioritizing the reduction of lead time involves streamlining the processes involved in the production and delivery of goods or services, including faster, more reliable production deployment, thereby enhancing business value and reinforcing the importance of measuring DORA metrics accurately. By minimizing the time taken to complete each step, businesses can achieve faster delivery cycles and more successful deployments, which is essential in today’s competitive market.
Reducing the amount of work in each release helps teams achieve high deployment frequency, collect feedback sooner, and iterate faster.
This approach also enables organizations to respond more quickly and effectively to the evolving needs of customers. By reducing lead time, businesses can improve their overall efficiency and productivity, resulting in greater customer satisfaction and loyalty. Therefore, businesses need to prioritize the reduction of lead time if they want to achieve operational excellence and stay ahead of the curve.
When it comes to how teams implement DORA metrics iteratively, it’s important to adopt an approach that prioritizes adaptability and continuous improvement. By doing so, organizations can remain agile and responsive to the ever-changing technological landscape.
Iterative processes involve breaking down a complex implementation into smaller, more manageable stages, which is central to mastering the art of DORA metrics. This allows teams to test and refine each stage before moving onto the next, which ultimately leads to a more robust and effective implementation. DORA Insights is a data-driven framework designed to evaluate, benchmark, and improve an organization’s software delivery and operational performance.
Furthermore, an iterative approach encourages collaboration and communication between team members, which can help identify potential issues early, surface bottlenecks in the SDLC, and improve software development lifecycle efficiency with devops tools that collect precise data across the technology stack. In summary, viewing DORA metrics implementation as an iterative process is a smart way to ensure success and facilitate growth in a rapidly changing environment.
Recognizing and acknowledging the progress made in the DORA metrics is an effective way to promote a culture of continuous improvement within the organization. It not only helps boost the morale and motivation of the team but also encourages them to strive for excellence. By celebrating the achievements and progress made towards the goals, and recognizing gains in speed and delivery stability together, software teams can be motivated to work harder and smarter to achieve even better results.
Moreover, acknowledging improvements in key DORA metrics creates a sense of ownership and responsibility among the team members, which in turn drives them to take initiative and work towards the common goal of achieving organizational success, while reinforcing that balanced gains show speed and stability improve together in high-performing delivery systems.
While following these best practices is essential, it is equally important to be aware of common pitfalls when using DORA metrics, including the pros and cons of DORA metrics for continuous delivery.
It is important to note that dora metrics provide useful system-level signals, but drawing conclusions solely from them can still lead to inaccurate or misguided results.
To avoid such situations, it is essential to have a comprehensive understanding of the larger organizational context, including its goals, objectives, and challenges. This contextual understanding empowers stakeholders to use DORA metrics more effectively and make better-informed decisions.
Therefore, it is recommended that DORA metrics be viewed as part of a more extensive organizational framework so organizations can use them for actionable insights to systematically upgrade their engineering pipeline and improve performance, rather than relying on them alone without broader operational context.
Maintaining a balance between speed and stability is crucial for the long-term success of any system or process, and DORA metrics align delivery speed with stability when assessing engineering health by weighing throughput against instability. While speed is a desirable factor, overemphasizing it can often result in a higher chance of errors and a greater change failure rate.
In such cases, when speed is prioritized over stability, the system may become prone to frequent crashes, downtime, and other issues that can ultimately harm overall productivity, effectiveness, and engineering health by increasing instability. Therefore, it is essential to ensure that speed and stability are balanced and optimized for the best possible outcome.
The DORA (DevOps Research and Assessment) metrics are widely used to measure the effectiveness and efficiency of software development teams covering aspects such as code quality and various workflow metrics. However, it is important to note that these metrics should not be used as a means to assign blame to individuals or teams; they are better used with global benchmarks to understand performance brackets across development velocity and stability, not to punish people.
Rather, they should be employed collaboratively to identify areas for improvement and to foster a culture of innovation and collaboration. These benchmarks can describe high performing teams, elite performers, or low performers as broad categories, and high-performing groups often keep change failure rates around 0-15% while lower-performing groups may see 46-60%. By focusing on the collective goal of improving the software development process, teams can work together to enhance their performance and achieve better results.
It is crucial to approach DORA metrics as a tool for continuous improvement, rather than a means of evaluating individual performance, especially for leaders who rely on a practical DORA metrics guide for engineering management. This approach can lead to more positive outcomes and a more productive work environment.
Continuous learning, which refers to the process of consistently acquiring new knowledge and skills, is fundamental for achieving success in both personal and professional life. In the context of DORA metrics, which stands for DevOps Research and Assessment, it is important to consider the learning aspect to ensure continuous improvement.
Neglecting this aspect can impede ongoing progress and hinder the ability to keep up with the ever-changing demands and requirements of the industry, particularly when teams lack practical insights for implementing DORA metrics. Therefore, it is crucial to prioritize learning as an integral part of the DORA metrics to achieve sustained success and growth.
Benchmarking is a useful tool for organizations to assess their performance, identify areas for improvement, and compare themselves to industry standards. However, it is important to note that relying solely on benchmarking can be limiting.
Every organization has unique circumstances that may require deviations from industry benchmarks. Therefore, it is essential to focus on tailored improvements that fit the specific needs of the organization. By doing so, software development teams can not only improve organizational performance but also avoid signs of declining DORA metrics and achieve a competitive edge within the industry.
To make the most out of data collection, it is crucial to have a well-defined plan for utilizing the data to drive positive change. The data collected should be relevant, accurate, and timely so it supports precise data analysis. The next step is to establish a feedback loop for analysis and implementation.
This feedback loop involves a continuous cycle of collecting data, analyzing it, making decisions based on the insights gained, and then implementing any necessary changes, often using value stream management to turn metrics into action. This ensures that the data collected is being used to drive meaningful improvements in the organization.
The feedback loop should be well-structured and transparent, with clear communication channels and established protocols for data management. By setting up a robust feedback loop, organizations can derive maximum value from DORA metrics and use stream management to keep improvements tied to business operations.
When it comes to evaluating software delivery performance and fostering a culture of continuous delivery, relying solely on quantitative data may not provide a complete picture. This is where qualitative feedback, particularly from engineering leaders, comes into play, as it enables us to gain a more comprehensive and nuanced understanding of how our software delivery process is functioning.
Combining both quantitative and qualitative feedback can ensure that continuous delivery efforts are aligned with the strategic goals of the organization. Hence, empowering engineering leaders to make informed, data-driven decisions that drive better outcomes.
Typo is a powerful tool designed specifically for tracking and analyzing the core DORA metrics and other DORA metrics from one place, providing an efficient solution for development teams to seek precision in their DevOps performance measurement.
To effectively use DORA metrics and enhance developer productivity, organizations must use DORA insights to evaluate software delivery and operational performance objectively, with emphasis on understanding, alignment, collaboration, and continuous improvement. By following this approach, software teams can gain valuable insights to drive positive change and achieve engineering excellence with a focus on continuous delivery, as DORA metrics help organizations improve business outcomes through better software delivery performance, not vanity metrics.
A holistic view of all aspects of software development helps identify key areas for improvement. Alignment ensures that everyone is working towards the same goals. Collaboration fosters communication and knowledge-sharing amongst teams. Continuous improvement is critical to engineering excellence, allowing organizations to stay ahead of the competition and deliver high-quality products and services to customers.
Adopting DevOps methods and tracking DORA metrics is crucial for firms aiming to achieve agility, efficiency, and quality in software development—a constantly changing terrain. This guide is designed for DevOps professionals, engineering managers, and software teams who want to understand and leverage devops metrics dora to improve software delivery performance and benchmark against industry standards. Understanding DORA metrics matters because it enables organizations to identify bottlenecks, drive continuous improvement, and measure their performance against industry leaders. This guide explains what DORA metrics are, why they matter for DevOps teams, and how organizations can use them to drive continuous improvement.
DORA (DevOps Research and Assessment) metrics are four evidence-based indicators used to evaluate and optimize software delivery performance. These performance measurements help teams deliver software more efficiently and quickly, focusing on four core metrics: deployment frequency, lead time for changes, change failure rate, and mean time to restore. DORA metrics provide a standardized way to benchmark performance across teams, helping organizations identify actionable opportunities for improvement in their software development processes. By tracking these metrics, DevOps teams can make data-driven decisions, accelerate delivery, and enhance software quality.
DORA metrics are divided into two throughput (velocity) metrics and two stability (quality) metrics:
These metrics serve as key performance measurements for software delivery, enabling teams to assess both the speed and reliability of their DevOps processes.. With this foundation, let's explore the essence of DevOps metrics and how DORA metrics specifically assess DevOps performance.
DevOps is more than just a collection of methods; it's a paradigm change that encourages teams to work together, from development to operations. To accomplish common goals, DevOps practices eliminate barriers, enhance communication, and coordinate efforts. It guarantees consistency and dependability in software delivery and aims to automate processes to standardize and speed them up.
With this understanding of DevOps principles, we can now see how DORA metrics provide a concrete framework for measuring and improving these practices.
If you want to know how well your DevOps methods are doing, look no further than DORA—short for DevOps Research and Assessment—now part of Google Cloud. In DevOps research, the research and assessment DORA team established the four DORA metrics to benchmark software delivery and collaboration.
DORA metrics, developed by the DORA team, are four evidence-based indicators used to evaluate and optimize software delivery performance. These key measurements provide a data-driven way to assess the effectiveness and efficiency of software development and delivery processes.
To help organizations find ways to improve and make smart decisions, teams measure DORA metrics to ground engineering decisions in concrete, quantitative data. The framework includes four key measurements split into two throughput metrics and two stability metrics: Deployment Frequency, Lead Time for Changes, Change Failure Rate, and Mean Time to Restore.
Let's dive deeper into each DORA metric, their definitions, importance, and how to optimize them.
Definition: Deployment Frequency measures how often an organization successfully releases changes to production. It is a throughput (velocity) metric.
Greater deployment frequency is an indication of increased agility and the ability to respond quickly to market demands. A team can respond to client input, enhance their product, and supply new features and repairs faster with a greater Deployment Frequency.
Definition: Lead time for changes measures the average time it takes to deliver code from commitment to production deployment. It is a throughput (velocity) metric.
Definition: Change Failure Rate measures the percentage of deployments that cause a failure in production. It is a stability (quality) metric.
Definition: Mean Time to Restore (MTTR) evaluates the average time it takes to recover from a production failure. It is a stability (quality) metric.
With a clear understanding of each DORA metric, let's look at how to measure and implement them effectively within your organization.
With these structures in place, organizations can maximize the value of DORA metrics and drive meaningful improvements in software delivery.
Value Stream Management refers to improving the entire value stream from customer request to release so teams can deliver frequent, high-quality releases to end-users. The success metric for value stream management is customer satisfaction—realizing the value of the changes by delivering business value across the value stream and improving organizational performance.
By leveraging DORA metrics within value stream management, organizations can align technical performance with business outcomes.
New features and updates must be deployed quickly in competitive e-commerce. E-commerce platforms can enhance deployment frequency and lead time with DORA analytics.
An e-commerce company implements DORA metrics but finds that manual testing takes too long to deploy frequently. They save lead time and boost deployment frequency by introducing automated testing to reduce release friction, support multiple deployments with less risk, and streamline CI/CD pipelines. This lets businesses quickly release new features and upgrades, giving them an edge.
In the financial industry, dependability and security are vital, thus failures and recovery time must be minimized. DORA measurements can reduce change failures and incident recovery times.
Financial institutions detect high change failure rates during transaction processing system changes. DORA metrics reveal failure causes including testing environment irregularities. Improvements in infrastructure as code and environment management reduce failure rates and mean time to recovery, making client services more reliable.
In healthcare, where software directly affects patient care, deployment optimization and failure reduction are crucial. DORA metrics reduce change failure and deployment time.
For instance, a healthcare software provider discovers that manual approval and validation slow rollout. They speed deployment by automating compliance checks and clarifying approval protocols. They also improve testing procedures to reduce change failure. This allows faster system changes without affecting quality or compliance, increasing patient care.
Tech businesses that want to grow quickly must provide products and upgrades quickly. DORA metrics improve deployment lead time.
A tech startup examines DORA metrics and finds that manual configuration chores slow deployments. They automate configuration management and provisioning with infrastructure as code. Thus, their deployment lead time diminishes, allowing businesses to iterate and innovate faster and attract more users and investors.
Even in manufacturing, where software automates and improves efficiency, deployment methods must be optimized. DORA metrics can speed up and simplify deployment.
A manufacturing company uses IoT devices to monitor production lines in real time. However, updating these devices is time-consuming and error-prone. DORA measurements help them improve version control and automate deployment. This optimizes production by reducing deployment time and ensuring more dependable and synchronized IoT device updates.
Typo is a leading AI-driven engineering analytics platform that helps teams measure DORA metrics across the software delivery process with SDLC visibility, data-driven insights, and workflow automation. It provides comprehensive insights through DORA and other DORA metrics in one centralized dashboard.
Adopting DevOps and leveraging DORA metrics is crucial for modern software development. DevOps metrics drive collaboration and automation, while DORA metrics offer valuable insights to streamline delivery processes and boost team performance. Together, they help teams deliver higher-quality software faster and stay ahead in a competitive market.

Are you familiar with the term Change Failure Rate (CFR)? It’s one of the four DORA metrics in DevOps, alongside Deployment Frequency, Lead Time for Changes, and Mean Time to Restore. The four DORA metrics are: Deployment Frequency (how often new code is released), Lead Time for Changes (the time it takes for a commit to reach production), Mean Time to Restore (how quickly teams recover from failures), and Change Failure Rate (the percentage of deployments causing failures). These DORA metrics are essential for assessing software change management processes and overall DevOps effectiveness. CFR measures the percentage of changes to production that result in degraded service or require remediation, identifying the percentage of workflows that fail to enter production and the overall risk this poses to development. This metric is pivotal for development teams in assessing the reliability and stability of the deployment process.
CFR, or Change Failure Rate, measures the frequency at which newly deployed changes lead to failures, defects after production, glitches, or unexpected outcomes in the IT environment. It reflects the quality, stability, and reliability of the entire software development and deployment lifecycle. By tracking CFR, teams can identify bottlenecks, flaws, or vulnerabilities in their processes, tools, or infrastructure that can negatively impact the quality, speed, and cost of software delivery. Monitoring CFR over time helps organizations make informed decisions about when it’s safe to release more often or when to hold back, and provides concrete data on deployment quality, motivating teams to improve testing and code robustness. Organizations can gain valuable insights by monitoring and analyzing their team’s change failure rate, supporting both immediate projects and long-term value stream management. Continuous delivery practices play a key role in reducing change failure rates and improving deployment confidence, aligning with Agile principles to deliver valuable software early and frequently.
Lowering CFR is a crucial goal for any organization that wants to maintain a dependable and efficient deployment pipeline. A high change failure rate often correlates with longer lead times and Mean Time to Restore (MTTR), and can result in increased operational costs, financial losses, and damage to customer trust and satisfaction. High CFR leads to downtime, lost revenue, damaged customer trust, and resource drain from fixing issues. High CFR can also negatively impact the overall reliability of software services, leading to user dissatisfaction and longer recovery times. To reduce CFR, teams need to implement a comprehensive strategy involving continuous testing, monitoring, feedback loops, automation, collaboration, and culture change. It is important to regularly review and adjust the definition of failure to keep the metric relevant and accurate, as a more lax definition can artificially lower the observed failure rate. Failures caused by external factors, such as third-party outages or network problems, should not be included in the CFR calculation. Excluding ‘fix-only’ deployments from the calculation provides a clearer picture of system stability. For accurate measurement, organizations should connect incident data (often stored in a separate system, such as a dedicated incident management tool like PagerDuty) with deployment data to avoid misinterpreting deployment failures as change failures. By optimizing their workflows and enhancing their capabilities, teams can increase agility, resilience, and innovation while delivering high-quality software at scale. Quality improvements in development processes reduce developer toil and can boost morale and productivity. Measuring change failure rate and analyzing other DORA metrics together gives team leaders truthful insights, allowing them to analyze metrics to assess team performance and improve development processes, supporting both immediate projects and the health of the organization’s Value Stream Management. A ‘good’ Change Failure Rate is generally considered to be below 5%, but this can vary based on organizational goals and system complexity. A CFR below 15% indicates elite performance, while a CFR above 45% is considered low performance.

Change failure rate measures software development reliability and efficiency. It’s related to team capacity, code complexity, and process efficiency, impacting speed and quality. Change Failure Rate calculation is done by following these steps:
Identify Failed Changes: Keep track of the number of changes that resulted in failures during a specific timeframe.
Determine Total Changes Implemented: Count the total changes or deployments made during the same period.
Apply the formula:
Use the formula CFR = (Number of Failed Changes / Total Number of Changes) * 100 to calculate the Change Failure Rate as a percentage.
Note: Only production deployments that are not ‘fix-only’ should be included in the calculation. Excluding ‘fix-only’ deployments provides a clearer picture of system stability. Additionally, failures caused by external factors, such as third-party outages or network problems, should not be counted in the CFR calculation, as these do not reflect the quality of code changes. Accurate CFR measurement requires connecting incident data (from tools like PagerDuty) and deployment data, which may be stored in separate systems, to ensure that only relevant failures are included.
Here is an example: Suppose during a month:
Failed Changes = 5
Total Changes = 100
Using the formula: (5/100)*100 = 5
Therefore, the Change Failure Rate for that period is 5%.
After calculating CFR, it's important to note that the deployment frequency metric—another key DORA metric—is closely related to CFR and helps teams track how often new code is released. Monitoring both metrics together provides better insight into deployment quality and team efficiency.
It only considers what happens after deployment and not anything before it. 0% - 15% CFR is considered to be a good indicator of your code quality.
Low change failures mean that the code review and deployment process needs attention. To reduce it, the team should focus on reducing deployment failures and time wasted due to delays, ensuring a smoother and more efficient software delivery performance. Implementing Pull Request (PR) reviews can help catch errors before production, reducing change failure rates. Using feature flags allows for controlled rollouts, which helps mitigate risks associated with deployments. Adopting continuous integration and continuous delivery (CI/CD) practices is fundamental to reducing change failure rates. To improve CFR, organizations should enhance automated testing, optimize code reviews, and implement phased rollouts using feature flags.
With Typo, you can improve dev efficiency and team performance with an inbuilt DORA metrics dashboard.
The Change Failure Rate (CFR) is one of the four key metrics used in DORA, and analyzing CFR alongside other DORA metrics—such as deployment frequency and lead time for changes—provides a comprehensive view of software delivery performance.

Stability is pivotal in software deployment. The Change Failure Rate measures the percentage of changes that fail, and is used to assess the effectiveness of change management processes and identify areas for improvement. The practices of the software development team and the stability of software systems directly impact the change failure rate. A robust software delivery process and optimized delivery processes are essential for minimizing change failure rates and ensuring efficient, reliable releases. Well-structured Jira tickets and continuous process improvements can significantly enhance engineering performance by improving software development efficiency and overall engineering effectiveness. A high failure rate could signify inadequate testing, poor code quality, or insufficient quality control. High CFR also signifies weak testing and CI/CD processes, impacting both software quality and process stability. Organizations should regularly review and adjust their definition of failure to keep the Change Failure Rate metric relevant and accurate. Enhancing testing protocols, refining the code review process, and ensuring thorough documentation can reduce the failure rate, enhancing overall stability and team performance.
Low comments and minimal deployment failures signify high-quality initial code submissions. The use of automated tools can help maintain high-quality code submissions and reduce the likelihood of deployment failures by streamlining quality assurance and error detection. This scenario highlights exceptional collaboration and communication within the team, resulting in stable deployments and satisfied end-users.
Teams with meticulous review processes and a few deployment issues showcase meticulous review processes. A well-defined development process supports thorough code reviews and contributes to lower change failure rates by embedding quality checks and clear acceptance criteria throughout development. Investigating these instances ensures review comments align with deployment stability concerns, ensuring constructive feedback leads to refined code.
Change Failure Rate (CFR) is more than just a metric and is an essential indicator of an organization’s software development health. It encapsulates the core aspects of resilience and efficiency within the software development life cycle. A high CFR can lead to unintended consequences, such as service degradation and service impairment, which negatively affect customer trust and satisfaction.
The CFR (Change Failure Rate) reflects how well an organization’s software development practices can handle changes. A low CFR indicates the organization can make changes with minimal disruptions and failures. This level of resilience is a testament to the strength of their processes, showing their ability to adapt to changing requirements without difficulty.
Organizational resilience is further strengthened when all the teams have a unified understanding and response to failures, ensuring consistency in how failures are identified and managed across the organization.
Efficiency lies at the core of CFR. A low CFR indicates that the organization has streamlined its deployment processes. Efficient deployment processes ensure that deploying code and production deployments are reliable and less prone to failure. It suggests that changes are rigorously tested, validated, and integrated into the production environment with minimal disruptions. This efficiency is not just a numerical value, but it reflects the organization’s dedication to delivering dependable software.
A high change failure rate, on the other hand, indicates potential issues in the deployment pipeline. It serves as an early warning system, highlighting areas that might affect system reliability. Effective incident management and the use of incident management tools help teams detect and respond to issues early, reducing the impact of deployment failures. Implementing effective testing and CI/CD practices enables teams to catch issues earlier in the deployment process, which reduces failure rates and improves overall deployment success. Identifying and addressing these issues becomes critical in maintaining a reliable software infrastructure.
The essence of CFR (Change Failure Rate) lies in its direct correlation with the overall reliability of a system. A high CFR indicates that changes made to the system are more likely to result in failures, which could lead to service disruptions and user dissatisfaction. Tracking failed deployment recovery time and using remediation actions such as hotfix, rollback, and fix forward are essential for maintaining system reliability after failures. Therefore, it is crucial to understand that the essence of CFR is closely linked to the end-user experience and the trustworthiness of the deployed software.
The Change Failure Rate (CFR) is a crucial metric that evaluates how effective an organization’s IT practices are. It’s not just a number - it affects different aspects of organizational performance, including customer satisfaction, system availability, and overall business success. Therefore, it is important to monitor and improve it. Regularly reviewing the team's change failure rate helps organizations assess deployment and operational risks, identify flaws, and manage product quality and reliability.
Efficient IT processes result in a low CFR, indicating a reliable software deployment pipeline with fewer failed deployments.
Organizations can identify IT weaknesses by monitoring CFR. High CFR patterns highlight areas that require attention, enabling proactive measures for software development.
CFR directly influences customer satisfaction. High CFR can cause service issues, impacting end-users. Low CFR results in smooth deployments, enhancing user experience.
The reliability of IT systems is critical for business operations. A lower CFR implies higher system availability, reducing the chances of downtime and ensuring that critical systems are consistently accessible.
Efficient IT processes are reflected in a low CFR, which contributes to operational efficiency. This, in turn, positively affects overall business success by streamlining development workflows and reducing the time to market for new features or products.
A lower CFR means fewer post-deployment issues and lower costs for resolving problems, resulting in potential revenue gains. This financial aspect is crucial to the overall success and sustainability of the organization.
Organizations can improve software development by proactively addressing issues highlighted by CFR.
Organizations can enhance IT resilience by identifying and mitigating factors contributing to high CFR.
CFR indirectly contributes to security by promoting stable and reliable deployment practices. A well-maintained CFR reflects a disciplined approach to changes, reducing the likelihood of introducing vulnerabilities into the system. Automated security scanning and other security checks help identify security issues early in the development process, reducing the risk of vulnerabilities leading to failures.
Implementing strategic practices can optimize the Change Failure Rate (CFR) by enhancing software development and deployment reliability and efficiency. Optimizing delivery processes and avoiding common mistakes when measuring change failure rate—such as misclassifying failures or relying on manual processes—are essential for accurate assessment and improvement. Teams should conduct thorough post-mortem analyses after failures to learn from incidents and prevent recurrence. Adopting a blameless culture and conducting post-mortems helps organizations learn from failures and improve their processes. Removing structural barriers that impede communication and collaboration can further improve CFR. Additionally, improving team accountability and feedback loops enhances deployment quality and reduces change failure rates. When deployments fail, they often subsequently require remediation, such as a hotfix, rollback, fix forward, or patch, to restore service. Implementing automated rollback mechanisms can significantly reduce the impact of deployment failures, supporting more resilient delivery processes. Analyzing successful deployments is also important to identify what went right and replicate those practices in future deployments.
Implementing automated testing and deployment processes is crucial for minimizing human error and ensuring the consistency of deployments. Automated testing catches potential issues early in the development cycle, reducing the likelihood of failures in production.
Leverage CI/CD pipelines for automated integration and deployment of code changes, streamlining the delivery process for more frequent and reliable software updates.
Establishing a robust monitoring system that detects issues in real time during the deployment lifecycle is crucial. Continuous monitoring provides immediate feedback on the performance and stability of applications, enabling teams to promptly identify and address potential problems.
Implement mechanisms to proactively alert relevant teams of anomalies or failures in the deployment pipeline. Swift response to such notifications can help minimize the potential impact on end-users.
Foster collaboration between development and operations teams through DevOps practices. Encourage cross-functional communication and shared responsibilities to create a unified software development and deployment approach.
Efficient communication channels & tools facilitate seamless collaboration, ensuring alignment & addressing challenges.
Create feedback loops in development. Collect feedback from the team, and users, and monitor tools for improvement.
It's important to have regular retrospectives to reflect on past deployments, gather insights, and refine deployment processes based on feedback. Strive for continuous improvement.
Empower the software development team with tools, training, and a culture of continuous improvement. Encourage a blame-free environment that promotes learning from failures. By enabling the team to actively monitor and improve the team's change failure rate, organizations can better assess deployment flaws, operational risks, and financial impacts. CFR is one of the key metrics and critical performance metrics of DevOps maturity. Understanding its implications and implementing strategic optimizations is a great way to enhance deployment processes, ensuring system reliability and contributing to business success.
Typo provides an all-inclusive solution if you’re looking for ways to enhance your team’s productivity, streamline their work processes, and build high-quality software for end-users. For a modern LinearB alternative, consider Typo.

Understanding and optimizing key metrics is crucial in the dynamic landscape of software development. One such metric, Lead Time for Changes, is a pivotal factor in the DevOps world. DORA (DevOps Research and Assessment) identifies four key metrics—deployment frequency, lead time for changes, change failure rate, and time to restore service—as essential for measuring software delivery performance. Let’s delve into what this metric entails and its significance in the context of DORA (DevOps Research and Assessment) metrics.
Lead Time for Changes is a critical metric used to measure the efficiency and speed of software delivery. Specifically, it measures the time from a change request or code commit to its successful deployment to end-users in production.
The measurement of this metric offers valuable insights into the effectiveness of development processes, deployment pipelines, and release strategies. By analyzing the Change lead time, development teams can identify bottlenecks in the delivery pipeline and streamline their workflows to improve software delivery’s overall speed and efficiency. To accurately measure lead time for changes, it is necessary to collect data from development tools such as GitHub or GitLab, ensuring all relevant events are captured for analysis. Therefore, it is crucial to track and optimize this metric.
This metric is a good indicator of the team’s capacity, code complexity, and efficiency of the software development process. It is correlated with both the speed and quality of the engineering team, which further impacts cycle time.
Lead time for changes measures the time that passes from the first commit to the eventual deployment of code.
.jpg)
To measure lead time for changes, follow the following steps:
To measure this metric, DevOps should have:
Divide the total sum of time spent from commitment to deployment by the number of commitments made. Suppose, the total amount of time spent on a project is 48 hours. The total number of commits made during that time is 20. This means that the lead time for changes would be 2.4 hours. In other words, an average of 2.4 hours are required for a team to make changes and progress until deployment time. Some organizations use the median lead time instead of the average to better represent typical deployment durations.
A shorter lead time means more efficient a DevOps team is in deploying code, differentiating elite performers from low performers.
Longer lead times can signify the testing process is obstructing the CI/CD pipeline. It can also limit the business’s ability to deliver value to the end users. Hence, install more automated deployment and review processes. It further divides production and features into much more manageable units.
With Typo, you can improve dev efficiency with an inbuilt DORA metrics dashboard.
Picture your software development team tasked with a critical security patch. Measuring change lead time, specifically production lead time, helps pinpoint the duration from code commit to deployment in the production environment. If it goes for a long run, bottlenecks in your CI/CD pipelines or testing processes might surface. In many teams, or when multiple teams are involved in the process, these bottlenecks can contribute to delays and increased lead time. Streamlining these areas ensures rapid responses to urgent tasks.
Teams with rapid deployment frequency and short lead time exhibit agile development practices. These efficient processes lead to quick feature releases and bug fixes, ensuring dynamic software development aligned with market demands and ultimately enhancing customer satisfaction.
A short lead time coupled with infrequent deployments signals potential bottlenecks. Identifying these bottlenecks is vital. Streamlining deployment processes in line with development speed is essential for a software development process.
The size of a pull request (PR) profoundly influences overall lead time. Large PRs require more review time hence delaying the process of code review adding to the overall lead time (longer lead times). Dividing large tasks into manageable portions accelerates deployments, and reduces deployment time addressing potential bottlenecks effectively.
At its core, a mean lead time for Changes of the entire development process reflects its agility. It encapsulates the entire journey of a code change, from conception to production, offering insights into workflow efficiency and identifying potential bottlenecks.
Agility is a crucial aspect of software development that enables organizations to keep up with the ever-evolving landscape. It is the ability to respond swiftly and effectively to changes while maintaining a balance between speed and stability in the development life cycle. Agility can be achieved by implementing flexible processes, continuous integration and continuous delivery, automated testing, and other modern development practices that enable software development teams to pivot and adapt to changing business requirements quickly.
Organizations that prioritize agility are better equipped to handle unexpected challenges, stay ahead of competitors, and deliver high-quality software products that meet the needs of their customers.
The development pipeline has several stages: code initiation, development, testing, quality assurance, and final deployment. Each stage is critical for project success and requires attention to detail and coordination. Code initiation involves planning and defining the project.
Development involves coding, testing, and collaboration. Testing evaluates the software, while quality assurance ensures it's bug-free. Final deployment releases the software. This pipeline provides a comprehensive view of the process for thorough analysis.
Measuring the duration of each stage of development is a critical aspect of workflow analysis. Quantifying the time taken by each stage makes it possible to identify areas where improvements can be made to streamline processes and reduce unnecessary delays.
This approach offers a quantitative measure of the efficiency of each workflow, highlighting areas that require attention and improvement. By tracking the time taken at each stage, it is possible to identify bottlenecks and other inefficiencies that may be affecting the overall performance of the workflow. This information can then be used to develop strategies for improving workflow efficiency, reducing costs, and improving the final product or service quality.
It can diagnose and identify specific stages or processes causing system delays. It helps devops teams to proactively address bottlenecks by providing detailed insights into the root causes of delays. By identifying these bottlenecks, teams can take corrective action to enhance overall efficiency and reduce lead time.
It is particularly useful in complex systems where delays may occur at multiple stages, and pinpointing the exact cause of a delay can be challenging. With this tool, teams can quickly and accurately identify the source of the bottleneck and take corrective action to improve the system's overall performance.
The importance of Lead Time for Changes cannot be overstated. It directly correlates with an organization’s performance, influencing deployment frequency and the overall software delivery performance. Tracking this metric helps improve organizational performance by identifying areas for process improvement and efficiency gains. A shorter lead time enhances adaptability, customer satisfaction, and competitive edge.
Short lead times have a significant impact on an organization's performance. They allow organizations to respond quickly to changing market conditions and customer demands, improving time-to-market, customer satisfaction, and operational efficiency.
Low lead times in software development allow high deployment frequency, enabling rapid response to market demands and improving the organization's ability to release updates, features, and bug fixes. This helps companies stay ahead of competitors, adapt to changing market conditions, and reduce the risks associated with longer development cycles.
High velocity is essential for the software delivery performance. By streamlining the process, improving collaboration, and removing bottlenecks, new features and improvements can be delivered quickly, resulting in better user experience and increased customer satisfaction. A high delivery velocity is essential for remaining competitive.
Shorter lead times have a significant impact on organizational adaptability and customer satisfaction. When lead times are reduced, businesses can respond more quickly to changes in the market, customer demands, and internal operations. This increased agility allows companies to make adjustments faster and with less risk, improving customer satisfaction.
Additionally, shorter lead times can lower inventory costs and improve cash flow, as businesses can more accurately forecast demand and adjust their production and supply chain accordingly. Overall, shorter lead times are a key factor in building a more efficient and adaptable organization.
To stay competitive, businesses must minimize lead time. This means streamlining software development, optimizing workflows, and leveraging automation tools to deliver products faster, cut costs, increase customer satisfaction, and improve the bottom line.
Change Failure Rate stands as a pivotal DORA metric that meticulously tracks the percentage of deployments that trigger service outages or demand immediate remediation actions, including urgent hotfixes or complete rollbacks. Monitoring this critical metric in conjunction with Lead Time for Changes creates an essential balance that organizations must master to sustain harmony between accelerated software delivery and the unwavering reliability of production environments. While streamlining lead times can dramatically enhance the velocity of software delivery processes, maintaining this acceleration without compromising quality or stability becomes paramount to sustainable development success.
Elevated Change Failure Rate levels frequently indicate deeper systemic challenges embedded within your development and deployment workflows. These underlying issues encompass inadequate automated testing coverage, insufficient code review protocols, or pressured review timelines that collectively enable code changes to introduce critical defects directly into production systems. Such deployment failures create cascading effects that not only disrupt the entire delivery pipeline but systematically erode customer confidence and substantially diminish overall business value across the organization.
Organizations can employ various strategies to optimize Lead Time for Changes. These may include streamlining development workflows, adopting automation, and fostering a culture of continuous improvement.
The process of development optimization involves analyzing each stage of the development process to identify and eliminate any unnecessary steps and delays. The ultimate goal is to streamline the process and reduce the time it takes to complete a project. This approach emphasizes the importance of having a well-defined and efficient workflow, which can improve productivity, increase efficiency, and reduce the risk of errors or mistakes. By taking a strategic and proactive approach to development optimization, businesses can improve their bottom line by delivering projects more quickly and effectively while also improving customer satisfaction and overall quality.
Automation tools play a crucial role in streamlining workflows, especially when it comes to handling repetitive and time-consuming tasks. With the help of automation tools, businesses can significantly reduce manual intervention, minimize the likelihood of errors, and speed up their development cycle.
By automating routine tasks such as data entry, report generation, and quality assurance, employees can focus on more strategic and high-value activities, leading to increased productivity and efficiency. Moreover, automation tools can be customized to fit the specific needs of a business or a project, providing a tailored solution to optimize workflows.
Regular assessment and enhancement of development processes are crucial for maintaining high-performance levels. This promotes continual learning and adaptation to industry best practices, ensuring software development teams stay up-to-date with the latest technologies and methodologies. By embracing a culture of continuous improvement, organizations can enhance efficiency, productivity, and competitive edge.
Regular assessments and faster feedback allow teams to identify and address inefficiencies, reduce lead time for changes, and improve software quality. This approach enables organizations to stay ahead by adapting to changing market conditions, customer demands, and technological advancements.
Lead Time for Changes is a critical metric within the DORA framework. Its efficient management directly impacts an organization's competitiveness and ability to meet market demands. Embracing optimization strategies ensures a speedier software delivery process and a more resilient and responsive development ecosystem.
We have a comprehensive solution if you want to increase your development team's productivity and efficiency.

In today’s fast-paced software development industry, measuring and enhancing the efficiency of development processes is becoming increasingly important. The DORA Metrics framework has gained significant attention, and one of its essential components is Development Frequency. Deployment frequency metrics, a key DORA metric, measure how often an organization successfully releases to production and serve as an indicator of development agility and system health. Engineering metrics, such as deployment frequency, lead time for changes, and change failure rate, play a crucial role in tracking software delivery performance and improving overall team efficiency. Deployment frequency is often considered a proxy for the batch size in production, where more frequent deployments mean smaller, less risky changes. This blog post aims to comprehensively understand this metric by delving into its significance, impact on the organization’s performance, and deployment optimization strategies.
In the world of DevOps, the Deployment Frequency metric reigns supreme. It measures the frequency of code deployment to production and reflects an organization’s efficiency, reliability, and software delivery quality. By achieving an optimal balance between speed and stability, organizations can achieve agility, efficiency, and a competitive edge. Deployment frequency is important because it reduces deployment risks, facilitates faster feedback, and accelerates delivering value and improvements to the product. Large successful tech companies, such as Amazon and Airbnb, are known for deploying multiple times per day, demonstrating the effectiveness of high deployment frequency in rapid development cycles and increased ROI. But Development Frequency is more than just a metric; it’s a catalyst for continuous delivery and iterative development practices that align seamlessly with the principles of DevOps. It helps organizations maintain a balance between speed and stability, which is a recurring challenge in software development. Average organizations waste significant time due to technical debt, making it essential to properly maintain code and systems by reducing technical debt and refactoring code to enable frequent deployments and enhance overall efficiency. When organizations achieve a high Development Frequency, they can enjoy rapid releases without compromising the software’s robustness. High-performing teams can deploy multiple times a day, while lower-performing teams may deploy only once every six months. This can be a powerful driver of agility and efficiency, making it an essential component of software development.
Deployment frequency refers to how often an organization successfully deploys code changes to its production environment. This metric is a cornerstone of modern software development, as it directly reflects a team’s ability to deliver new features, bug fixes, and improvements to users quickly and reliably. Deployment frequency measures the entire process of moving code from a developer’s machine through testing and integration, all the way to the production environment. Deployment frequency is also a proxy for the batch size in production—smaller, more frequent deployments reduce cycle times and variability in flow. By measuring deployment frequency, organizations gain valuable insights into the efficiency of their deployment process and the overall health of their software delivery performance. Tracking deployment frequency helps teams identify bottlenecks, streamline workflows, and ensure that the organization successfully deploys code in a way that maximizes value to end users. Analyzing existing systems can reveal process or tooling issues that impact deployment frequency and highlight areas for improvement. Ultimately, a higher deployment frequency signals a mature software delivery process, where tracking the team's deployment frequency over time shows how code changes move smoothly from development to production, boosting both delivery performance and developer productivity.
Deployment frequency is often used to track the rate of change in software development and to highlight potential areas for improvement. Deployment frequency measures how often an organization successfully releases code to production. When calculating this metric, only successful deployments should be counted to ensure accuracy and reliability. It is important to measure Deployment Frequency for the following reasons:
Deployment Frequency is measured by dividing the number of deployments made during a given period by the total number of weeks/days. For example: If a team deployed 6 times in the first week, 7 in the second week, 4 in the third week, and 7 in the fourth week. Then, the deployment frequency is 6 per week. Organizations can compare their deployment speed over an extended period to understand their company's velocity and growth.
A good deployment frequency often means multiple deployments per week or even daily, but the optimal level varies depending on the team’s context, project type, and industry benchmarks. More frequent deployments, which involve releasing smaller, incremental changes, help reduce risk and improve overall delivery flow.
One deployment per week is standard. However, it also depends on the type of product.
Teams that fall under the low performers category have a low deployment frequency, typically releasing once a month to once every six months. This is often caused by lack of automation, poor communication, staffing issues, overly complex deployment routes, or large code changes that slow down deployments. Such teams can install more automated processes, such as for testing and validating new code and minimizing the time span between error recovery time and delivery, to improve deployment frequency. Strategies like automation, continuous integration/continuous delivery (CI/CD), test-driven development (TDD), and feature flags are effective ways to improve deployment frequency. Feature flags, in particular, allow for more frequent deployments by decoupling code deployment from feature release.
Note that this is the first key metric. If the team takes the wrong approach in the first step, it can lead to the degradation of other DORA metrics as well. Lead time for changes is another key DORA metric closely related to deployment frequency, reflecting the speed and efficiency of delivering code from commit to production.
With Typo, you can improve dev efficiency with DORA metrics.

There are various ways to calculate Deployment Frequency. These include :
Many teams use a pipeline tool such as Jenkins or GitLab CI to automate and track each deployment job. Automating deployment operations with these tools not only streamlines the software deployment process but also improves deployment speed and reduces errors. These tools can record when a deployment job successfully completes, providing accurate data for measuring deployment frequency. In addition, engineering operations play a key role in monitoring and improving deployment practices, ensuring that deployment frequency and related metrics are consistently optimized.
One of the easiest ways to calculate Deployment Frequency is by counting the number of code changes that are successfully deployed to production in a given time period. Only successfully deployed changes should be counted, as this provides a more accurate measure of how often new code reaches users. This can be done either by manually counting the number of successful deployments or by using a tool to calculate deployments such as a version control system or deployment pipeline.
Deployment Frequency can also be calculated by measuring the time it takes for code changes to be deployed in production. It can be done in two ways:
Deployment speed is a key indicator of team performance and delivery effectiveness, as it reflects how quickly and frequently organizations can deliver software updates.
The deployment rate can be measured by the number of deployments per unit of time including deployments per day or per week. This can be dependent on the rhythm of your development and release cycles. Tracking the team's deployment frequency is important for identifying trends and opportunities for improvement.
More frequent deployments enable faster feedback and reduce risk by allowing smaller, incremental changes to be released continuously.
Another way of measuring Deployment Frequency is by counting the number of A/B tests launched during a given time period.
Deployment processes and frequency are fundamental to achieving high software delivery performance in any organization. The deployment process encompasses every step required to move code from a developer’s local environment to the production environment, including building, testing, and releasing software. A streamlined deployment process, supported by robust CI/CD pipelines, ensures that code changes are delivered quickly, safely, and consistently.
Deployment frequency measures how often these deployments occur, serving as a key indicator of a team’s agility and ability to deliver value to users. High deployment frequency is often a sign that the development team has implemented effective continuous integration and continuous delivery practices, automated testing, and a culture of continuous improvement. By focusing on optimizing both the deployment process and deployment frequency, organizations can reduce the risks associated with large, infrequent releases, respond faster to market changes, and improve overall software delivery performance. Investing in automation, refining CI/CD pipelines, and fostering a mindset of continuous improvement are essential steps for any team aiming to excel in today’s fast-paced software development landscape.
Continuous delivery is a cornerstone of modern software development, enabling teams to release new features and updates to users rapidly and reliably. At the heart of continuous delivery are deployment frequency metrics, which help organizations measure how often they successfully deploy code changes to production. To effectively measure deployment frequency, teams can track the number of deployments over a specific period, monitor lead time for changes, and assess failed deployment recovery time. These metrics provide valuable insights into the efficiency and reliability of the deployment process.
Automated testing and continuous integration are critical enablers of higher deployment frequency, as they ensure that code changes are thoroughly validated before reaching production. By implementing these practices, teams can reduce manual errors, accelerate feedback loops, and confidently increase the number of deployments. Regularly tracking deployment frequency metrics allows organizations to identify bottlenecks, optimize delivery practices, and drive continuous improvement in their software development process. Ultimately, focusing on these metrics empowers teams to deliver value to users more frequently and with greater confidence.
DORA metrics have become the industry standard for measuring software delivery performance, providing organizations with a clear framework for continuous improvement. Deployment frequency is one of the four key DORA metrics, reflecting how often an organization successfully deploys code to production. The other DORA metrics—lead time for changes, change failure rate, and mean time to recovery (MTTR)—complement deployment frequency by offering a holistic view of the software delivery process.
A higher deployment frequency is often associated with shorter lead times for changes and improved delivery performance, characteristics commonly found in high performing teams. By tracking deployment frequency alongside the other DORA metrics, organizations can pinpoint strengths and weaknesses in their software delivery pipeline, make informed decisions, and implement targeted improvements. This data-driven approach enables teams to increase their deployment frequency, reduce risk, and achieve elite levels of software delivery performance. Embracing DORA metrics is essential for any organization aiming to successfully deploy code at scale and maintain a competitive edge in the software industry.
Deployment frequency is a key indicator of the effectiveness of a team’s Continuous Integration and Continuous Deployment (CI/CD) pipeline. In a well-implemented CI/CD environment, code changes are automatically built, tested, and deployed, allowing for rapid and reliable releases. Implementing continuous integration is essential, as it automates code integration and testing, reducing errors and serving as a foundation for improving deployment frequency. A high deployment frequency demonstrates that automated testing, continuous integration, and continuous delivery practices are working as intended, enabling teams to deliver software updates to production quickly and with confidence. By closely monitoring deployment frequency, teams can spot inefficiencies or delays in their CI/CD pipeline, address issues proactively, and continuously refine their delivery practices. Robust monitoring—through comprehensive observability practices like logging, metrics collection, and distributed tracing—plays a crucial role in ensuring reliable and frequent deployments. This focus on frequent, reliable deployments ensures that software delivery remains agile, responsive, and aligned with business goals. Higher deployment frequency typically correlates with shorter lead times and lower change failure rates.
Achieving a balance between fast software releases and maintaining a stable software environment is a subtle skill. It requires a thorough understanding of trade-offs and informed decision-making to optimize both. Development Frequency enables organizations to achieve faster release cycles, allowing them to respond promptly to market demands, while ensuring the reliability and integrity of their software.
Frequent software development plays a crucial role in reducing lead time and allows organizations to respond quickly to market dynamics and customer feedback. The ability to frequently deploy software enhances an organization's adaptability to market demands and ensures swift responses to valuable customer feedback.
Development Frequency cultivates a culture of constant improvement by following iterative software development practices. Accepting change as a standard practice rather than an exception is encouraged. Frequent releases enable quicker feedback loops, promoting a culture of learning and adaptation. Detecting and addressing issues at an early stage and implementing effective iterations become an integral part of the development process.
Frequent software development is directly linked to improved business agility. This means that organizations that develop and deploy software more often are better equipped to respond quickly to changes in the market and stay ahead of the competition.
With frequent deployments, organizations can adapt and meet the needs of their customers with ease, while also taking advantage of new opportunities as they arise. This adaptability is crucial in today's fast-paced business environment, and it can help companies stay competitive and successful.
High Development Frequency does not compromise software quality. Instead, it often leads to improved quality by dispelling misconceptions associated with infrequent deployments. Emphasizing the role of Continuous Integration, Continuous Deployment (CI/CD), automated testing, and regular releases elevates software quality standards.
Deployment frequency has a profound effect on developer productivity. Automation and streamlined deployment processes help reduce errors and bugs, resulting in fewer broken services during deployment. When teams achieve frequent deployments, developers receive immediate feedback on their code changes, allowing them to identify and resolve issues quickly. This rapid feedback loop reduces the time spent on debugging and troubleshooting, freeing up developers to focus on building new features and enhancing the product. Automated testing and continuous integration further support high deployment frequency by minimizing manual testing and repetitive tasks, enabling developers to concentrate on higher-value work. As a result, improving deployment frequency not only accelerates software delivery performance but also increases job satisfaction and overall productivity within the development team.
Having a robust automation process, especially through Continuous Integration/Continuous Delivery (CI/CD) pipelines, is a critical factor in optimizing Development Frequency. This process helps streamline workflows, minimize manual errors, and accelerate release cycles. CI/CD pipelines are the backbone of software development as they automate workflows and enhance the overall efficiency and reliability of the software delivery pipeline.
Microservices architecture promotes modularity by design. This architectural choice facilitates independent deployment of services and aligns seamlessly with the principles of high development frequency. The modular nature of microservices architecture enables individual component releases, ensuring alignment with the goal of achieving high development frequency.
Efficient feedback loops are essential for the success of Development Frequency. They enable rapid identification of issues, enabling timely resolutions. Comprehensive monitoring practices are critical for identifying and resolving issues. They significantly contribute to maintaining a stable and reliable development environment.
Optimizing deployment frequency requires the right set of tools to automate and streamline the deployment process. Automated testing frameworks, continuous integration servers, and deployment automation tools play a crucial role in reducing manual errors and accelerating software delivery. Popular tools such as Jenkins, GitLab CI/CD, CircleCI, and GitHub Actions empower teams to implement robust CI/CD pipelines, ensuring that code changes are tested and deployed efficiently. By leveraging these automation tools, organizations can enhance their deployment frequency, minimize the risk of failed deployments, and achieve higher software delivery performance. Investing in the right tooling is essential for any team aiming to deliver value to users quickly and reliably.
To achieve and sustain a high deployment frequency, teams should adopt best practices that support a streamlined and reliable deployment process. Implementing continuous integration and continuous delivery ensures that code changes are automatically built, tested, and deployed, reducing manual intervention and the risk of errors. Automating testing and deployment further accelerates the process and improves consistency. Regularly monitoring deployment frequency helps teams identify trends and areas for improvement. Tracking engineering metrics such as deployment frequency, lead time for changes, and change failure rate provides valuable insights to support continuous improvement. Reducing technical debt and maintaining high code quality ensures that deployments remain smooth and predictable. It is also important to properly maintain code and systems by refactoring and addressing technical debt, which facilitates frequent deployments and enhances overall efficiency. Fostering collaboration between developers, QA, and operations teams is also vital for addressing challenges and driving continuous improvement. By following these best practices, organizations can increase their deployment frequency, enhance software delivery performance, and stay ahead in a competitive market.
Development Frequency is not just any metric; it’s the key to unlocking efficient and agile DevOps practices. A high-performing engineering team is essential for achieving frequent and reliable deployments, enabling faster feedback loops and improved responsiveness. Effective engineering operations play a crucial role in monitoring and improving technical processes, such as deployment frequency, to enhance overall software delivery performance. High performing teams are able to deploy multiple times per day, setting the standard for DevOps excellence and operational efficiency. By optimizing your development frequency, you can create a culture of continuous learning and adaptation that will propel your organization forward. With each deployment, iteration, and lesson learned, you’ll be one step closer to a future where DevOps is a seamless, efficient, and continuously evolving practice. Embrace the frequency, tackle the challenges head-on, and chart a course toward a brighter future for your organization. Organizations can achieve significant improvements in deployment frequency by adopting best practices and fostering a culture of continuous improvement.
If you are looking for more ways to accelerate your dev team’s productivity and efficiency, we have a comprehensive solution for you.

Key Performance Indicators (KPIs) are the informing factors and draw paths for teams in the dynamic world of software development, where growth depends on informed decisions and concentrated efforts. In this in-depth post, we explore the fundamental relevance of software development KPIs and how to recognize, pick, and effectively use them.
Key performance indicators are the compass that software development teams use to direct their efforts with purpose, enhance team productivity, measure their progress, identify areas for improvement, and ultimately plot their route to successful outcomes. Software development metrics while KPIs add context and depth by highlighting the measures that align with business goals.
Using key performance indicators is beneficial for both team members and organizations. Below are some of the benefits of KPIs:
Key performance indicator such as cycle time helps in optimizing continuous delivery processes. It further assists in streamlining development, testing, and deployment workflows. Hence, resulting in quicker and more reliable feature releases.
KPIs also highlight resource utilization patterns. Engineering leaders can identify if team members are overutilized or underutilized. This helps in allowing for better resource allocation to avoid burnout and to balance the workloads.
KPIs assist in prioritizing new features effectively. Through these, software engineers and developers can identify which features contribute the most to key objectives.
In software development, KPIs and software metrics serve as vital tools for software developers and engineering leaders to keep track of their processes and outcomes.
It is crucial to distinguish software metrics from KPIs. While KPIs are the refined insights drawn from the data and polished to coincide with the broader objectives of a business, metrics are the raw, unprocessed information. Tracking the number of lines of code (LOC) produced, for example, is only a metric; raising it to the status of a KPI for software development teams falls short of understanding the underlying nature of progress.
Selecting the right KPIs requires careful consideration. It's not just about analyzing data, but also about focusing your team's efforts and aligning with your company's objectives.
Choosing KPIs must be strategic, intentional, and shaped by software development fundamentals. Here is a helpful road map to help you find your way:
Collaboration is at the core of software development. KPIs should highlight team efficiency as a whole rather than individual output. The symphony, not the solo, makes a work of art.
Let quality come first. The dimensions of excellence should be explored in KPIs. Consider measurements that reflect customer happiness or assess the efficacy of non-production testing rather than just adding up numbers.
Introspectively determine your key development processes before choosing KPIs. Let the KPIs reflect these crucial procedures, making them valuable indications rather than meaningless measurements.
Mindlessly copying KPIs may be dangerous, even if learning from others is instructive. Create KPIs specific to your team's culture, goals, and desired trajectory.
Team agreement is necessary for the implementation of KPIs. The KPIs should reflect the team's priorities and goals and allow the team to own its course. It also helps in increasing team morale and productivity.
To make a significant effect, start small. Instead of overloading your staff with a comprehensive set of KPIs, start with a narrow cluster and progressively add more as you gain more knowledge.
These nine software development KPIs go beyond simple measurements and provide helpful information to advance your development efforts.
The induction period for new members is crucial in the fire of collaboration. Calculate how long it takes a beginner to develop into a valuable contributor. A shorter induction period and an effective learning curve indicate a faster production infusion. Swift integration increases team satisfaction and general effectiveness, highlighting the need for a well-rounded onboarding procedure.
Effective onboarding may increase employee retention by 82%, per a Glassdoor survey. A new team member is more likely to feel appreciated and engaged when integrated swiftly and smoothly, increasing productivity.
Strong quality assurance is necessary for effective software. Hence, testing efficiency is a crucial KPI. Merge metrics for testing branch coverage, non-production bugs, and production bugs. The objective is to develop robust testing procedures that eliminate manufacturing flaws, Improve software quality, optimize procedures, spot bottlenecks, and avoid problems after deployment by evaluating the effectiveness of pre-launch evaluations.
A Consortium for IT Software Quality (CISQ) survey estimates that software flaws cost the American economy $2.84 trillion yearly. Effective testing immediately influences software quality by assisting in defect mitigation and lowering the cost impact of software failures.
The core of efficient development is beyond simple code production; it is an art that takes the form of little rework, impactful code modifications, and minimal code churn. Calculate the effectiveness of code modifications and strive to produce work beyond output and representing impact. This KPI celebrates superior coding and highlights the inherent worth of pragmatistically considerate coding.
In 2020, the US incurred a staggering cost of approximately $607 billion due to software bugs, as reported by Herb Kranser in "The Cost of Poor Software Quality in the US. Effective development immediately contributes to cost reduction and increased software quality, as seen by less rework, effective coding, and reduced code churn.
The user experience is at the center of software development. It is crucial for quality software products, engineering teams, and project managers. With surgical accuracy, assess user happiness. Metrics include feedback surveys, use statistics, and the venerable Net Promoter Score (NPS). These measurements combine to reveal your product's resonance with its target market. By decoding user happiness, you can infuse your development process with meaning and ensure alignment with user demands and corporate goals. These KPIs can also help in improving customer retention rates.
According to a PwC research, 73% of consumers said that the customer experience heavily influences their buying decisions. The success of your software on the market is significantly impacted by how well you can evaluate user happiness using KPIs like NPS.
Cycle time is the main character in the complex ballet that is development. Describe the process from conception to deployment in production. The tangled paths of planning, designing, coding, testing, and delivery are traversed by this KPI. Spotting bottlenecks facilitates process improvement, and encouraging agility allows accelerated results.Cycle time reflects efficiency and is essential for achieving lean and effective operations. In line with agile principles, cycle time optimization enables teams to adapt more quickly to market demands and provide value more often.
Although no program is impervious to flaws, stability and observability are crucial. Watch the Mean Time To Detect (MTTD), Mean Time To Recover (MTTR), and Change Failure Rate (CFR). This trio (the key areas of DORA metrics) faces the consequences of manufacturing flaws head-on. Maintain stability and speed up recovery by improving defect identification and action. This KPI protects against disruptive errors while fostering operational excellence.
Increased deployment frequency and reduced failure rates are closely correlated with focusing on production stability and observability in agile software development.
A team's happiness and well-being are the cornerstones of long-term success. Finding a balance between meeting times and effective work time prevents fatigue. A happy, motivated staff enables innovation. Prioritizing team well-being and happiness in the post-pandemic environment is not simply a strategy; it is essential for excellence in sustainable development.
Happy employees are also 20% more productive! Therefore, monitoring team well-being and satisfaction using KPIs like the meeting-to-work time ratio ensures your workplace is friendly and productive.
The software leaves a lasting impact that transcends humans. Thorough documentation prevents knowledge silos. To make transitions easier, measure the coverage of the code and design documentation. Each piece of code that is thoroughly documented is an investment in continuity. Protecting collective wisdom supports unbroken development in the face of team volatility as the industry thrives on evolution.
Teams who prioritize documentation and knowledge sharing have 71% quicker issue resolution times, according to an Atlassian survey. Knowledge transfer is facilitated, team changes are minimized, and overall development productivity is increased through effective documentation KPIs.
Software that works well is the result of careful preparation. Analyze the division of work, predictability, and WIP count—prudent task segmentation results in a well-structured project. Predictability measures commitment fulfillment and provides information for ongoing development. To speed up the development process and foster an efficient, focused development journey, strive for optimum WIP management.
According to Project Management Institute (PMI) research, 89% of projects are completed under budget and on schedule by high-performing firms. Predictability and WIP count are task planning KPIs that provide unambiguous execution routes, effective resource allocation, and on-time completion, all contributing to project success.
Implementing these key performance indicators is important for aligning developers' efforts with strategic objectives and improving the software delivery process.
Understand the strategic goals of your organization or project. It can include purposes related to product quality, time to market, customer satisfaction, or revenue growth.
Choose KPIs that are directly aligned with your strategic goals. Such as for code quality: code coverage or defect density can be the right KPI. For team health and adaptability, consider metrics like sprint burndown or change failure rate.
Track progress by continuously monitoring software engineering KPIs such as sprint burndown and team velocity. Regularly analyze the data to identify trends, patterns, and blind spots.
Share KPIs results and progress with your development team. Transparency results in accountability. Hence, ensuring everyone is aligned with the business objectives as well as aware of the goal setting.
These 9 KPIs are essential for software development. They give insight into every aspect of the process and help teams grow strategically, amplify quality, and innovate for the user. Remember that each indicator has significance beyond just numbers. With these KPIs, you can guide your team towards progress and overcome obstacles. You have the compass of software expertise at your disposal.
By successfully incorporating these KPIs into your software development process, you may build a strong foundation for improving code quality, increasing efficiency, and coordinating your team's efforts with overall business objectives. These strategic indicators remain constant while the software landscape changes, exposing your route to long-term success.

Agile has transformed the way companies work. It reduces the time to deliver value to end-users and lowers the cost. In other words, Agile methodology helps ramp up the developers teams’ efficiency.
But to get the full benefits of agile methodology, teams need to rely on agile metrics. They are realistic and get you a data-based overview of progress. They help in measuring the success of the team.
Let’s dive deeper into Agile metrics and a few of the best-known metrics for your team:
Agile metrics can also be called Agile KPIs. These are the metrics that you use to measure the work of your team across SDLC phases. It helps identify the process's strengths and expose issues, if any, in the early stages.Besides this, Agile metrics help cover different aspects including productivity, quality, and team health.
A few benefits of Agile metrics are:
With the help of agile project metrics, development teams can identify areas for improvement, track progress, and make informed decisions. This enhances efficiency which further increases team productivity.
Agile performance metrics provide quantifiable data on various aspects of work. This creates a shared understanding among team members, stakeholders, and leadership. Hence, contributing to a more accountable and transparent development environment.
These meaningful metrics provide valuable insights into various aspects of the team's performance, processes, and outcomes. This makes it easy to assess progress and address blind spots. Therefore, fostering a culture that values learning, adaption, and ongoing improvement.
Agile metrics including burndown chart, escaped defect rate, and cycle time provide software development teams with data necessary to optimize the development process and streamline workflow. This enables teams to prioritize effectively. Hence, ensuring delivered features meet user needs and improve customer satisfaction.
Wanna Setup Agile Metrics for your Team?
This metric focuses on workflow, organizing and prioritizing work, and the amount of time invested to obtain results. It uses visual cues for tracking progress over time.
Scrum metrics focus on the predictable delivery of working software to customers. It analyzes sprint effectiveness and highlights the amount of work completed during a given sprint.
This metric focuses on productivity and quality of work output, flow efficiency, and eliminating wasteful activities. It helps in identifying blind spots and tracking progress toward lean goals.
Below are a few powerful agile metrics you should know about:
Lead time metric measures the total time elapsed from the initial request being made till the final product is delivered. In other words, it measures the entire agile system from start to end. The lower the lead time, the more efficient the entire development pipeline is.
Lead time helps keep the backlog lean and clean. This metric removes any guesswork and predicts when it will start generating value. Besides this, it helps in developing a business requirement and fixing bugs.
This popular metric measures how long it takes to complete tasks. Less cycle time ensures more tasks are completed. When the cycle time exceeds a sprint, it signifies that the team is not completing work as it is supposed to. This metric is a subset of lead time.
Moreover, cycle time focuses on individual tasks. Hence, a good indicator of the team’s performance and raises red flags, if any in the early stages.
Cycle time makes project management much easier and helps in detecting issues when they arise.
This agile metric indicates the average amount of work completed in a given time, typically a sprint. It can be measured with hours or story points. As it is a result metric, it helps measure the value delivered to customers in a series of sprints. Velocity predicts future milestones and helps in estimating a realistic rate of progress.
The higher the team’s velocity, the more efficient teams are at developing processes.
Although, the downside of this metric is that it can be easily manipulated by teams when they have to satisfy velocity goals.
The sprint burndown chart helps in knowing how many story points have been completed and are remaining during the sprint. The output is measured in terms of hours, story points, or backlogs which allows you to assess your performance against the set parameters. As Sprint is time-bound, it is important to measure it frequently.
The most common ones include time (X-axis) and task (Y-axis).Sprint Burndown aims to get all forecasted work completed by the end of the sprint.

This metric demonstrates how many work items you currently have ‘in progress’ in your working process. It is an important metric that helps keep the team focused and ensures a continuous work flow. Unfinished work can result in sunk costs.
An increase in work in progress implies that the team is overcommitted and not using their time efficiently. Whereas, the decrease in work in progress states that the work is flowing through the system quickly and the team can complete tasks with few blockers.
Moreover, limited work in progress also has a positive effect on cycle time.
This is another agile metric that measures the number of tasks delivered per sprint. It can also be known as measuring story points per iteration. It represents the team’s productivity level. Throughput can be measured quarterly, monthly, weekly, per release, per iteration, and in many other ways.
It allows you in checking the consistency level of the team and identify how much software can be completed within a given period. Besides this, it can also help in understanding the effect of workflow on business performance.
But, the drawback of this metric is that it doesn’t show the starting points of tasks.
This agile metric tracks the coding process and measures how much of the source code is tested. It helps in giving a good perspective on the quality of the product and reflects the raw percentage of code coverage. It is measured by a number of methods, statements, conditions, and branches that comprise your unit testing suite.
When the code coverage is lower, it implies that the code hasn’t been thoroughly tested. It can further result in low quality and a high risk of errors. But, the downside of this metric is that it excludes other types of testing. Hence, higher code statistics may not always imply excellent quality.

This key metric reveals the quality of the products delivered and identifies the number of bugs discovered after the release enters production. Escape defects include changes, edits, and unfixed bugs.
It is a critical metric as it helps in identifying the loopholes and technical debt in the process. Hence, improving the production process.
Ideally, escape defects should be minimized to zero. As if the bugs are detected after release, it can result in cause immense damage to the product.
Cumulative flow diagram visualizes the team’s entire workflow. Color coding helps in showing the status of the tasks and quickly identify the obstacles in agile processes. For example, grey color represents the agile project scope, green shows completed tasks and other colored items represent the particular status of the tasks.
X-axis represents the time frame while Y-axis includes several tasks within the project.
This key metric help find bottlenecks and address them by making adjustments and improving the workflow.
One of the most overlooked metrics is the Happiness metric. It indicates how the team feels about their work. The happiness metric evaluates the team’s satisfaction and morale through a ranking on a scale. It is usually done through direct interviews or team surveys.The outcome helps in knowing whether the current work environment, team culture, and tools are satisfactory. It also lets you identify areas of improvement in practices and processes.
When the happiness metric is low yet other metrics show a positive result, it probably means that the team is burned out. It can negatively impact their morale and productivity in the long run.
We have mentioned the optimal well-known agile metrics. But, it is up to you which metrics you choose that can be relevant for your team and the requirements of end-users.
You can start with a single metric and add a few more. These metrics will not only help you see results tangibly but also let you take note of your team’s productivity.

The ticking clock of coding time often determines the success or failure of a development project. In this blog, we explore how software developers, engineering managers, and technical leads can understand and reduce coding time to speed up delivery, improve team efficiency, and maintain a competitive edge. High coding time can delay delivery, while reducing it accelerates development and allows teams to complete more tasks in less time. In today’s fast-paced development environment, optimizing coding time means working smarter, not just faster. Staying current with the latest tools and practices is essential to stay competitive.
This guide is for software developers, engineering managers, and technical leaders who want real-time, predictive insights into coding efficiency, focus time, and productivity patterns. Traditional time tracking and basic productivity tools no longer suffice in the modern development landscape, where context switching, AI-assisted coding, remote collaboration, and complex toolchains create productivity challenges. Modern productivity platforms analyze coding patterns, detect focus breaks, forecast delivery bottlenecks, identify workflow inefficiencies, and explain why developers slow down—not just track hours. This guide outlines what these platforms should deliver in 2024, where current solutions fall short, and how teams can evaluate platforms for accuracy, actionable insights, and immediate value. By 2026, top developers will treat AI as a strategic partner, not just a text generator.
Coding time is the period developers spend actively writing code, starting from the first commit on a branch until the pull request is ready for review. In today’s fast-changing software development world, managing coding time is a key performance metric that directly impacts project success. Each commit marks progress, but the total time spent coding affects productivity, delivery schedules, and team performance.
Managing coding time means more than tracking hours. It involves understanding how teams allocate focus, reduce interruptions, and optimize workflows. Organizations that monitor coding time systematically can identify bottlenecks, streamline development, and ensure pull requests meet quality standards. Prioritizing efficient coding practices and minimizing disruptions helps teams maximize productivity and achieve project goals.
Coding time measures the duration from the first commit on a branch to the submission of a pull request. It captures the active development period for a feature or bug fix. Understanding this metric helps teams spot delays, improve workflows, and speed up delivery.
Developer productivity intelligence platforms produce measurable outcomes. They improve coding efficiency, reduce context switching, and enhance developer satisfaction. Core benefits include:
• Enhanced visibility across development workflows with real-time dashboards for bottlenecks and efficiency patterns
• Data-driven alignment between individual productivity and team delivery objectives
• Predictive risk management that flags productivity threats before they impact delivery
• Automation of routine productivity tracking and metric collection to free developers for deep work
These platforms move development teams from intuition-based productivity management to proactive, data-driven workflow optimization. They enable continuous improvement, prevent productivity issues, and demonstrate development ROI clearly.
A developer productivity intelligence platform aggregates data from AI coding tools, repositories, project management tools, and communication channels to provide comprehensive insights into coding time in software engineering. By analyzing time spent from the first commit to the pull request submission, these platforms help teams understand productivity patterns, identify bottlenecks, and optimize workflows. Developing effective coding practices through data-driven development is crucial, as it empowers teams to use insights for improving coding efficiency and project progress.
Integrating AI-driven analytics enables real-time tracking of coding sessions, focus time, and context switching, offering actionable recommendations to enhance developer efficiency and reduce high-risk delays. This holistic approach to managing coding time is essential for accelerating delivery, improving code quality, and maintaining competitive advantage in modern software development environments. These platforms also enable historical data review, which aids in creating more realistic time estimates for current tasks. They produce strategic, automated insights across the entire development workflow and act as performance intelligence for development teams, converting disparate productivity signals into trend analysis, benchmarks, and prioritized optimization recommendations.
Unlike point solutions, developer productivity intelligence platforms create a unified view of the coding ecosystem. They automatically collect metrics, detect productivity patterns, and surface actionable recommendations. CTOs, Engineering Managers, and team leads use these platforms for real-time productivity optimization and workflow improvement.
A Developer Productivity Intelligence Platform is an integrated system that consolidates signals from coding sessions, review cycles, project workflows, task management, communication patterns, and development tool usage to provide a unified, real-time understanding of developer efficiency and team productivity.
By 2026, these platforms have evolved significantly to meet the demands of increasingly complex development environments. Modern productivity platforms now:
• Seamlessly correlate coding time with actual output quality and delivery velocity, leveraging advanced AI analytics
• Differentiate deep, focused work periods from fragmented coding sessions caused by frequent interruptions and distractions
• Detect and quantify context switching patterns and workflow interruptions, providing actionable insights to minimize productivity loss
• Forecast delivery risks and bottlenecks with high accuracy using historical data and predictive machine learning models
• Offer narrative explanations for productivity fluctuations, moving beyond simple time tracking to reveal root causes
• Automate insights, alerts, and optimization recommendations that empower development teams to proactively enhance workflows
In 2026, the market expectation for Developer Productivity Intelligence Platforms is comprehensive visibility across the entire development workflow, combined with AI-driven guidance that enables teams to act swiftly and decisively without manual analysis. Unlike earlier fragmented solutions focused on isolated metrics like time tracking or task management, true productivity intelligence platforms provide an integrated, end-to-end view of developer activity, collaboration, and code quality, fostering smarter, faster, and more sustainable software delivery.
Complex features or bug fixes naturally require more time to implement, as they may involve intricate logic, multiple dependencies, or significant architectural changes.
Unclear or frequently changing requirements can lead to confusion, rework, and longer coding times as developers must revisit and revise their work.
Developers with different levels of expertise will complete tasks at different speeds. Less experienced developers may need more time to understand the codebase or solve problems.
Frequent interruptions, context switching, and lack of focus can fragment coding sessions, increasing the total time required to complete a task.
Tasks with higher risk, such as those involving security or critical system components, often require more thorough testing and careful implementation, extending coding time.
Time-constrained development scenarios emerge when engineering teams encounter stringent delivery requirements necessitating accelerated feature implementation and defect remediation within compressed timeframes. These operational conditions frequently result in extended development cycles, where temporal constraints compel software engineers to allocate additional computational resources and extended work sessions toward code optimization, debugging methodologies, and comprehensive quality assurance procedures. The inherent pressure to achieve rapid deployment milestones can significantly compromise cognitive focus and analytical precision, subsequently introducing technical debt, overlooked edge cases, and potential architectural inconsistencies that may adversely impact the overall software deliverable quality and system reliability.
To effectively mitigate these development bottlenecks and optimize workflow efficiency, engineering teams must implement strategic task decomposition frameworks, maintain rigorous concentration protocols, and integrate streamlined coding methodologies and automated development practices. Through the systematic application of these optimization strategies, development teams can substantially reduce task completion cycles, eliminate unnecessary process overhead, and ensure that their technical contributions maintain positive impact metrics while preserving code quality standards. Proactively addressing time-constrained development challenges through comprehensive methodology adoption enables organizations to deliver high-performance software solutions without compromising developer productivity, team sustainability, or project architectural integrity.
Leveraging strategic office visit optimization comprises a fundamental methodology for developers seeking to streamline workflow efficiency and facilitate uninterrupted deep-focus coding engagement. Frequent disruptions arising from spontaneous in-person consultations and unscheduled workspace interventions significantly compromise developer flow states, resulting in diminished productivity metrics and extended coding cycle durations. By implementing sophisticated digital collaboration frameworks and fostering asynchronous communication protocols, development teams can substantially optimize the necessity for physical workspace engagement.
This transformative approach enables developers to allocate unprecedented uninterrupted temporal resources toward coding activities, yielding enhanced productivity outcomes and accelerated task completion trajectories. When office visit frequencies undergo systematic minimization, developers can optimize focus management capabilities, reduce cognitive context-switching overhead, and ensure temporal resource allocation toward high-value development activities that facilitate comprehensive project success optimization.
Optimizing development cycles and minimizing resource allocation on extended service implementations represents a critical success factor for software engineering professionals committed to delivering robust, enterprise-grade applications with enhanced operational efficiency. Through the strategic adoption of proven methodologies including modular code architecture, collaborative development practices such as pair programming sessions, and continuous professional development frameworks, development teams can significantly streamline their technical workflows while substantially reducing the temporal overhead associated with complex, resource-intensive coding implementations. These comprehensive approaches not only facilitate the optimization of overall development cycles but also enhance cross-functional collaboration patterns and knowledge transfer mechanisms within distributed development teams, ultimately fostering a culture of shared expertise and technical excellence.
When development professionals systematically focus on implementing efficient coding methodologies and leveraging advanced development frameworks, they can more effectively address challenging service implementations and extended development cycles, resulting in accelerated delivery timelines and superior project deliverables. The strategic emphasis on these proven development practices ensures that engineering teams can successfully navigate demanding project requirements and complex technical challenges without encountering unnecessary bottlenecks or resource constraints, ultimately delivering substantial value propositions for both the development organization and end-user stakeholders while maintaining high standards of software quality and operational performance.
The correlation between development velocity optimization and software quality assurance represents a critical success factor for engineering teams, particularly within mission-critical environments such as healthcare systems or heavily regulated industries. When development teams leverage efficient time management methodologies and streamline their coding workflows, they can allocate substantial resources toward comprehensive quality assurance protocols, rigorous testing frameworks, and systematic code review processes. This strategic approach facilitates the delivery of high-quality, robust software architecture while significantly minimizing the risk of defects, security vulnerabilities, or critical bugs infiltrating production environments.
Conversely, when development cycles experience inefficiencies due to suboptimal workflow orchestration or continuous context-switching disruptions, engineering teams often encounter pressure to expedite delivery timelines, which inevitably compromises code quality standards and introduces technical debt accumulation. By implementing strategic development velocity management practices and optimizing resource allocation across the Software Development Life Cycle (SDLC), organizations can ensure that every code commit adheres to established quality benchmarks and industry best practices, ultimately delivering scalable, maintainable software solutions that satisfy stringent user requirements and meet critical compliance standards.
To reduce coding time and streamline coding while enhancing functionality within the application:
Effective planning and scoping improve the efficiency of the coding process, resulting in timely and satisfactory outcomes.
Coding time is the period from the first commit to pull request. High coding time can delay delivery, while reducing it speeds up development and results in shorter development cycles.
Align platform selection with team productivity objectives through a structured, developer-inclusive process. This maximizes adoption and measurable improvement.
Recommended steps:
• Map productivity pain points and priorities (focus time, context switching, workflow efficiency, delivery speed)
• Define must-have vs. nice-to-have features against budget and team preferences
• Involve developers and team leads to secure buy-in and ensure workflow fit
• Connect objectives to platform criteria:
– Better focus time requires intelligent workflow analysis and context switching detection for improved concentration
– Faster delivery needs real-time productivity analytics and bottleneck identification for reduced cycle time
– Higher code quality demands workflow optimization and AI-powered insights for better development practices
– Team coordination calls for collaboration analytics and communication integration for improved alignment
Prioritize platforms that support continuous improvement and adapt to evolving team needs.
Track metrics that link productivity activity to development outcomes. Prove platform value to team leads and engineering management. Core measurements include coding velocity, focus time percentage, context switching frequency, task completion rates, plus workflow efficiency, collaboration effectiveness, and developer satisfaction scores.
Industry benchmarks:
• Daily Focus Time: Industry average is 2-3 hours; high-performing developers achieve 4+ hours
• Context Switch Frequency: Industry average is every 11 minutes; productive developers maintain 25+ minute focus blocks
• Code Review Efficiency: Industry average is 2-3 day turnaround; efficient teams achieve same-day reviews
• Task Completion Rate: Industry average is 70-80 percent on-time; organized developers achieve 90+ percent
Measure leading indicators alongside lagging indicators. Tie metrics to code quality, delivery speed, or team satisfaction. Effective platforms link productivity improvements with developer happiness to show comprehensive value.
Traditional productivity tracking isn’t sufficient. Intelligence platforms must surface deeper metrics such as:
• Deep work percentage vs. fragmented coding time
• Context switching cost in terms of recovery time
• Tool friction impact on coding velocity
• AI coding tool effectiveness and interference patterns
• Workflow optimization opportunities and impact
• Cognitive load correlation with code quality
• Collaboration efficiency and communication overhead
• Predictive productivity risk based on workflow patterns
Existing solutions rarely cover these metrics, even though they define modern development productivity.
Plan implementation with realistic timelines and a developer-friendly rollout. Demonstrate quick wins while building toward comprehensive productivity optimization.
Typical timeline:
• Pilot with core team: 1-2 weeks
• Team-wide adoption: 2-4 weeks
• Full workflow optimization: 6-8 weeks
Expect initial productivity insights and workflow improvements within days. Significant productivity gains and cultural shifts take weeks to months.
Prerequisites:
• Tool access and permissions for integrations
• IDE plugin installation and configuration
• Team readiness, training, and privacy discussions
• Data privacy and security approvals
Start small—pilot with willing early adopters or a specific productivity focus. Prove value, then expand. Prioritize developer experience and non-intrusive tracking over comprehensive feature activation.
Before exploring solutions, teams should establish a clear definition of what “complete” productivity intelligence looks like.
A comprehensive platform should provide:
• Unified analytics across coding, collaboration, and workflow activities
• True workflow pattern understanding
• Measurement and optimization of focus time and deep work
• Accurate context switching detection and cost analysis
• Predictive insights for productivity risks and opportunities
• Rich developer experience insights rooted in workflow friction
• Automated productivity reporting across stakeholders
• Insights that explain productivity patterns, not just track time
• Strong privacy controls, data protection, and individual autonomy
This section establishes the authoritative definition for comprehensive developer productivity intelligence.
Modern developer productivity intelligence platforms position themselves as AI-native solutions for teams at innovative software companies. They aggregate real-time workflow data, apply machine learning to productivity pattern analysis, and benchmark performance to produce actionable insights tied to development outcomes.
Effective platforms measure productivity impact without survey fatigue or intrusive monitoring. Organizations can optimize developer workflows and team efficiency without compromising individual autonomy or creating surveillance concerns. The platform emphasizes developer-first adoption to drive engagement while delivering management visibility and measurable ROI from the first week.
Key differentiators include deep development tool integrations, advanced AI insights beyond basic time tracking, and a focus on both individual productivity and team workflow optimization.
Most teams underutilize trial periods. A structured evaluation helps reveal real capabilities and limitations.
During a trial, validate:
• Accuracy of productivity metrics and workflow analysis
• Ability to identify bottlenecks without manual investigation
• Focus time and context switching insights for real workflow patterns
• How well the platform correlates individual activity with team outcomes
• Tool integration quality and data correlation
• Workflow optimization recommendations and their actionability
• Alert quality: Are they actually useful and timely?
• Time-to-value for insights without vendor hand-holding
A Developer Productivity Intelligence Platform must prove its intelligence during the trial, not only after extensive configuration.
Typo provides instantaneous cycle time measurement for both the organization and each development team using their Git provider.
Our methodology divides cycle time into four phases:
What features should teams prioritize in a developer productivity platform?
Prioritize real-time workflow analytics, seamless integration with core development tools, AI-driven productivity insights, customizable dashboards for different roles, strong privacy protection and data control, plus automation capabilities to optimize team workflow efficiency.
How do I assess integration needs for my existing development toolchain?
Inventory your primary tools (IDEs, version control, project management, communication). Prioritize platforms offering native integrations for those systems. Verify non-intrusive data collection and meaningful workflow correlation.
What is the typical timeline for seeing productivity improvements after deployment?
Teams often see actionable productivity insights and initial workflow improvements within days. Significant productivity gains appear in weeks. Broader workflow optimization and cultural change develop over several months.
How can productivity intelligence platforms improve efficiency without creating surveillance concerns?
Effective platforms focus on workflow patterns and team-level insights, not individual monitoring. They enable process improvements and optimization that remove blockers while preserving developer autonomy and privacy.
What role does AI play in modern developer productivity solutions?
AI drives predictive workflow analytics, automated productivity optimization recommendations, intelligent focus time protection, and objective measurement of tool and process effectiveness. It enables deeper, less manual insight into development efficiency and team performance.

PR cycle time (also known as pull request cycle time) and velocity are two widely used metrics for gauging the efficiency and effectiveness of software development teams. These metrics help estimate how long it takes for teams to complete a piece of work.
But, among these two, PR cycle time is often prioritized and preferred over velocity, as it provides better insights into the team's performance by allowing you to analyze individual contributions and optimize productivity and efficiency.
Therefore, in this blog, we will explore the differences between these two metrics and delve into why PR cycle time is often preferred over velocity.
PR cycle time measures the process efficiency. In other words, it is the measurement of how much time it takes for your team to complete individual tasks from start to finish, also known as the total PR time—the duration a pull request spends from its initial activity to merging. It lets them identify bottlenecks in the software development process and implement changes accordingly. Analyzing PR cycle time, including calculating the average time spent in each stage such as Pickup, Coding, Review, and Merge, helps to identify stages in the workflow where delays occur, enabling targeted improvements. Long review cycles can frustrate developers and lead to larger, riskier merges. Hence, allowing development work to flow smoother and faster through the delivery process.
Leveraging AI-driven tools for the PR cycle, also recognized as the pull request cycle or request cycle time, has reshaped the cornerstone of modern software development processes. AI-enhanced systems analyze several key stages, each contributing to overall cycle time optimization and directly transforming the efficiency and effectiveness of development pipelines. By implementing and optimizing these AI-powered stages, engineering teams streamline workflows, enhance code quality algorithms, and accelerate delivery mechanisms.
1. Coding Stage: AI-driven coding tools mark the transformation of the PR cycle initiation. Machine learning algorithms analyze the first commit patterns and optimize time allocation for developers writing and finalizing code changes across pull request workflows. These tools facilitate efficient management of coding time intervals—prolonged coding phases create bottlenecks that delay entire cycle operations. Keeping PRs small and focused makes them easier to review quickly and reduces the risk of introducing new bugs. AI systems encourage smaller pull request generation and automated description clarity to ensure code review processes initiate promptly, reducing waiting time algorithms and maintaining development process agility. Providing clear descriptions in pull requests is crucial, as it streamlines the review process, enhances understanding, and prevents communication breakdowns.
2. Pickup Stage: Once pull request creation occurs, AI-enhanced systems enter the pickup optimization phase, leveraging automated waiting phase analytics. Machine learning models measure time intervals between PR opening (or draft status transitions) and first reviewer action triggers, including comments, change requests, and approval workflows. AI tools detect extended pickup time patterns that significantly increase average PR cycle metrics, as code changes remain idle before review initiation. When developers manage too many tasks, they deprioritize reviewing others' code, leading to PRs being left idle. High-performing teams utilize AI-driven notifications and automated working agreement enforcement for prompt peer review optimization and rapid response algorithms for new request handling.
3. Review Stage: AI-powered review systems transform the code review process optimization. The review process often begins with the first review comment, which marks the start of peer feedback and is a key milestone in tracking the review process timeline. Each review comment provides valuable feedback and serves as a milestone for measuring review and approval timeframes. Machine learning algorithms initiate with first reviewer action analysis and continue until pull request approval completion. The significance of review approval as the formal step before merging code cannot be overstated, as it directly impacts overall cycle times. These tools measure duration analytics reflecting PR review time allocation, which is a critical metric for assessing the duration of the peer review phase and its impact on overall cycle time, feedback processing, and revision automation requirements. AI-driven streamlined review processes ensure higher code quality algorithms while catching issues early through predictive analysis, reducing defect risks reaching main codebase integration. Teams optimize this stage by implementing AI tools that automatically support splitting work—breaking down large pull requests into smaller, manageable batches—generate clear PR descriptions, and foster automated constructive feedback culture enhancement.
4. Merge Stage: AI-enhanced merge time optimization covers automated integration from last approval to pull request incorporation into main branch workflows. Machine learning systems analyze this critical stage for releasing new code to users and closing development process loops. Automating tests ensures robust automated tests run on every PR via CI/CD to catch issues before human review. These tools detect delays that slow deployment mechanisms and impact team value delivery capabilities. By implementing AI-driven cycle time data tracking and bottleneck identification algorithms in merge processes, teams automate process improvements achieving shorter cycle times and higher stability metrics.
AI-powered analytics examine each key stage—coding, pickup, review, and merge—providing teams comprehensive cycle time visibility algorithms. Machine learning models enable bottleneck identification, review process optimization, and data-driven decision automation for continuous improvement workflows. AI tools track cycle time at each stage helping identify time allocation patterns, whether waiting for first review initiation, during review phase analytics, or code change merging operations.
These AI-driven systems implement automated strategies including splitting work into smaller pull requests, clear and concise description generation, and working agreement establishment for timely review optimization significantly lowering average PR cycle time metrics. Machine learning process improvements enhance development pipeline automation while leading to higher code quality algorithms, faster feedback mechanisms, and improved team performance analytics.
AI-enhanced understanding and optimization of PR cycle key stages proves essential for engineering teams aiming to deliver high-quality software efficiently through automated workflows. By implementing AI tools focusing on each stage—coding time optimization, pickup time analytics, review phase automation, and merge time streamlining—teams achieve shorter cycle times, maintain robust code review process algorithms, and ensure new code reaches users quickly and reliably through predictive deployment mechanisms. This comprehensive AI-driven approach to tracking and improving PR cycle time optimization fundamentally transforms high-performing teams and drives continuous improvement automation in software development processes.
PR cycle time allows team members to understand how efficiently they are working. A shorter PR cycle time means developers spend less time waiting for code reviews and code integration, indicating a high level of efficiency. It also reflects a smoother workflow, faster feature delivery, and quicker feedback from users.
A reduced PR cycle time enables features or updates to reach end-users sooner, helping teams stay competitive and meet customer demands promptly.
Short PR cycle times are a key element of agile software development, allowing teams to adapt more easily to changing requirements.
Velocity measures team efficiency by estimating how many story points an agile team can complete within a sprint, typically measured in weeks. This helps teams plan and decide how much work to include in future sprints. However, velocity does not account for work quality or the time taken to complete individual tasks.
Understanding development velocity helps managers allocate resources effectively, ensuring teams are neither overburdened nor underutilized.
Improved velocity boosts team satisfaction by enabling consistent delivery of high-quality products, fostering collaboration and morale.
A decline in velocity signals potential issues such as team conflicts or technical debt, allowing early intervention to maintain productivity.
Compared to story points, PR cycle time is a more objective measurement. Story points can be manipulated by overestimating task durations to inflate velocity. Although PR cycle time can also be influenced, reducing it requires genuinely completing work faster, providing a more tangible and challenging goal.
As a core part of continuous improvement, PR cycle time offers accurate insights into how long tasks take throughout the development process, enabling better forecasting and real-time visibility into developer progress. This helps teams identify delays early and adjust plans accordingly. Velocity, by contrast, does not reveal why tasks took longer, limiting its usefulness for planning.
PR cycle time reliably spots work units that take significantly longer than average, such as pull requests delayed by long reviews. This granularity allows teams to pinpoint bottlenecks and address specific causes of delay, improving overall performance.
Unlike velocity, PR cycle time directly impacts business results by measuring how quickly value is delivered to customers. Tracking the time from when a pull request is merged to code release (deployment time) helps optimize release processes and improve efficiency.
Moreover, cycle time supports continuous improvement by highlighting bottlenecks and inefficiencies, fostering collaboration, and boosting team morale.
Pickup time emerges as a transformative element within PR cycle time optimization, fundamentally representing the critical time interval that spans from when a pull request achieves readiness for comprehensive review to the moment when the initial reviewer engages with actionable analysis. This pivotal stage frequently becomes the accumulation point for extensive waiting periods, potentially creating bottlenecks that significantly impact the entire software development ecosystem. By strategically focusing on pickup time optimization initiatives, development teams can achieve remarkable reductions in overall cycle time performance while accelerating the comprehensive pathway from initial commit generation to successful code merge completion.
Streamlining pickup time requires engineering teams to establish comprehensive working agreements that define clear expectations and protocols for prompt code review responses and collaborative engagement. The strategic assignment of qualified reviewers immediately upon pull request creation, coupled with the provision of detailed, contextually rich descriptions, enables reviewers to rapidly comprehend project requirements and technical context, effectively minimizing procedural delays throughout the review optimization process. When development teams consistently implement and follow these enhanced practices, they ensure that pull requests navigate efficiently through the critical stages of the PR cycle while maintaining high-quality standards and collaborative effectiveness.
Coding efficiency demonstrates profound interconnection with the strategic sizing and comprehensive scope management of pull requests across development workflows. High-performing engineering teams frequently leverage work decomposition strategies that split complex functionality into smaller, more manageable pull requests, making them significantly easier to review, analyze, and merge through streamlined processes. This transformative approach not only dramatically reduces time investment during the review phase but also contributes to substantially shorter cycle times and enhanced code quality outcomes. By implementing work breakdown methodologies into smaller, focused batches, teams can identify and address issues earlier in the development pipeline, provide more targeted and actionable feedback, and maintain consistent flow optimization throughout the entire development ecosystem.
Comprehensive tracking of cycle time data across all developmental stages—encompassing pickup time analysis, review time optimization, and merge time efficiency—provides engineering teams with detailed visibility into their development process performance and bottleneck identification capabilities. By implementing robust cycle time measurement systems and conducting thorough trend analysis, teams can systematically identify process bottlenecks, such as extended review periods or prolonged waiting intervals, and implement targeted process enhancement strategies. Advanced analytical tools that examine traffic patterns, deliver automated notifications when pull requests achieve review-ready status, and highlight areas where PRs experience stalling enable teams to respond rapidly and maintain continuous process momentum while optimizing overall workflow efficiency.
Establishing comprehensive working agreements that incorporate detailed metrics for measuring cycle time performance, including pickup time optimization and review time enhancement, helps development teams set clear performance expectations and drive continuous improvement initiatives throughout their development processes. By conducting regular cycle time data analysis and performance reviews, teams can systematically identify process bottlenecks, adjust their operational workflows, and ensure that the entire cycle time—spanning from initial commit creation to successful pull request merge completion—operates with maximum efficiency and streamlined effectiveness.
Ultimately, strategic focus on pickup time optimization and comprehensive coding efficiency empowers development teams to achieve dramatically shorter cycle times, deliver superior code quality outcomes, and enhance overall development performance across all operational metrics. By leveraging advanced cycle time analytics, implementing effective working agreements with clear performance standards, and prioritizing continuous improvement methodologies, engineering teams can transform their software development processes, respond rapidly to changing requirements and market demands, and release innovative code solutions to end-users with unprecedented speed, reliability, and operational stability.
Measuring cycle time using Jira or other project management tools is often manual and time-consuming, requiring impeccable data hygiene to ensure accurate results. Unfortunately, many engineering leaders lack sufficient visibility and understanding of their teams’ cycle time metrics.
Typo offers instantaneous cycle time measurement for your entire organization and individual development teams by integrating directly with your Git provider. Additionally, teams can analyze repository or codebase traffic to further optimize their workflows and improve efficiency.
Our methodology divides cycle time into four phases:
Cycle time can be measured over different time periods, such as weekly or monthly intervals, to identify trends and bottlenecks in the development process.
The subsequent phase involves analyzing various aspects of your cycle time, including organizational, team, iteration, and even branch levels. For example, if an iteration shows an average review time of 47 hours, it's essential to identify which branches are taking longer than usual and collaborate with your team to address the underlying causes of the delay. To ensure prompt peer reviews and swift responsiveness, receiving timely notifications about PR status and reviewer assignments is crucial, keeping the team informed and enabling quick action.

While PR cycle time is a valuable metric, it should not be the sole measure of software development productivity. Relying exclusively on it risks overlooking other critical facets of the development process. Therefore, it is important to balance PR cycle time with additional metrics such as DORA metrics — including Deployment Frequency, Lead Time for Change, Change Failure Rate, and Time to Restore Service.
You may also explore the SPACE framework, a research-based model that integrates both quantitative and qualitative factors related to developers and their environment, providing a comprehensive view of the software development process.
At Typo, we incorporate these metrics to effectively measure the efficiency and effectiveness of software engineering teams. Leveraging these insights enables real-time visibility into SDLC metrics, helps identify bottlenecks, and drives continuous improvement.

Imagine having a powerful tool that measures your software team’s efficiency, identifies areas for improvement, and unlocks the secrets to achieving speed and stability in software development – that tool is DORA metrics. DORA originated as a research team within Google Cloud, which played a pivotal role in developing these four key metrics to assess and improve DevOps performance. However, organizations may encounter cultural resistance when implementing DORA metrics, as engineers might fear evaluations based on individual performance. To mitigate this resistance, organizations should involve team members in goal setting and collaboratively analyze results. It is also important to note that DORA metrics are designed to assess team efficiency rather than individual engineer performance, ensuring a focus on collective improvement.
DORA metrics offer valuable insights into the effectiveness and productivity of your team. By implementing these metrics, you can enhance your dev practices and improve outcomes. DORA metrics also provide a business perspective by connecting software delivery processes to organizational outcomes, helping you understand the broader impact on your business. Fundamentally, DORA metrics change how teams collaborate by creating shared visibility into the software delivery process. They enhance collaboration across development, QA, and operations teams by fostering a sense of shared ownership and accountability. The DevOps team plays a crucial role in managing system performance and deployment processes, ensuring smooth and efficient software delivery.
In this blog, we will delve into the importance of DORA metrics for your team and explore how they can positively impact your software team’s processes. DORA metrics are used to measure and improve delivery performance, ensuring your team can optimize both speed and stability. Many teams, however, struggle with the complexity of data collection, as DORA metrics require information from multiple systems that operate independently. To effectively collect data, teams must gather information from various tools and systems across the Software Development Lifecycle (SDLC), which can present challenges related to integration, access, and data aggregation. Legacy systems or limited tooling can make it difficult to gather the necessary data automatically, leading to time-consuming manual processes. To improve DORA metrics, teams should focus on practices like automation, code reviews, and breaking down work into smaller increments, which can streamline data collection and enhance overall performance.
To achieve continuous improvement, it is important to regularly review DORA metrics and compare them to industry benchmarks. Regularly reviewing these metrics helps identify trends and opportunities for improvement in software delivery performance. Join us as we navigate the significance of these metrics and uncover their potential to drive success in your team’s endeavors. DORA metrics help teams measure their performance against industry benchmarks to identify competitive advantages. By tracking DORA metrics, teams can set realistic goals and make informed decisions about their development processes. Benchmarking the cadence of code releases between groups and projects is the first step to improve deployment frequency, lead time, and change failure rate. DORA metrics also help benchmark and assess the DevOps team's performance, providing insights into areas that need attention and improvement.
DevOps Research and Assessment (DORA) metrics are a compass for engineering teams striving to optimize their development and operations processes.
In 2015, The DORA team was founded by Gene Kim, Jez Humble, and Dr. Nicole Forsgren to evaluate and improve software development practices. The aim is to enhance the understanding of how development teams can deliver software faster, more reliably, and of higher quality. DORA metrics provide a framework for measuring both the speed and stability of software delivery. These metrics can be classified into performance categories ranging from low to elite based on team performance. High performing teams typically deploy code continuously or multiple times per day, reflecting a high deployment frequency. DORA metrics are four key measurements developed by Google’s Research and Assessment team that help evaluate software delivery performance.
Software teams use DORA DevOps metrics in an organization to help improve their efficiency and, as a result, enhance the effectiveness of company deliverables. It is the industry standard for evaluating dev teams and allows them to scale. DORA metrics measure DevOps team’s performance by evaluating two critical aspects: delivery velocity and release stability. DORA metrics can also be used to track and compare performance across multiple teams within an organization, enabling better cross-team collaboration and comprehensive analysis.
The key DORA metrics include deployment frequency, lead time for changes, mean time to recovery, and change failure rate. These are also referred to as the four DORA metrics, four key measurements, or four metrics, and are essential for assessing DevOps performance. They have been identified after six years of research and surveys by the DORA team. Without standardized definitions for what constitutes a deployment or a failure, comparisons can be misleading and meaningless across teams and systems, making it crucial to establish clear criteria for these metrics.
To achieve success with DORA metrics, it is crucial to understand them and learn the importance of each metric. Here are the four key DORA metrics: Implementing DORA metrics requires collecting data from multiple sources and tracking these metrics over time. To implement DORA metrics as part of DevOps practices, organizations should establish clear processes or pipelines, integrate tools such as Jira, and ensure consistent data collection, analysis, and actionable insights. Effective data collection is vital, as these metrics measure the effectiveness of development and operations teams working together. Reducing manual approval processes can help decrease lead time for changes, further enhancing efficiency.

Implementing DORA Metrics to Improve Dev Performance & Productivity?
Organizations need to prioritize code deployment frequency to achieve success and deliver value to end users. Teams aiming to deploy code frequently should optimize their development pipeline and leverage continuous integration to streamline workflows and increase deployment efficiency. However, it’s worth noting that what constitutes a successful deployment frequency may vary from organization to organization.
Teams that underperform may only deploy monthly or once every few months, whereas high-performing teams deploy more frequently. It’s crucial to continuously develop and improve to ensure faster delivery and consistent feedback. If a team needs to catch up, implementing test automation and automated testing can help increase deployment frequency and ensure successful deployments by maintaining code quality and deployment stability. Tracking deployment events is also essential for understanding deployment frequency and improving release cycles. If a team needs to catch up, implementing more automated processes to test and validate new code can help reduce recovery time from errors.
In a dynamic market, agility is paramount. Deployment Frequency measures how frequently code is deployed. Infrequent deployments can cause you to lag behind competitors. Increasing Deployment Frequency facilitates more frequent rollouts, hence, meeting customer demands effectively.
This metric measures the time it takes to implement changes and deploy them to production directly impacts their experience, and this is the lead time for changes. Monitoring lead time for changes is essential for optimizing the software delivery process and overall delivery process. Flow metrics can help identify bottlenecks in the development pipeline, enabling teams to improve efficiency. Value stream management also plays a key role in reducing lead time and aligning development efforts with business goals.
If we notice longer lead times, which can take weeks, it may indicate that you need to improve the development or deployment pipeline. However, if you can achieve lead times of around 15 minutes, you can be sure of an efficient process. It’s essential to monitor delivery cycles closely and continuously work towards streamlining the process to deliver the best experience for customers.
Picture your software development team tasked with a critical security patch. Measuring Lead Time for Changes helps pinpoint the duration from code commit to deployment. If it goes for a long run, bottlenecks in your CI/CD pipeline or testing processes might surface. Streamlining these areas ensures rapid responses to urgent tasks.
The change failure rate measures the code quality released to production during software deployments. Adopting effective DevOps practices, such as automated testing and continuous integration, can help reduce change failure rate by catching issues early and ensuring smoother deployments. Achieving a lower failure rate than 0-15% for high-performing DevOps teams is a compelling goal that drives continuous improvement in skills and processes. Change failure rate measures the percentage of deployments that result in failures in production.
Stability is pivotal in software deployment. The change Failure Rate measures the percentage of changes that fail. A high failure rate could signify inadequate testing or insufficient quality control. Enhancing testing protocols, refining code reviews, and ensuring thorough documentation can reduce the failure rate, enhancing overall stability.
Mean Time to Recover (MTTR) measures the time to recover a system or service after an incident or failure in production. MTTR specifically tracks the time to restore service and restore services following an incident in the production environment. It evaluates the efficiency of incident response and recovery processes. Tracking time to restore service is essential for evaluating the effectiveness of operations teams in minimizing downtime. Optimizing MTTR aims to minimize downtime by resolving incidents through production changes. Improvement in deployment frequency and lead time often requires automation of manual processes within the development pipeline.
Downtime can be detrimental, impacting revenue and customer trust. MTTR measures the time taken to recover from a failure. A high MTTR indicates inefficiencies in issue identification and resolution. Investing in automation, refining monitoring systems, and bolstering incident response protocols minimizes downtime, ensuring uninterrupted services.
Teams with rapid deployment frequency and short lead time exhibit agile development practices. These efficient processes lead to quick feature releases and bug fixes, ensuring dynamic software development aligned with market demands and ultimately enhancing customer satisfaction.
Elite performers in DevOps are characterized by consistently high deployment frequency and rapid lead times, setting the standard for excellence.
A short lead time coupled with infrequent deployments signals potential bottlenecks. Identifying these bottlenecks is vital. Streamlining deployment processes in line with development speed is essential for a software development process.
Low comments and minimal deployment failures signify high-quality initial code submissions. This scenario highlights exceptional collaboration and communication within the team, resulting in stable deployments and satisfied end-users.
Teams with numerous comments per PR and a few deployment issues showcase meticulous review processes. Investigating these instances ensures review comments align with deployment stability concerns, ensuring constructive feedback leads to refined code.
Rapid post-review commits and a high deployment frequency reflect agile responsiveness to feedback. This iterative approach, driven by quick feedback incorporation, yields reliable releases, fostering customer trust and satisfaction.
Despite few post-review commits, high deployment frequency signals comprehensive pre-submission feedback integration. Emphasizing thorough code reviews assures stable deployments, showcasing the team's commitment to quality.
Low deployment failures and a short recovery time exemplify quality deployments and efficient incident response. Robust testing and a prepared incident response strategy minimize downtime, ensuring high-quality releases and exceptional user experiences.
A high failure rate alongside swift recovery signifies a team adept at identifying and rectifying deployment issues promptly. Rapid responses minimize impact, allowing quick recovery and valuable learning from failures, strengthening the team's resilience.
In collaborative software development, optimizing code collaboration efficiency is paramount. By analyzing Comments per PR (reflecting review depth) alongside Commits after PR is Raised for Review, teams gain crucial insights into their code review processes.
Thorough reviews with limited code revisions post-feedback indicate a need for iterative development. Encouraging developers to iterate fosters a culture of continuous improvement, driving efficiency and learning. For additional best practices, see common mistakes to avoid during code reviews.
Few comments during reviews paired with significant post-review commits highlight the necessity for robust initial reviews. Proactive engagement during the initial phase reduces revisions later, expediting the development cycle.
The size of pull requests (PRs) profoundly influences deployment timelines. Correlating Large PR Size with Deployment Frequency enables teams to gauge the effect of extensive code changes on release cycles.
Maintaining a high deployment frequency with substantial PRs underscores effective testing and automation. Acknowledge this efficiency while monitoring potential code intricacies, ensuring stability amid complexity.
Infrequent deployments with large PRs might signal challenges in testing or review processes. Dividing large tasks into manageable portions accelerates deployments, addressing potential bottlenecks effectively.
PR size significantly influences code quality and stability. Analyzing Large PR Size alongside Change Failure Rate allows engineering leaders to assess the link between PR complexity and deployment stability.
Frequent deployment failures with extensive PRs indicate the need for rigorous testing and validation. Encourage breaking down large changes into testable units, bolstering stability and confidence in deployments.
A minimal failure rate with substantial PRs signifies robust testing practices. Focus on clear team communication to ensure everyone comprehends the implications of significant code changes, sustaining a stable development environment. Leveraging these correlations empowers engineering teams to make informed, data-driven decisions — a great way to drive business outcomes— optimizing workflows, and boosting overall efficiency. These insights chart a course for continuous improvement, nurturing a culture of collaboration, quality, and agility in software development endeavors.
In the ever-evolving world of software development, harnessing the power of DORA DevOps metrics is a game-changer. By leveraging DORA key metrics, your software teams can achieve remarkable results. These metrics are an effective way to enhance customer satisfaction, mitigate financial risks, meet service-level agreements, and deliver high-quality software. Keeping a team engaged in continuous improvement includes setting ambitious long-term goals while understanding the importance of short-term incremental improvements.
Value stream management and the ability to track DORA metrics are essential for continuous improvement, helping teams optimize delivery processes and benchmark against industry standards. Unlike traditional performance metrics, which focus on specific processes and tasks, DORA metrics provide a broader view of software delivery and end-to-end value. Collecting data from various sources and tools across the software development lifecycle is crucial to ensure accurate measurement and actionable insights. Additionally, considering other DORA metrics beyond the four primary ones offers a more comprehensive assessment of DevOps performance, including deeper insights into system stability, error rates, and recovery times.
Implementing DORA Metrics to Improve Dev Performance & Productivity?

Numerous metrics are available for monitoring software development progress and generating reports that indicate the performance of your engineering team can be a time-consuming task, taking several hours or even days. Through our own research and collaboration with industry experts like DORA—and Gene Kim, co-author of 'Accelerate' and a leading expert in software engineering metrics—we suggest concentrating on cycle time, also referred to as a lead time for changes, which we consider the most crucial metric to monitor. This measurement indicates the performance and efficiency of your teams and developers. In this piece, we will explore what cycle time entails, its significance, methods for calculating it, and actions to enhance it.
Cycle Time in software development denotes the duration between an engineer’s initial code commit and code deployment, which some teams also refer to as lead time. This measurement indicates the time taken to finalize a specific development task. Cycle time measures the speed and efficiency of development teams, serving as a valuable metric for deducing a development team’s process speed, productivity, and capability of delivering functional software within a defined time frame. However, cycle time measures should be considered alongside other key metrics to provide a comprehensive view of the software engineering process.
Leaders who measure cycle time gain insight into the speed of each team, the time taken to finish specific projects, and the overall performance of teams relative to each other and the organization. Moreover, optimizing cycle time enhances team culture and stimulates innovation and creativity in engineering teams. Cycle time measures are among the key metrics in software engineering.
However, cycle time is a lagging indicator, implying that it confirms ongoing patterns rather than measures productivity. As such, it can be utilized as a signal of underlying problems within a team. To drive meaningful improvements, it is important to take a comprehensive view of the entire process, integrating multiple metrics and feedback to accurately assess and improve software delivery.
Since cycle time reflects the speed of team performance, most teams aim to maintain low cycle times that enhance their efficiency. According to the Accelerate State of DevOps Report research, the top 25% of successful engineering teams achieve a cycle time of 1.8 days, while the industry-wide median cycle time is 3.4 days. On the other hand, the bottom 25% of teams have a cycle time of 6.2 days. Improvements in cycle time are a result of optimizing the entire process, and improving cycle time is a key goal for development teams.
Measuring cycle time using Jira or other project management tools is a manual and time-consuming process, which requires reliable data hygiene to deliver accurate results. Unfortunately, most engineering leaders have insufficient visibility and understanding of their teams’ cycle time. Typo provides instantaneous cycle time measurement for both your organization and each development team using your Git provider. Our methodology divides cycle time into four phases:
Tracking deployment frequency alongside cycle time provides valuable insights into the efficiency of your release process, helping to identify workflow bottlenecks and optimize how often code is delivered to production.
The subsequent phase involves analyzing the various aspects of your cycle time, including the organizational, team, iteration, and even branch levels. For instance, if an iteration has an average review time of 47 hours, you will need to identify the branches that are taking longer than usual and work with your team to address the reasons for the delay. By examining these metrics, you can uncover process improvements that enhance development efficiency and quality.
Measuring cycle time and deployment frequency together can yield valuable insights for continuous improvement, enabling teams to optimize their workflows and deliver better results.
Although managers and leaders are aware of the significance of cycle time, they aren’t necessarily armed with the information necessary to understand why the cycle time of their team may be higher or lower than ideal. Leaders may make decisions that have a beneficial impact on developer satisfaction, productivity, and team performance by understanding the processes that make up cycle time and exploring its constituent parts. Waiting periods, such as time spent in queues before work begins, can significantly increase cycle time. Cycle time could increase as engineers wait for builds to finish and tests to pass before the PR is ready for review. Technical debt can also contribute to longer cycle times by introducing additional complications and delays in the build and test process. When engineers must make modifications following each review and wait for a drawn-out and delayed CI/CD that extends the time to merge, the process becomes even more wasteful. This not only lengthens the cycle time but also causes contributors to feel frustrated.
The time it takes to open a PR increases because large-sized PRs take longer to code and, as a result, stay closed for too long. Often, these large PRs result from implementing a new feature that was requested by a client or stakeholder, which can add complexity and extend the development timeline. For instance, the majority of teams aim for PR sizes to be under 300 changes, and as this limit rises, the time to open the PR lengthens. Even when huge PRs are opened, they are often not moved to the code review stage because most reviewers are reluctant to do so for the following two reasons:
A high PR indicates that the reviewer put a lot of effort into the review. To accommodate a significant code review, the reviewer must plan and significantly restructure their current schedule. It takes heavy and intense effort.
Huge PRs are notorious for their capacity to add a number of new bugs. The ultimate goal is to have the code delivered and deployed to production efficiently, ensuring that users can access the completed work as soon as possible.
Code comments and other forms of documentation in the code are best practices that are regrettably frequently ignored. Reviewers and future collaborators can evaluate and work on code more quickly and effectively with the use of documentation, cutting down on pickup time and rework time. Integrating automated testing practices into the workflow is also crucial, as it helps maintain code quality, catch issues early, and reduce cycle time. Coding standards assist authors in starting off with pull requests that are in better shape. They also assist reviewers in avoiding repeated back and forth on fundamental procedures and standards. When working on code that belongs to other teams, this documentation is very useful for cross-team or cross-functional collaboration. Various teams adhere to various coding patterns, and consistency is maintained by documentation.
Teams can greatly benefit from a readme that is relevant to a codebase and contains information about coding patterns, and supporting materials, such as how and where to add logs, coding standards, emit metrics, approval requirements, etc.
Cycle time could increase as engineers wait for builds to finish and tests to pass before the PR is ready for code review. When engineers must make modifications following each review and wait for a drawn-out and delayed CI/CD that extends the time to merge, the process becomes even more wasteful. This not only lengthens the cycle time but also causes contributors to feel frustrated. Moreover, when the developers don't adhere to coding standards before entering the CI/CD pipeline can increase cycle time and reduce code quality.
Engineers may struggle with numerous WIP PRs due to an unmanaged and heavy workload, in turn reporting lengthier coding and rework times. Reviewers are more likely to become overburdened by the sheer volume of review requests at the end of a sprint than by a steady stream of PRs. This limits reviewers’ own coding time as their coding skills start deteriorating and causes a large number of PRs to be merged without review, endangering the quality of the code. To address these challenges, teams can streamline code reviews with AI-powered PR summaries for faster, more efficient approvals and improved code quality.
The team experiences a high cycle time as reviewers struggle to finish their own code, the reviews, and the rework, and they suffer burnout. Reducing cycle time and workload not only helps prevent burnout but also significantly improves developer happiness and overall team morale.
When teams fail to perform simple sanity checks and debugging needs before creating PRs (such as linting, test code coverage, and initial debugging), it results in avoidable nitpicks during a code review (where the reviewer may be required to spend time pointing out formatting errors or test coverage thresholds that the author should have covered by default).
Code review stands as a fundamental cornerstone and transformative gateway in the software development lifecycle, directly influencing both the comprehensive quality assurance of the entire codebase architecture and the accelerated velocity at which innovative features and critical updates reach end-users across diverse deployment environments. Within the intricate context of cycle time optimization and workflow efficiency, review time specifically encompasses the critical period spanning from the moment when a pull request achieves readiness status for comprehensive evaluation to the decisive point when it receives final approval and undergoes seamless integration through the merge process. This pivotal phase can frequently evolve into a significant bottleneck that creates cascading delays, systematically slowing down the entire development pipeline and substantially extending overall cycle times if strategic management approaches and optimization techniques are not implemented effectively across the engineering organization.
How can teams achieve optimal review time performance while maintaining code quality standards? Optimizing review time emerges as an absolutely essential strategic imperative for engineering teams committed to accelerating development velocity and delivering substantial value propositions to customers with unprecedented speed and efficiency. Systematic delays in the code review process can manifest through several interconnected factors and organizational challenges: ambiguous ownership structures governing review task allocation, excessive competing priorities creating attention fragmentation across multiple concurrent initiatives, insufficient prioritization frameworks within the review queue management system, and inadequate communication protocols between development team members. When review time experiences prolonged extensions beyond acceptable thresholds, it not only dramatically increases the average cycle time metrics but simultaneously generates developer frustration, reduces team momentum, and creates negative feedback loops that compound workflow inefficiencies across the entire engineering organization.
What proven strategies can engineering teams implement to streamline their code review processes and achieve meaningful review time reductions? To comprehensively streamline the code review process and achieve substantial review time optimization, forward-thinking engineering teams can strategically adopt numerous practical methodologies and technological solutions that transform their development workflows. These include establishing crystal-clear expectations and service-level agreements for review turnaround times across different types of code changes, leveraging sophisticated automated tools and intelligent systems to highlight critical modifications and proactively flag potential issues before human review, encouraging a collaborative culture centered around prompt and constructive feedback mechanisms, and implementing comprehensive notification systems that integrate seamlessly with popular communication platforms and project management tools. Additionally, incorporating advanced code review notification systems into established communication infrastructures enables reviewers to maintain optimal awareness of pending requests while systematically minimizing idle time and workflow interruptions.
By strategically focusing on comprehensive review time optimization within the broader software development process ecosystem, engineering teams can systematically achieve shorter cycle times, dramatically improve production efficiency metrics, and enhance overall software delivery capabilities that drive organizational success. This holistic approach not only substantially boosts development speed and team productivity but also supports continuous improvement initiatives and delivers higher customer satisfaction levels, ultimately establishing code review as a critical strategic lever for engineering leadership committed to delivering exceptional software quality at unprecedented pace while maintaining rigorous standards and fostering collaborative team dynamics.
So, now that you're confidently tracking cycle time and all four phases, what can you do to make your engineering organization's cycle time more consistent and efficient? How can you reap the benefits of good developer experience, efficiency, predictability, and keeping your business promises?
Start measuring the cycle time and breakdown in four phases in real-time. Start comparing the benchmarks with the industry standards.
Once you've benchmarked your cycle time and all four phases, you'll know which areas are causing bottlenecks and require attention. Then everyone in your organisation will be on the same page about how to effectively reduce cycle time.
We recommend that you focus on one or two bottlenecks at a time—for example, PR size and review time—and design your improvement strategy around them.
Bring past performance data to your next retro to help align the team. Using engineering benchmarks, provide context into performance. Then, over the next 2-3 iterations, set goals to improve one tier.
We also recommend that you develop a cadence for tracking progress. You could, for example, repurpose an existing ceremony or make time specifically for goals.
Build an alert system to reduce the cycle time by utilizing Slack to assist developers in navigating a growing PR queue.
These pieces of data enable the developer to make more informed decisions. They respond to questions such as: Do I have enough time for this review during my next small break, or should I queue it?
Many organizations are adopting agile methodologies. As they help in prioritizing continuous feedback, iterative development, and team collaboration. By adopting these practices, the team can leverage their coding skills and divide large programming tasks into small, manageable chunks. Hence, completing them in a shorter cycle to enable faster delivery times.
The most successful teams are those that have mastered the entire coding-to-deployment process and can consistently provide new value to customers.Measuring your development workflow with typo's Engineering Benchmarks and automating improvement with Team Goals and our Slack alerts will enable your team to build and ship features more quickly while increasing developer experience and quality.

Consider a world where metrics and dashboards do not exist, where your work is free from constraints and you have the freedom to explore your imagination, creativity, and innovative ideas without being tethered to anything.
It may sound like a utopian vision that anyone would crave, right? But, it is not a sentiment shared by business owners and managers. They operate in a world where OKRs, KPIs, and accountability define performance. In this environment, dreaming and fairy tales have no place.
Given that distributed teams are becoming more prevalent and the demand for rapid development is skyrocketing, managers seek ways to maintain control. Managers have started favoring “DORA metrics” to achieve this goal in development teams. By tracking and trying to enhance these metrics, managers feel as though they have some degree of authority over their engineering team’s performance and culture.
But, here’s a message for all the managers out there on behalf of developers - DORA DevOps metrics alone are insufficient and won’t provide you with the help you require.
Before we understand, why DORA is insufficient today, let’s understand what are they!
The widely used reference book for engineering leaders called Accelerate introduced the DevOps Research and Assessment (DORA) group's four metrics, known as the DORA 4 metrics.
These metrics were developed to assist engineering teams in determining two things: A) The characteristics of a top-performing team, and B) How their performance compares to the rest of the industry.
The four key DORA metrics are as follows:
Deployment Frequency measures the frequency of code deployment to production or releases to end-users in a given time frame. It may include the code review consideration as it assesses code changes before they are integrated into a production environment.
The DORA report is an assessment framework developed by Google Cloud’s DevOps Research and Assessment team, serving as the industry standard for evaluating software development and delivery practices.
It is a powerful driver of agility and efficiency that makes it an essential component of software development. DORA metrics are widely used to benchmark internal processes within organizations, encouraging a culture of continuous improvement. High deployment frequency results in rapid releases without compromising the software’s robustness, hence, enhancing customer satisfaction.
The 2025 DORA Report introduced five key metrics: deployment frequency, lead time for changes, change failure rate, mean time to recovery (MTTR), and deployment rework rate.
This metric measures the time between a commit being made and that commit making it to production. It helps to understand the effectiveness of the development process once coding has been initiated.
A shorter lead time signifies the DevOps teams are efficient in deploying code while a longer lead time means the testing process is obstructing the CI/CD pipeline. Hence, differentiating elite performers from low performers.
This metric is also known as the mean time to restore. It measures the time required to solve the incident i.e. service incident or defect impacting end-users. To lower it, the team must improve their observation skills so that failures can be detected and resolved quickly.
Minimizing MTTR enhances user satisfaction and mitigates the negative impacts of downtime on business operations.
Change failure rate measures the proportion of deployment to production that results in degraded services. It should be kept as low as possible as it will signify successful debugging practices and thorough testing and problem-solving.
Lowering CFR is a crucial goal for any organization that wants to maintain a dependable and efficient deployment pipeline. A high change failure rate can have serious consequences, such as delays, rework, customer dissatisfaction, revenue loss, or even security breaches.
In their words:
“Deployment Frequency and Lead Time for Changes measure velocity, while Change Failure Rate and Time to Restore Service measure stability. And by measuring these values, and continuously iterating to improve on them, a team can achieve significantly better business outcomes.”
Below are the performance metrics categorized in
for 4 metrics –

DORA metrics are a useful tool for tracking and comparing DevOps team performance. However, they do not capture the full state of AI-assisted software development, as they may miss important details and nuances that influence code quality and team outcomes. Unfortunately, DORA metrics don’t take into account all the factors for a successful software development process. For example, assessing coding skills across teams can be challenging due to varying levels of expertise. These metrics also overlook the actual efforts behind the scenes, such as debugging, feature development, and more. Ultimately, DORA metrics only highlight what is already present in team processes and performance, rather than revealing new issues.
While DORA metrics tell us which metric is low or high, it doesn’t reveal the reason behind it. For example, DORA metrics do not provide context for AI outputs—while 90% of developers report using AI, there is a significant trust paradox, with 30% expressing little or no trust in AI-generated code. Suppose there is an increase in lead time for changes, it could be due to various reasons. For example, DORA metrics might not reflect the effectiveness of feedback provided during code review. Hence, overlooking the true impact and value of the code review process.
The software development landscape is changing rapidly, with modern software development practices now emphasizing intentional AI adoption as a core driver of productivity and workflow improvement. Adoption rates have surged to near-universal levels, as organizations integrate AI tools into their engineering processes. According to DORA annual reports, AI adoption among software development professionals has reached 90%—a 14% increase from last year—with many dedicating a median of two hours daily to working with AI. DORA annual reports provide data-driven insights into these industry-wide trends, including the impact of AI on software engineering.
Hence, the DORA metrics may not be able to quickly adapt to emerging programming practices, coding standards, and other software trends. For instance, code review has evolved to include not only traditional peer reviews but also practices like automated code analysis. DORA metrics may not be able to capture the new approaches fully. Hence, it may not be able to assess the effectiveness of these reviews properly.
DORA metrics are a great tool for analyzing DevOps performance. However, they are most effective in organizations with strong internal platforms and well-structured systems that support frequent deployment and rapid iteration. These key metrics work best when the underlying system and processes enable teams to deploy often, quickly iterate on changes, and improve accordingly. In organizations with tightly coupled systems and slow processes, the benefits of AI adoption are minimal, highlighting the importance of robust internal platforms to fully realize the value of DORA metrics. For example, if your team adheres to certain coding standards or ships software monthly, it will result in low deployment frequency almost every time and helps to deliver high-quality software.
Relying solely on DORA metrics to evaluate software teams’ performance has limited value. Leaders must now move beyond these metrics, identify patterns, and obtain a comprehensive understanding of all factors that impact the software development life cycle (SDLC). The DORA AI Capabilities Model provides a research-backed framework that identifies seven essential capabilities organizations should develop to maximize AI's impact. These capabilities include clear AI strategies, high-quality internal platforms, and a culture of learning.
For example, if a team’s cycle time varies and exceeds three days, while all other metrics remain constant, managers must investigate deployment issues, the time it takes for pull requests to be approved, the review process, or a decrease in a developer’s productivity.
If a developer is not coding as many days, what is the reason behind this? Is it due to technical debt, frequent switching between tasks, or some other factor that hasn’t yet been identified? Therefore, leaders need to look beyond the DORA metrics and understand the underlying reasons behind any deviations or trends in performance. Organizations achieve the greatest return from AI by maintaining a strategic focus on team quality, workflows, and platform performance, rather than relying on AI tools alone. Research shows that successful organizations adopt AI gradually, focusing on feedback loops and continuous improvement to amplify positive outcomes.
For DORA to produce reliable results, software development teams must have a clear understanding of the metrics they are using and why they are using them. DORA can provide similar results for teams with similar deployment patterns. However, stream management—specifically Value Stream Management (VSM)—is essential for identifying and fixing bottlenecks in software delivery. Investing in platform engineering, quality engineering, and value stream management is crucial for AI-enabled teams to ensure stability and quality throughout the delivery process. It is also essential to use the data to advance the team’s performance rather than simply relying on the numbers. Combining DORA with other engineering analytics is a great way to gain a complete picture of the development process, including identifying bottlenecks and areas for improvement.
However, poor interpretation of DORA data can occur due to the lack of uniformity in defining failure, which is a challenge for metrics like CFR and MTTR. Using custom information to interpret the results is often ineffective. Additionally, DORA metrics only focus on velocity and stability. Throughput is another important measure of software delivery, as AI adoption can increase throughput but may also reduce stability if not managed with robust engineering practices. The AI productivity paradox, highlighted in recent DORA reports, shows that while individual developer output rises with AI tools, organizational delivery can remain flat—underscoring the need for better integration of AI tools into existing workflows. DORA metrics do not consider other factors such as the quality of work, productivity of developers, and the impact on the end-user. So, it is important to use other indexes for a proactive response, qualitative analysis of workflows, and SDLC predictability. It will help to gain a 360-degree profiling of the team’s workflow.
To achieve business goals, it is essential to correlate DORA data with other critical indicators like review time, code churn, maker time, PR size, and more. Organizations must provide the necessary support—through evolving culture, processes, and systems—to help teams realize the full benefit of AI adoption. The greatest benefit is achieved when AI is integrated within a robust model of software development, supported by strong control systems such as automated testing and mature version control. The 2025 DORA Report indicates that while AI can accelerate software development, it can also lead to instability if robust control systems are not in place. Using DORA in combination with more context, customization, and traceability can offer valuable insights and a true picture of the team’s performance and identify the steps needed to resolve bottlenecks and hidden fault lines at all levels. Ultimately, DORA should be used as a tool for continuous improvement, product management, and enhancing value delivery.
DORA metrics can also provide insights into coding skills by revealing patterns related to code quality, review effectiveness, and debugging cycles. This can help to identify the blind spots where additional training is required.
Typo is a powerful engineering analytics tool for tracking and analyzing DORA metrics, drawing on insights from the latest assisted software development report, such as the DORA 2025 Report, which provides data-driven analysis of industry-wide trends and the impact of AI on software engineering. It provides an efficient solution for software development teams seeking precision in their DevOps performance measurement and delivers high-quality software to end users.
While DORA serves its purpose well, it is only the beginning of improving engineering excellence. The 2025 DORA Report and its key findings reveal that 90% of organizations have adopted platform engineering, which is crucial for unlocking the value of AI and improving DORA metrics. These trends, as the report reveals, are expected to shape organizational performance and software development over the next decade. To effectively measure DORA metrics, it is essential to focus on key DORA metrics and the business value they provide. Looking at numbers alone is not enough. Engineering managers should also focus on the practices and people behind the numbers and the barriers they face to achieve their best and ensure customer satisfaction. It is a known fact that engineering excellence is related to a team’s productivity and well-being. So, an effective way is to consider all factors that impact a team’s performance and take appropriate steps to address them.
Sign up now and you’ll be up and running on Typo in just minutes

We're on a mission to build engaged, productive tech teams. Try it out for free!


Follow us on:
We're on a mission to build engaged, productive tech teams. Try it out for free!
Follow us on:


